3D vs 2D Cell Culture: A Strategic Guide for Modern Research and Drug Discovery
This article provides a comprehensive analysis of 2D and 3D cell culture models for researchers and drug development professionals.
3D vs 2D Cell Culture: A Strategic Guide for Modern Research and Drug Discovery
Abstract
This article provides a comprehensive analysis of 2D and 3D cell culture models for researchers and drug development professionals. It explores the foundational principles of each system, details advanced methodological approaches and their specific applications in cancer research and toxicology, and addresses key challenges in implementation. By offering a direct comparison of predictive validity, cost, and throughput, this guide serves as a strategic resource for selecting the optimal model to enhance the physiological relevance of in vitro studies and improve the success rate of preclinical drug discovery.
From Flat Biology to 3D Realism: Understanding Core Principles
For over a century, two-dimensional (2D) cell culture has been the foundational tool of biological research, providing invaluable insights into cellular mechanisms in a simple and controlled environment. However, the growing recognition that cells grown on flat plastic surfaces often fail to replicate the complex physiology of human tissues has accelerated the adoption of three-dimensional (3D) culture techniques. This guide provides an objective comparison of these two models, equipping researchers and drug development professionals with the data and context needed to select the appropriate system for their research goals.
Core Model Definitions and Historical Context
In a 2D cell culture, cells grow as a single, adherent layer on a flat, rigid surface, typically treated plastic in flasks, dishes, or multi-well plates [1] [2]. This environment forces cells to adopt unnatural flattened morphologies and disrupts their native polar organization.
In contrast, a 3D cell culture allows cells to grow in all three spatial dimensions, forming tissue-like structures such as spheroids, organoids, or cells embedded within a scaffold or hydrogel [1] [3]. This setup preserves in vivo-like cell-cell and cell-extracellular matrix (ECM) interactions, creating microenvironments with gradients of oxygen, nutrients, and signaling factors [4] [5].
The shift towards 3D models is driven by the critical need for more predictive pre-clinical data. A prominent example from cancer research illustrates this point: a promising therapy successfully killed tumor cells in 2D culture and passed animal trials, only to fail badly in Phase I human trials. The failure was attributed to the flat, simplistic 2D model, which could not replicate the complex 3D ecosystem of a real tumor [3].
The following tables summarize key comparative data from recent studies, highlighting the performance differences between 2D and 3D models in various experimental contexts.
Table 1: Functional and Proteomic Comparison in Muscle Cell Maturation
| Parameter | 2D Monolayer Culture | 3D Hydrogel Culture | Research Context |
|---|---|---|---|
| Phenotype at Day 8 | Mixed fiber type [6] | Predominantly slow-twitch phenotype [6] | Human skeletal muscle cell differentiation [6] |
| Phenotype at Day 21 | Not specified | Fast-twitch phenotype (↑ myosin-2, Log2(FC)>1.29, p<0.05) [6] | Human skeletal muscle cell differentiation [6] |
| Mitochondrial Maturity | Less mature | Enhanced [6] | Human skeletal muscle cell differentiation [6] |
| Peak Contractile Force | Not the peak | Achieved at 8 days of differentiation [6] | Human skeletal muscle cell differentiation [6] |
| Contractile Force at Day 21 | Not specified | Reduced by >40% from peak [6] | Human skeletal muscle cell differentiation [6] |
| Passive Tension | Not specified | Increased by >20% with prolonged culture [6] | Human skeletal muscle cell differentiation [6] |
Table 2: Model Performance in Disease and Toxicity Studies
| Research Application | 2D Model Performance | 3D Model Performance | Implications |
|---|---|---|---|
| Drug Penetration & Efficacy | Often overestimates drug efficacy; all cells are equally exposed [3] [2]. | Models diffusion barriers; can predict resistance due to poor penetration [3] [5]. | 3D models provide more realistic drug response data. |
| Tumor Biology | Lacks spatial organization and hypoxic cores [7]. | Recapitulates tumor microenvironment with hypoxic, necrotic cores [7] [5]. | Essential for studying cancer invasion, metastasis, and therapy resistance. |
| Hepatocyte Function | Rapid loss of tissue-specific function (e.g., CYP enzyme activity) [8]. | Maintains higher levels of tissue-specific function and gene expression [5] [8]. | Critical for accurate toxicology and pharmacokinetic studies. |
| Viral Infection (Influenza A) | Standard model, but lacks physiological complexity of tissue [9]. | Provides a more physiologically relevant platform; replication varies with matrix [9]. | Improves understanding of virus-host interactions in a tissue-like context. |
Detailed Experimental Protocols from Key Studies
Protocol: Generating 3D Human Skeletal Muscle Constructs
This protocol is adapted from a 2025 quantitative proteomic study that compared myotube maturation in 2D versus 3D cultures [6].
- Cell Source: Human skeletal muscle cells (myoblasts).
- 3D Hydrogel Encapsulation: Myoblasts are suspended within a hydrogel matrix, often a basement membrane extract like Matrigel, to provide a 3D scaffold that mimics the native extracellular matrix.
- Differentiation: Cells are switched to a low-serum differentiation medium to induce fusion into multinucleated myotubes.
- Culture Duration: Constructs are maintained for up to 21 days to study late-stage maturation.
- Functional Analysis: Contractile and passive forces are measured to assess functional maturity.
- Proteomic Analysis: Cells are lysed at specific timepoints (e.g., Day 8 and Day 21) for quantitative mass spectrometry, allowing for a comprehensive comparison of protein expression profiles between 2D and 3D cultures [6].
Protocol: Establishing Multicellular Colorectal Tumour Spheroids (MCTS)
This protocol is based on a 2025 study that compared various 3D-culture techniques for CRC cell lines [7].
- Cell Lines: Eight common CRC cell lines (e.g., DLD1, HCT116, SW480).
- Techniques Compared:
- Liquid Overlay: Cell suspension plated on non-adherent surfaces coated with agarose.
- Hanging Drop: Cells aggregated by gravity in suspended droplets.
- U-bottom Plates: Use of round-bottom, ultra-low attachment plates to promote spheroid formation.
- Matrix Variation: U-bottom plates are used with and without various hydrogels, including Matrigel, collagen type I, or methylcellulose, to test for compact spheroid formation.
- Co-culture: Incorporation of immortalized colonic fibroblasts (e.g., CCD-18Co) to model tumor-stroma interactions in a 3D setting.
- Outcome Measures: Spheroid morphology (compact vs. loose aggregates) and cell viability are analyzed to determine the optimal method for each cell line. A novel, cost-effective method using regular multi-well plates treated with an anti-adherence solution was also validated [7].
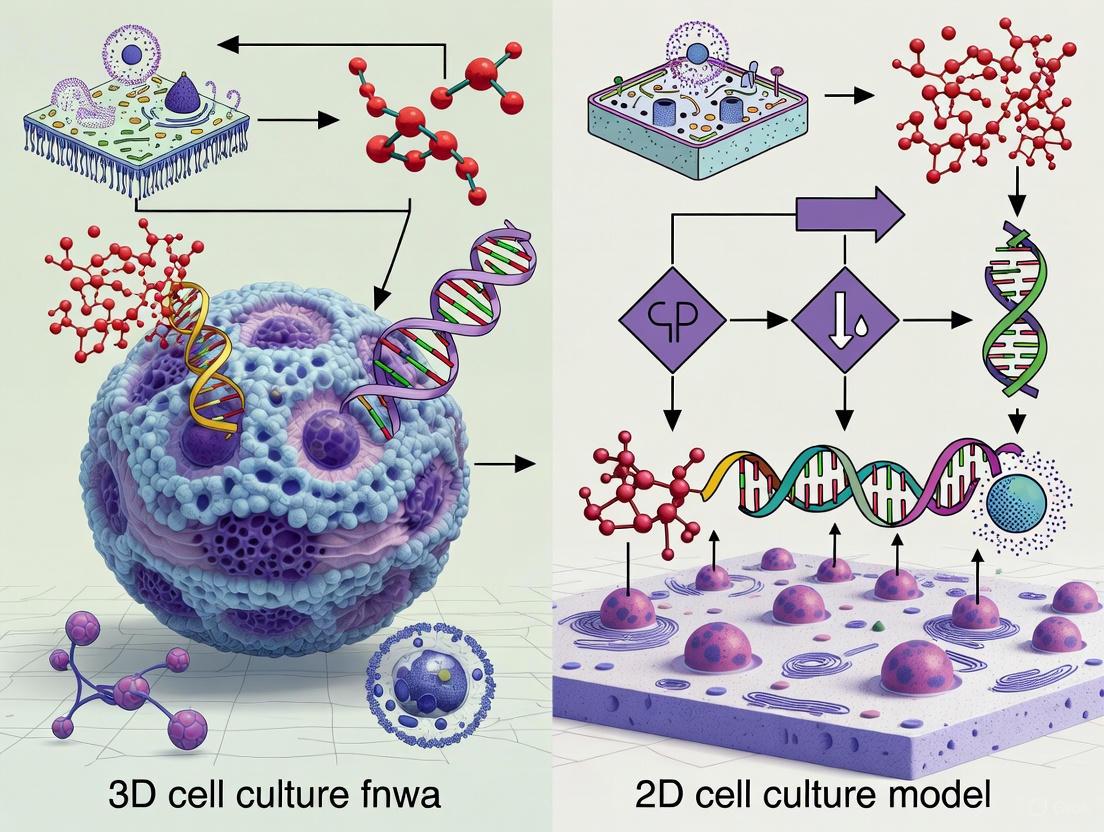
Visualizing the Tumor Microenvironment and Experimental Flow
The biological complexity of a 3D spheroid is a key driver of its physiological relevance. The following diagram illustrates the internal structure of a mature multicellular tumor spheroid.
Selecting the right model and methodology is a critical first step in experimental design. The workflow below outlines a strategic approach for comparing 2D and 3D cultures.
The Scientist's Toolkit: Essential Research Reagents
Establishing robust 2D and 3D cultures requires specific materials and reagents. The following table details key solutions used in the featured experiments and the broader field.
Table 3: Key Reagent Solutions for Cell Culture Research
| Reagent / Material | Function in Research | Application Context |
|---|---|---|
| Ultra-Low Attachment Plates | Prevents cell adhesion, forcing cells to aggregate and form 3D spheroids [7] [2]. | High-throughput spheroid formation (e.g., in U-bottom wells). |
| Hydrogels (Matrigel, Collagen, Alginate) | Acts as a 3D scaffold that mimics the extracellular matrix (ECM); provides mechanical and biochemical cues for cells [6] [7] [9]. | Used for embedding cells in 3D space (e.g., muscle constructs, spheroid formation). |
| Methylcellulose (MC) | A viscosity-increasing polymer that aids in cell aggregation and spheroid formation [7] [9]. | Often combined with other hydrogels like alginate to improve spheroid characteristics. |
| Anti-Adherence Solution | Coats standard cultureware to create a non-adherent surface at a lower cost than specialized plates [7]. | A cost-effective method for generating spheroids in regular multi-well plates. |
| Specialized Media Formulations | Provides necessary nutrients, growth factors, and differentiation cues tailored to specific cell types and culture dimensions [6] [9]. | Essential for maintaining viability and promoting maturation in both 2D and 3D systems. |
The choice between 2D and 3D cell culture is not a binary one but a strategic decision based on the research question. 2D models remain the workhorse for high-throughput screening, genetic manipulation, and fundamental mechanistic studies where simplicity, cost, and reproducibility are paramount [3] [8]. 3D models are indispensable when the research goal requires physiological relevance, such as studying tissue architecture, drug penetration, tumor biology, or complex host-pathogen interactions [7] [9] [8].
A powerful and increasingly adopted strategy in advanced labs is the tiered approach: using 2D models for initial high-throughput screening to narrow down candidates, followed by validation in more physiologically relevant 3D systems, and potentially culminating in patient-derived organoids for personalized therapy testing [3]. This hybrid workflow leverages the strengths of both models, enhancing the predictive power and efficiency of preclinical research.
For decades, two-dimensional (2D) cell culture has served as a fundamental tool in biological research, contributing significantly to our understanding of cellular mechanisms and drug development [10]. However, the scientific community increasingly recognizes that cells grown in flat, monolayer conditions behave fundamentally differently than they do in living organisms [11] [12]. This comparison guide objectively examines the key limitations of 2D culture systems, focusing on how they alter cellular morphology, gene expression patterns, and drug responses, thereby limiting their predictive value for clinical outcomes.
Morphological and Architectural Disparities
The physical environment of 2D culture imposes artificial constraints that dramatically affect cell structure and organization. In traditional 2D systems, cells are forced to adhere to flat, rigid plastic or glass surfaces, creating unnatural polarity and flattened morphology [12]. This environment lacks the three-dimensional spatial cues present in living tissues, resulting in compromised cytoarchitecture and disrupted cell-cell interactions [11] [10].
In contrast, three-dimensional (3D) models such as spheroids recapitulate the complex architecture of in vivo tumors, exhibiting three distinct cellular zones: (a) an outer layer of highly proliferative cells, (b) an intermediate layer containing quiescent cells, and (c) an inner core characterized by hypoxic and acidic conditions [11]. This cellular heterogeneity creates critical gradients of nutrients, oxygen, pH, and signaling molecules that profoundly influence cellular behavior and drug penetration [11] [13].
Table 1: Quantitative Comparison of Morphological and Growth Characteristics
| Parameter | 2D Culture System | 3D Culture System | Experimental Evidence |
|---|---|---|---|
| Spatial Organization | Monolayer; forced apical-basal polarity | Multilayered; natural tissue-like organization | Spheroids show concentric zones of proliferation, quiescence, and necrosis [11] |
| Cell Morphology | Flattened, stretched | Volume-preserved, natural shape | Cells in 3D maintain in vivo-like morphology [12] [10] |
| Growth Pattern | Uniform, exponential | Heterogeneous, physiologically constrained | 3D models show reduced proliferation rates due to diffusion limitations [13] |
| Cell-ECM Interactions | Limited to basal surface | Omnidirectional, natural integrin engagement | 3D cultures enable dynamic cell-matrix interactions [11] [12] |
Gene Expression and Molecular Alterations
The artificial physical environment of 2D culture systems induces significant molecular alterations that distance cultured cells from their in vivo counterparts. Transcriptomic analyses reveal substantial differences in gene expression profiles between 2D and 3D cultures, with 3D models demonstrating expression patterns that more closely resemble those found in vivo [11] [14].
Research comparing colorectal cancer cell lines cultured in 2D versus 3D systems found significant dissimilarity in gene expression profiles involving thousands of up/down-regulated genes across multiple pathways for each cell line [14]. Similarly, in prostate cancer cell lines, genes including ANXA1 (a potential tumor suppressor), CD44 (involved in cell-cell interactions), OCT4, and SOX2 (related to self-renewal) were significantly altered in 3D cultures [13]. These molecular changes directly impact cellular behavior and drug sensitivity.
Table 2: Gene Expression Differences Between 2D and 3D Cultures
| Gene/Pathway Category | 2D Expression Profile | 3D Expression Profile | Biological Impact |
|---|---|---|---|
| EMT Markers | Altered expression patterns | Physiologically relevant expression | Affects invasion and metastasis capabilities [11] |
| Stemness Markers (OCT4, SOX2) | Reduced expression | Upregulated expression | Enhanced self-renewal capacity in 3D [13] |
| Drug Metabolism Genes (CYP2D6, CYP2E1) | Variable expression | Upregulated in 3D hepatocellular carcinoma models | Altered drug processing and toxicity [13] |
| Hypoxia-associated Genes | Minimal expression | Significant upregulation (SLC2A1, ALDOC, PFKFB4) | Enhanced drug resistance in 3D models [10] |
| Matrix Organization Genes | Downregulated | Upregulated in breast cancer 3D models | Improved tissue organization and signaling [11] |
The following diagram illustrates how the culture environment influences gene expression and cellular behavior through key signaling pathways:
Drug Response and Therapeutic Efficacy
Perhaps the most clinically significant limitation of 2D culture systems is their poor predictive value for drug responses observed in patients. The altered morphology and gene expression patterns in 2D cultures directly translate to misleading drug sensitivity data, contributing to the high failure rate of compounds that progress from preclinical to clinical stages [3] [13].
Studies have consistently demonstrated that 3D cultured cells exhibit dramatically different drug sensitivity profiles compared to their 2D counterparts. Patient-derived head and neck squamous cell carcinoma spheroids showed greater viability following treatment with escalating doses of cisplatin and cetuximab compared to 2D cultures [11]. Similarly, research on colorectal cancer cell lines revealed significantly different responsiveness to 5-fluorouracil, cisplatin, and doxorubicin between 2D and 3D models [14].
Table 3: Drug Response Differences Between 2D and 3D Cultures
| Response Parameter | 2D Culture | 3D Culture | Clinical Relevance |
|---|---|---|---|
| Drug Penetration | Uniform access throughout population | Gradient-dependent diffusion | Mimics penetration barriers in solid tumors [11] |
| Hypoxia-Induced Resistance | Largely absent | Prominent in spheroid cores | Recapitulates treatment-resistant tumor regions [11] |
| Proliferation-Dependent Drug Efficacy | Overestimated due to uniform proliferation | Heterogeneous response based on proliferation zones | Better predicts variable treatment effects [13] |
| IC50 Values | Generally lower | More physiologically relevant | 3D models predict clinical doses more accurately [14] |
| Microenvironment-Mediated Resistance | Limited representation | Includes ECM-mediated drug binding and sequestration | Accounts for additional resistance mechanisms [15] |
Experimental Protocols for Comparative Studies
To generate robust comparative data between 2D and 3D systems, researchers require standardized methodologies. Below are detailed protocols for establishing parallel 2D and 3D culture models based on cited experiments.
Protocol 1: Scaffold-Free Spheroid Formation for Drug Screening
This protocol, adapted from the colorectal cancer comparison study [14], enables direct comparison of drug responses between 2D and 3D systems:
Cell Seeding for 2D Cultures: Seed cells at a density of 5×10³ cells/well in standard 96-well tissue culture plates. Use appropriate complete medium (e.g., DMEM with 10% FBS) and maintain in a humidified atmosphere of 5% CO₂ at 37°C.
Spheroid Formation for 3D Cultures: Prepare a cell suspension at the same density (5×10³ cells in 200μL). Transfer aliquots to Nunclon Sphera super-low attachment U-bottom 96-well microplates to promote self-assembly.
Culture Maintenance: For 3D cultures, perform three consecutive 75% medium changes every 24 hours to support spheroid development without disruption.
Drug Treatment: After 72 hours (or when 3D spheroids have formed), add therapeutic compounds at equivalent concentrations to both systems.
Viability Assessment: At desired endpoints, assess cell viability using colorimetric assays such as CellTiter 96 Aqueous Non-Radioactive Cell Proliferation Assay (MTS). For 3D spheroids, consider additional imaging to assess structural integrity.
Protocol 2: Metabolic Analysis in Microfluidic 3D Cultures
This protocol, based on the tumor-on-chip research [13], enables real-time monitoring of metabolic differences:
2D Culture Setup: Seed cells in conventional culture plates or microfluidic chips coated with appropriate adhesion substrates.
3D Hydrogel Embedding: Mix individual cells with collagen-based hydrogel at a concentration of 2-5×10⁶ cells/mL. Polymerize inside microfluidic chips at 37°C for 30 minutes.
Perfusion Culture: Apply continuous medium flow at 0.1-0.5 μL/minute to both systems using programmable syringe pumps.
Metabolite Monitoring: Collect effluent daily for analysis of glucose, glutamine, and lactate concentrations using commercial assay kits or HPLC.
Endpoint Analysis: Quantify metabolically active cells using Alamar Blue reagent and normalize metabolite consumption/production rates to cell number.
The following workflow diagram illustrates the parallel experimental setup for comparing 2D and 3D culture systems:
The Scientist's Toolkit: Essential Research Reagents
Successful comparative studies between 2D and 3D systems require specific materials and reagents. The following table details essential components for these investigations:
Table 4: Essential Reagents for 2D vs. 3D Comparative Studies
| Reagent/Category | Specific Examples | Function & Application | Considerations |
|---|---|---|---|
| 3D Culture Surfaces | Nunclon Sphera plates, Poly-HEMA coated plates | Prevent cell attachment, promote spheroid self-assembly | U-bottom wells enhance spheroid uniformity [14] |
| Scaffold Materials | Matrigel, collagen type I, synthetic PEG hydrogels | Mimic extracellular matrix, provide 3D support | Batch variability in natural hydrogels affects reproducibility [12] [10] |
| Microfluidic Systems | Organ-on-chip platforms, microbioreactors | Enable perfusion, gradient formation, real-time monitoring | Allow control of microenvironmental parameters [12] [13] |
| Viability Assays | CellTiter 96 MTS, Alamar Blue, ATP-based assays | Quantify metabolic activity and cell viability | Penetration efficiency varies in 3D models; require validation [14] |
| Advanced Imaging Tools | Confocal microscopy, light-sheet microscopy, OCT | Visualize internal structure of 3D models | Standard microscopy insufficient for thick 3D structures [16] |
The collective evidence demonstrates that 2D culture systems introduce significant artifacts in cellular morphology, gene expression, and drug response that limit their translational relevance. The altered physical environment in 2D cultures triggers molecular changes that distance cells from their in vivo phenotypes, particularly for solid tumors where three-dimensional architecture and microenvironmental gradients play crucial functional roles [11] [10]. While 2D systems remain valuable for specific applications such as high-throughput initial compound screening and genetic manipulation [3], researchers must recognize their limitations when modeling complex biological processes. The scientific community increasingly acknowledges that incorporating 3D culture technologies into preclinical workflows provides more physiologically relevant data, potentially bridging the translational gap between traditional in vitro models and clinical outcomes [16] [15]. As these advanced technologies continue to evolve and standardize, they promise to enhance the predictive accuracy of preclinical research and improve success rates in drug development pipelines.
The journey of a promising cancer therapy from the lab to the clinic is fraught with failure. Many compounds demonstrate efficacy in preliminary models only to prove ineffective in human trials. A significant contributor to this high attrition rate is the reliance on traditional two-dimensional (2D) cell cultures—flat, monolayer systems that fail to capture the complex three-dimensional reality of human tumors [3]. In patients, tumors are not flat; they are dense, three-dimensional ecosystems with intricate architectures known as the tumor microenvironment (TME) [3]. This realization has fueled a paradigm shift toward three-dimensional (3D) cell culture models, which bridge the critical gap between simple 2D cultures and complex, costly animal models [11] [17].
The core advantage of 3D models lies in their ability to recapitulate the TME and native tissue architecture. They restore the morphological, functional, and microenvironmental features of human tissues, enabling more accurate study of tumor progression, drug penetration, and therapeutic resistance [18] [11]. This guide provides an objective comparison between 2D and 3D cell culture models, focusing on their performance in mimicking the TME, supported by experimental data and detailed protocols.
Fundamental Differences: 2D vs. 3D Architecture and Their Biological Impact
The transition from 2D to 3D culture is not merely a technical change but a fundamental shift that restores critical physiological context to cells. The table below summarizes the key differences between these two model systems.
Table 1: Core Characteristics of 2D vs. 3D Cell Culture Models
| Parameter | 2D Culture | 3D Culture |
|---|---|---|
| Cell Morphology | Flat, stretched | In vivo-like, rounded/spherical [19] |
| Spatial Organization | Single layer on a planar surface | Multi-layered, complex structures [20] |
| Cell-Cell & Cell-ECM Interactions | Limited, primarily in one plane | Extensive, in all dimensions [19] [11] |
| Cell Polarity | Lack of polarity or even disappearance | Maintained polarity [19] |
| Proliferation | Rapid, uniform | Slower, heterogeneous [19] [13] |
| Nutrient & Oxygen Gradients | Uniform access | Physiological gradients (e.g., hypoxic core) [18] [11] |
| Gene Expression & Signaling | Altered, simplified | In vivo-like profiles [13] [11] |
| Drug Response | Often overestimates efficacy | Better predicts in vivo resistance [3] [18] |
These fundamental differences arise because cells in a 3D matrix, unlike those on 2D plastic, are embedded within a dynamic network of extracellular matrix (ECM) components. The ECM is not just a structural scaffold but a bioactive environment composed of proteins (e.g., collagen, fibronectin), glycoproteins, and proteoglycans that provide biochemical and mechanical cues essential for normal cell function and differentiation [11] [21]. In 3D cultures, cells can dynamically engage with this ECM and surrounding cells, creating natural gradients of oxygen, nutrients, and pH that drive the formation of heterogeneous cell populations—a hallmark of solid tumors [3] [18].
Diagram: The Tumor Microenvironment in 3D Architecture
Diagram 1: Zonal heterogeneity within a 3D tumor spheroid, showing how physiological gradients create distinct cellular regions that mimic in vivo tumors.
Quantitative Comparisons: Experimental Data Revealing the 3D Advantage
Drug Response and Resistance
A critical failure of 2D models is their tendency to overestimate drug efficacy. Cells in 3D cultures consistently demonstrate increased resistance to chemotherapeutic agents, more accurately mirroring clinical responses. For instance, colon cancer HCT-116 cells in 3D culture show greater resistance to drugs like melphalan, fluorouracil, oxaliplatin, and irinotecan compared to their 2D counterparts—a phenomenon also observed in vivo [18]. This resistance in 3D models is attributed to factors like limited drug penetration, the presence of quiescent cells, and altered gene expression profiles [11].
Metabolic and Proliferative Heterogeneity
Recent studies using advanced microfluidic chips have enabled daily monitoring of metabolites, providing quantitative insights into the metabolic differences between 2D and 3D cultures.
Table 2: Metabolic and Proliferation Differences in 2D vs. 3D Cultures (Data derived from microfluidic studies) [13]
| Parameter | 2D Culture | 3D Culture | Biological Implication |
|---|---|---|---|
| Proliferation Rate | High, glucose-dependent | Reduced, less glucose-dependent | 3D models contain non-proliferating, quiescent cells [13] |
| Glucose Consumption (per cell) | Lower | Increased | 3D cells are more metabolically active [13] |
| Lactate Production | Lower | Elevated | Enhanced Warburg effect in 3D [13] |
| Cell Survival under Glucose Restriction | Poor (days) | Extended (over 10 days) | 3D cells activate alternative metabolic pathways [13] |
| Glutamine Consumption | Lower | Elevated under glucose restriction | Metabolic flexibility in 3D models [13] |
This data underscores that 3D cultures exhibit metabolic profiles that are distinct from 2D cultures and more representative of in vivo tumors, including a heightened Warburg effect (aerobic glycolysis) and a greater ability to adapt to nutrient stress [13].
Key 3D Technologies and Methodologies
Various technologies have been developed to establish 3D cultures, each with unique advantages and applications. These can be broadly classified as scaffold-based or scaffold-free methods [19] [11].
Scaffold-Free Techniques
- Ultra-Low Attachment (ULA) Plates: These plates have a covalently bonded hydrogel coating that minimizes cell attachment, promoting cell-cell adhesion and driving self-assembly into a single spheroid per well. This method is highly reproducible and amenable to high-throughput screening (HTS) as spheroids are formed and assayed in the same plate [18] [11].
- Hanging Drop Plates (HDP): Cells are seeded in droplets of medium suspended from the top of a specialized plate. Gravity forces the cells to aggregate at the liquid-air interface to form spheroids. While excellent for spheroid uniformity, spheroids typically need to be transferred to another plate for assaying [18].
- Magnetic Levitation: Cells are incubated with magnetic nanoparticles and then levitated using a magnetic drive. This promotes rapid aggregation and spheroid formation, allowing for manipulation of the spheroid's position within the medium [3].
Scaffold-Based Techniques
- Hydrogels (e.g., Matrigel, Collagen): Cells are embedded in a 3D matrix of natural or synthetic polymers that mimic the native ECM. These hydrogels provide biochemical and mechanical support that influence cell differentiation, morphology, and signaling [18] [22]. For example, Neuron-D uses a synthetic, transparent hydrogel to grow 3D neural models for glioblastoma and Alzheimer's disease research [22].
- Organoid Cultures: A rapidly expanding technology, organoids are complex 3D structures derived from stem cells (pluripotent or adult) or patient-derived tumor cells. They self-organize and differentiate into organ-specific cell types, demonstrating realistic microanatomy and preserving the genetic and transcriptomic stability of the original tumor [19] [18]. Patient-derived tumor organoids (PDTOs) are particularly valuable for personalized therapy testing [3] [19].
- 3D Bioprinting: This technology uses automated, computer-guided deposition of "bioinks" (cell-laden hydrogels and materials) to create precise, custom 3D architectures. It allows for precise control over the distribution of cells, biomolecules, and matrix scaffolds within the TME [23].
Diagram: Experimental Workflow for 3D Spheroid Formation & Drug Testing
Diagram 2: A standard workflow for generating spheroids using ultra-low attachment plates and assessing drug response.
The Scientist's Toolkit: Essential Reagents and Materials
Table 3: Key Research Reagent Solutions for 3D Cell Culture
| Reagent/Material | Function | Example Application |
|---|---|---|
| Ultra-Low Attachment (ULA) Plates | Provides a non-adhesive surface to promote cell aggregation and spheroid formation. | High-throughput spheroid production for drug screening [18] [11]. |
| Basement Membrane Matrix (e.g., Matrigel) | A natural, reconstituted ECM hydrogel providing a complex protein substrate for cell growth and differentiation. | Embedding cells for organoid culture or invasive assays [19] [17]. |
| Synthetic Hydrogels (e.g., PEG) | Defined, reproducible polymers offering tunable mechanical and biochemical properties. | Creating reproducible microenvironments for mechanistic studies (e.g., Neuron-D's model) [22]. |
| Hanging Drop Plates | Facilitates spheroid formation through gravity-driven cell aggregation in suspended droplets. | Generating spheroids of highly uniform size and shape [18]. |
| Collagen I | A major ECM protein used to create hydrogel scaffolds that mimic stromal tissue. | Studying cell invasion and matrix remodeling in cancer research [13] [11]. |
The evidence is clear: the third dimension matters profoundly in cancer research. While 2D cultures remain useful for high-throughput initial screening and specific genetic manipulations due to their simplicity and low cost, they are insufficient for predicting complex in vivo responses [3]. The future of preclinical drug discovery is not a binary choice but a strategic, tiered workflow that leverages the strengths of both models: 2D for speed and scale, and 3D for realism and predictive power [3].
By adopting 3D models that faithfully recapitulate the TME and tissue architecture, researchers can gain deeper insights into tumor biology, improve the accuracy of drug efficacy and safety assessment, and ultimately reduce the high failure rates in clinical trials. This transition is essential for accelerating the development of more effective, personalized anticancer therapies.
The journey of cell culture began over a century ago with Ross Granville Harrison's pioneering hanging drop technique, which first allowed cells to be grown outside the body. This foundational work has evolved into sophisticated three-dimensional (3D) culture systems that dramatically outperform traditional two-dimensional (2D) monolayers in mimicking human physiology. This guide objectively compares the performance of 2D and 3D models, demonstrating through experimental data how modern 3D systems—including spheroids, organoids, and organ-on-a-chip technologies—provide superior predictivity in drug screening and disease modeling. By detailing key methodologies and presenting quantitative comparisons, we equip researchers with the evidence to select the most physiologically relevant models for preclinical research.
The limitations of traditional two-dimensional (2D) cell cultures—where cells grow as adherent monolayers on flat, rigid plastic surfaces—have become increasingly apparent in modern drug discovery and disease research [24] [25]. While 2D models have been the standard for decades due to their cost-effectiveness, simplicity, and compatibility with high-throughput screening [3], they fail to replicate the intricate tumor microenvironment (TME) and cellular interactions found in living tissues [25]. This failure has significant consequences: at least 75% of novel drugs that demonstrate efficacy during preclinical testing in 2D models fail in clinical trials due to insufficient efficacy or poor safety profiles [24].
The transition to three-dimensional (3D) cell culture represents a fundamental shift toward more physiologically relevant in-vitro models [26]. In 3D cultures, cells grow and interact in all three dimensions, more closely resembling the in-vivo architecture of human tissues [27]. These models recapitulate critical biological features such as cell-cell interactions, cell-extracellular matrix (ECM) interactions, and the formation of physiological gradients (oxygen, nutrients, pH) [24] [3]. This enhanced biological fidelity makes 3D models increasingly reliable tools for pharmacological studies, particularly in drug screening, pharmacokinetic analysis, and toxicological prediction [24] [3].
Table 1: Fundamental Differences Between 2D and 3D Cell Culture Systems
| Feature | 2D Cell Culture | 3D Cell Culture |
|---|---|---|
| Growth Pattern | Monolayer on flat surface | Multilayer, spatial organization |
| Cell Morphology | Flattened, stretched | In-vivo-like, often rounded |
| Cell-Cell Interactions | Limited, primarily peripheral | Extensive, in all directions |
| Cell-ECM Interactions | Restricted to single plane | 3D, biomimetic |
| Microenvironment | Uniform nutrient and gas access | Gradients of nutrients, oxygen, waste |
| Gene Expression | Often altered by substrate stiffness | More in-vivo-like profiles |
| Drug Response | Typically overestimated | More predictive of clinical efficacy |
Historical Milestones: From Hanging Drops to 3D Microenvironments
The foundation of 3D cell culture was laid in the early 20th century by Ross Granville Harrison, who conducted groundbreaking experiments published in his 1906 work "Observations on the Development of Living Nerve Fibers" [28]. Harrison developed the hanging drop technique, which involved culturing cells within plasma on the underside of glass slides, creating droplets where cells could gather and grow [28]. This method allowed him to successfully observe the in-vitro development of nerve fibers from a single cell or cluster over a defined period, marking the first successful attempt at maintaining living tissue outside the body.
Harrison's work was soon advanced by Alexis Carrel, a Nobel laureate known for his contributions to suturing techniques and cell culture [28]. Carrel developed the "Carrel Flasks," precursors to contemporary cell culture vessels, and emphasized strict aseptic methodologies. He cultivated tissue fragments on silk threads saturated with plasma, creating a surface where all cells had more uniform access to nutrients—an early conceptualization of a three-dimensional culture system [28]. Carrel's most notable achievement was the isolation and cultivation of one of the first immortalized cell lines derived from chicken embryonic hearts, which was maintained for decades through hundreds of passages [28].
The late 20th and early 21st centuries witnessed a renaissance in 3D culture technology, driven by an increased understanding of tumor biology and the limitations of 2D models. Key advancements included:
- 1970s: First use of multicellular tumor spheroids by Inch et al. to study cancers in 3D [25]
- 1990s: Steady development of 3D cell culture technology using human cell lines in artificial scaffolds [29]
- 2009: Development of intestinal organoids from stem cells by Sato et al. [25]
- 2010s-Present: Integration of microfluidics, 3D bioprinting, and organ-on-a-chip technologies to create increasingly complex models [26]
Quantitative Comparison: 2D vs. 3D Model Performance
Direct comparisons between 2D and 3D culture systems reveal significant differences in cellular behavior, drug response, and gene expression that underscore the superior predictivity of 3D models.
Proliferation and Metabolic Profiles
Recent tumor-on-chip studies quantitatively comparing 2D and 3D cultures through microfluidic platforms have uncovered critical differences in proliferation rates and metabolic patterns [13]. Research using U251-MG human glioblastoma and A549 human lung adenocarcinoma cell lines demonstrated that cell proliferation is more glucose-dependent in 2D culture than in 3D [13]. In glucose deprivation conditions, 2D-cultured cells stopped proliferating and displayed rapid cell death, while 3D-cultured cells survived longer and were able to activate alternative metabolic pathways, reflecting the adaptive mechanisms observed in in-vivo tumors [13].
Table 2: Experimental Comparison of 2D vs. 3D Cultures in Cancer Models
| Parameter | 2D Culture Findings | 3D Culture Findings |
|---|---|---|
| Proliferation Rate | High, exponential growth when glucose available | Reduced, limited by diffusion |
| Glucose Dependence | Absolute; proliferation ceases without glucose | Relative; alternative pathways activated |
| Lactate Production | Lower | Higher, indicating enhanced Warburg effect |
| Glutamine Consumption | Standard | Elevated under glucose restriction |
| Metabolically Active Cells | Uniformly high in optimal conditions | Heterogeneous, more active per cell |
| Response to Glucose Restriction | Rapid cell death | Sustained survival and adaptation |
Drug Response and Resistance
Studies consistently show that 3D models alter therapeutic responses. When comparing drugs for breast, prostate, and lung cancer, different dose-responsive curves were observed for agents like Docetaxel and Fulvestrant when cells were cultured in Matrigel versus other platforms [24]. Cancer cells in 3D cultures frequently exhibit reduced drug sensitivity compared to their 2D counterparts, more accurately modeling the drug resistance observed clinically in solid tumors [30] [25]. This resistance arises from multiple factors in 3D models, including limited drug penetration, the presence of quiescent cell populations in inner spheroid layers, and altered expression of drug resistance genes [13] [25].
Gene Expression and Signaling
Gene expression profiling reveals substantial differences between 2D and 3D cultures. Studies using prostate cancer cell lines showed significant differences in genes including ANXA1 (a potential tumor suppressor), CD44 (involved in cell-cell interactions), and stemness-related genes OCT4 and SOX2 [13]. In hepatocellular carcinoma models, genes involved in drug metabolism such as CYP2D6, CYP2E1, and SLC28A1 were upregulated in 3D cultures, while others like ALDH1B1 and SULT1E1 were downregulated [13]. These expression differences confirm that the culture dimensionality strongly influences cellular phenotype and function.
Experimental Protocols for Key 3D Models
Spheroid Formation via Hanging Drop Technique
The modern hanging drop technique, derived from Harrison's original method, is used for generating uniform multicellular spheroids [24] [3].
Methodology:
- Prepare a single-cell suspension in complete culture medium at a concentration of 1-5 × 10^5 cells/mL.
- Using a pipette, place small droplets (typically 10-50 μL) of the cell suspension onto the inner surface of a Petri dish lid.
- Carefully invert the lid and place it over the bottom chamber of the dish, which contains phosphate-buffered saline (PBS) to maintain humidity.
- Incubate the culture at 37°C with 5% CO₂ for 24-96 hours. Cells will settle at the bottom of the droplet and aggregate due to gravity.
- Collect the formed spheroids by carefully washing them from the droplets with fresh medium.
Advantages and Limitations:
- Strengths: Produces uniform, size-controlled spheroids; low cost; minimal equipment requirements.
- Pitfalls: Limited culture volume complicates medium changes and drug introduction; not ideal for high-throughput applications [24].
Hydrogel-Based 3D Culture for Drug Screening
Hydrogels provide an ECM-like environment that supports 3D cell growth and more physiologically relevant drug responses [24].
Methodology (using Collagen I Matrix):
- Keep collagen I solution, 10× PBS, and neutralizing solution on ice.
- Prepare the cell suspension and keep it on ice.
- Mix the components in the following order on ice: 10× PBS (1/10th of final volume), cell suspension, collagen I solution (final concentration 1-2 mg/mL).
- Quickly neutralize the solution according to manufacturer's instructions.
- Immediately pipette the cell-collagen mixture into pre-chilled multi-well plates (50-100 μL per well of a 96-well plate).
- Incubate at 37°C for 30-60 minutes to allow polymerization.
- Gently add culture medium on top of the polymerized hydrogel.
- Culture for the desired period, refreshing medium every 2-3 days.
Drug Treatment Protocol:
- After spheroid formation (typically 3-5 days), add compounds directly to the culture medium.
- For concentration-response studies, use serial dilutions of the test compound.
- Incubate for the desired treatment period (typically 72-96 hours).
- Assess viability using 3D-optimized assays such as:
Microfluidic Tumor-on-Chip Model for Metabolic Studies
Microfluidic platforms enable real-time monitoring of metabolic changes in 3D cultures [13].
Methodology:
- Seed individual cells inside a collagen-based hydrogel that mimics ECM.
- Load the cell-hydrogel mixture into the microfluidic chip.
- Allow cells to proliferate and self-organize along the hydrogel microarchitecture (5-10 days).
- Connect the chip to a perfusion system for continuous nutrient supply and waste removal.
- Monitor metabolic changes in real-time through integrated sensors or daily sampling of effluent.
- Measure key metabolites (glucose, glutamine, lactate) using standardized assays.
- Image spheroid formation and growth directly within the microfluidic device.
The Scientist's Toolkit: Essential Research Reagents and Materials
Successful implementation of 3D culture models requires specific reagents and materials that differ from traditional 2D culture.
Table 3: Essential Research Reagents for 3D Cell Culture
| Reagent/Material | Type | Function in 3D Culture | Example Applications |
|---|---|---|---|
| Basement Membrane Matrix (e.g., Matrigel) | Natural Hydrogel | Provides ECM-like environment with natural cytokines and growth factors | Organoid culture, tumor stroma modeling |
| Collagen I | Natural Hydrogel | Most abundant ECM protein; tunable mechanical properties | Stromal modeling, general 3D culture |
| Alginate | Natural Hydrogel | Biocompatible polymer; ionically crosslinked | Encapsulation, tissue engineering |
| Fibrin | Natural Hydrogel | Polymer from blood clotting; promotes angiogenesis | Wound healing models, vascularized tissues |
| Synthetic PEG-based Hydrogels | Synthetic Hydrogel | Defined chemistry; tunable mechanical properties | Mechanobiology studies |
| Ultra-Low Attachment (ULA) Plates | Scaffold-Free | Prevents cell adhesion; promotes spheroid formation | Tumor spheroids, neurospheres |
| Hanging Drop Plates | Scaffold-Free | Uses gravity for controlled spheroid formation | Uniform spheroid production |
| Microfluidic Chips | Platform | Creates dynamic microenvironment with perfusion | Tumor-on-chip, metabolic studies |
The evolution from Harrison's hanging drop to modern 3D systems represents a paradigm shift in how researchers model human biology and disease. The experimental evidence clearly demonstrates that 3D models provide superior physiological relevance and predictive power compared to traditional 2D cultures, particularly in drug screening applications where clinical translation is the ultimate goal [24] [30] [13].
Future developments in 3D cell culture are focusing on increasing model complexity through the integration of multiple cell types, vascularization, and immune components [30]. The combination of 3D models with artificial intelligence-driven analysis and high-content imaging is poised to further enhance their predictive capabilities and throughput [26] [30]. Additionally, organ-on-a-chip technologies that fluidically link multiple organ models represent the cutting edge in mimicking systemic human physiology for drug development and disease modeling [30].
For researchers, the choice between 2D and 3D models should be strategic rather than binary. While 2D cultures remain valuable for high-throughput screening of large compound libraries and basic mechanistic studies, 3D models are essential when tissue architecture, drug penetration, and microenvironmental influences are critical to the research question [3] [30]. As the field moves forward, the integration of these complementary approaches, along with advancing technologies in biofabrication and computational biology, will continue to transform our ability to model human disease and develop effective therapies.
Building Better Models: Techniques and Real-World Applications
The transition from two-dimensional (2D) to three-dimensional (3D) cell culture represents a paradigm shift in biomedical research, drug discovery, and tissue engineering. While traditional 2D cultures, where cells grow as a single layer on flat plastic surfaces, have been the standard for decades, they lack the physiological relevance of native tissues. Cells cultured in 2D undergo altered morphology, lose polarity, and experience unlimited access to nutrients and oxygen—conditions that poorly mimic the complex in vivo microenvironment [31] [3]. This discrepancy often leads to misleading data, with promising drug candidates failing in clinical trials after showing efficacy in 2D models [3].
Scaffold-based techniques form the cornerstone of advanced 3D cell culture systems. These scaffolds provide a biomimetic structural framework that closely resembles the native extracellular matrix (ECM), facilitating cell-cell and cell-matrix interactions critical for proper cellular differentiation, proliferation, and function [32] [33]. Within this context, hydrogels, synthetic polymers, and natural matrices have emerged as leading scaffold materials, each offering distinct advantages for creating physiologically relevant 3D tissue models that better predict human responses to drugs, toxins, and disease processes [32] [34].
Comparative Analysis of Scaffold Types
Scaffolds for 3D cell culture are primarily categorized based on their material origin and composition. The optimal choice depends on the specific application, required mechanical properties, and desired biological functionality.
Hydrogel Scaffolds
Hydrogels are three-dimensional networks of hydrophilic polymers that can absorb vast quantities of water or biological fluids without dissolving. Their high water content and rubbery consistency in the swollen state make them exceptionally similar to natural living tissues [32].
- Classification and Properties: Hydrogels can be classified by origin (natural, synthetic, semi-synthetic), durability (durable, biodegradable), and responsiveness to environmental stimuli ("smart hydrogels") [32]. Key properties include excellent biocompatibility, tunable mechanical strength, and permeability to oxygen, nutrients, and metabolic waste [32] [34].
- Fabrication Techniques: Common preparation methods include free radical polymerization, irradiation crosslinking, and chemical crosslinking of polymeric precursors [32]. Crosslinking can be physical (through molecular entanglements or secondary forces), chemical (via covalent bonds), or double crosslinked for enhanced mechanical properties [34].
- Applications in Tissue Engineering: Hydrogels serve as ideal scaffolds for bone repair, wound healing, and drug delivery systems. Their ECM-mimetic properties provide essential support for cell viability and function, creating conducive conditions for tissue regeneration while minimizing foreign body responses [34].
Natural Polymer Scaffolds
Natural polymers are derived from biological sources and offer innate biocompatibility and bioactivity.
- Polysaccharides: This category includes chitosan (from shellfish exoskeletons), alginate (from seaweed), hyaluronic acid, and agarose. They are characterized by high biocompatibility, biodegradability, and low immunogenicity [32] [33] [35].
- Proteins: Collagen (and its derivative gelatin), fibrin, and Matrigel are common protein-based natural scaffolds. They typically contain biological signaling motifs (e.g., RGD sequences) that promote excellent cell adhesion and proliferation [31] [7].
- Considerations: While offering superior biological recognition, natural polymers often have batch-to-batch variability and lower mechanical strength compared to synthetic alternatives. Some, like Matrigel, may contain undefined components or growth factors that can influence experimental outcomes [7] [36].
Synthetic Polymer Scaffolds
Synthetic polymers are human-made materials with highly tunable chemical and physical properties.
- Common Synthetic Polymers: This category includes poly(lactic acid) (PLA), poly(glycolic acid) (PGA), their copolymer poly(lactic-co-glycolic acid) (PLGA), poly(ε-caprolactone) (PCL), poly(ethylene glycol) (PEG), and polyvinyl alcohol (PVA) [33].
- Advantages: Synthetic polymers offer precise control over mechanical properties, degradation rates, and architecture. They exhibit consistent quality and can be manufactured without biological contaminants [33].
- Limitations: They generally lack inherent bioactivity and may require surface modification to enhance cell adhesion. Degradation byproducts of some synthetic polymers can cause local acidity, potentially leading to inflammatory responses [33].
Table 1: Comparative Properties of Scaffold Materials for 3D Cell Culture
| Property | Natural Hydrogels/Polymers | Synthetic Polymers | Hybrid/Composite Scaffolds |
|---|---|---|---|
| Biocompatibility | Typically excellent | Variable; can be tailored | Enhanced |
| Biodegradability | Enzymatic degradation; predictable | Hydrolytic degradation; tunable rates | Controllable degradation profile |
| Mechanical Strength | Generally weak | Tunable from soft to rigid | Enhanced and tunable properties |
| Structural Control | Low | High precision in fabrication | High precision with bioactivity |
| Bioactivity | Inherent bioactivity and cell adhesion | Often requires functionalization | Combines inherent and engineered bioactivity |
| Batch-to-Batch Variation | High (especially natural polymers) | Low | Can be standardized |
| Cost | Variable; some are expensive | Generally cost-effective | Typically higher due to complexity |
| Key Examples | Chitosan, collagen, hyaluronic acid, Matrigel | PLA, PGA, PLGA, PCL, PEG | Chitosan-gelatin-HA with Fe₃O₄ [35], collagen-alginate composites |
Experimental Data and Performance Comparison
Recent studies provide quantitative data on the performance of different scaffold-based 3D culture systems across various applications.
Scaffold-Dependent Variability in Cancer Models
A 2025 study on prostate cancer cell lines highlights how scaffold choice significantly influences experimental outcomes. Researchers cultured four prostate cancer cell lines (LNCaP, LASCPC-01, PC-3, and KUCaP13) in different scaffolding materials—Matrigel, GelTrex, and plant-based GrowDex—using the sandwich method [36].
- Spheroid Formation: Matrigel promoted the most consistent spheroid formation across cell lines. However, performance was cell-line dependent; LASCPC-01 showed generally more limited spheroid formation than LNCaP across all scaffolds [36].
- Gene Expression Effects: Androgen receptor (AR) expression in LNCaP cells was reduced across all scaffolds using the sandwich method. However, expression of AR signaling genes and neuroendocrine marker genes varied significantly depending on both the scaffolds and culture methods (sandwich vs. mini-dome), underscoring the method-dependent variability in 3D culture outcomes [36].
Methodology Comparison in Colorectal Cancer Spheroids
A comprehensive 2025 study systematically evaluated different 3D culture methodologies for generating multicellular tumour spheroids (MCTS) across eight colorectal cancer (CRC) cell lines (DLD1, HCT8, HCT116, LoVo, LS174T, SW48, SW480, and SW620) [7].
- Tested Methods: The study compared overlay on agarose, hanging drop, and U-bottom plates without matrix or with methylcellulose, Matrigel, or collagen type I hydrogels [7].
- Morphology and Viability: Spheroid morphology and cell viability were significantly influenced by the culture technique. The study successfully developed a novel compact spheroid model for SW48 cells, which previously formed only irregular aggregates in 3D culture [7].
- Cost-Effective Alternative: The research demonstrated that treatment of regular multi-well plates with anti-adherence solution could generate CRC spheroids at significantly lower cost than using specialized cell-repellent multi-well plates, addressing a major barrier to 3D culture adoption [7].
Table 2: Experimental Performance of 3D Scaffold Methodologies in Cancer Research
| Methodology | Spheroid Formation Consistency | Cell Viability Maintenance | Technical Complexity | Cost Considerations | Key Applications |
|---|---|---|---|---|---|
| Hanging Drop | Variable size; may merge over time [7] | High | Medium | Low | Primary screening, developmental biology |
| Liquid Overlay (Agarose) | Multiple spheroids of varying sizes [7] | High | Low | Low | High-throughput screening |
| U-bottom Plates | Highly homogeneous single spheroids [7] | High | Low | Medium (plates can be expensive) | Standardized drug screening |
| Matrigel | Most consistent across cell lines [36] | High | Medium | High | Organoid culture, stem cell studies |
| Collagen-Based | Cell line-dependent [7] | High | Medium | Medium | Tissue engineering, migration studies |
| Synthetic Polymers | Tunable based on polymer properties | High | Variable | Low to Medium | Mechanobiology studies, bone TE |
Detailed Experimental Protocols
To ensure reproducibility and standardization across studies, here are detailed methodologies for key scaffold-based 3D culture techniques.
Magnetic Hydrogel Scaffold Preparation
A 2024 study developed a magnetic hydrogel scaffold based on chitosan, gelatin, and hyaluronic acid for potential tissue engineering applications [35].
Synthesis of Fe₃O₄ Magnetic Nanoparticles (IONPs):
- Prepare an aqueous solution of FeCl₃·6H₂O (1.1 g, 0.0037 mol) and FeCl₂·4H₂O (0.4 g, 0.002 mol) in 100 mL deionized water (molar ratio 2Fe(III):1Fe(II)).
- Maintain at 60°C for 15 minutes with vigorous stirring.
- Under continuous stirring and N₂ gas, add 20 mL of NaOH (25%) until pH reaches ~11, indicated by black suspension formation.
- Stir suspension at 50°C for 2 hours.
- Separate IONPs using external magnet, wash with deionized water, and dry in vacuum oven overnight [35].
Fabrication of Magnetic Hydrogel Scaffold:
- Prepare solutions of chitosan (1% w/w in 1% acetic acid), gelatin (10% w/w in water), and hyaluronic acid (1% w/w in 0.1M HCl).
- Mix solutions in desired volume ratios with continuous stirring for 1 hour.
- Add glutaraldehyde (50%) as crosslinking agent at varying concentrations (0.2-0.8 mL) with stirring.
- Wash resulting hydrogels with distilled water to remove unreacted materials.
- Freeze-dry hydrogel samples and store in desiccator until use [35].
Key Characterization Analyses:
- SEM Imaging: Revealed three-dimensional porous microstructures.
- Mechanical Testing: Breaking load increased from 1.361 Kgf to 4.98 Kgf with higher glutaraldehyde concentration.
- Swelling Degree: Values ranged from 250% to 2000% after 24 hours in water.
- Antibacterial Activity: Ranged from 54% to 97% for S. aureus and 26% to 92% for E. coli.
- Drug Release: Ciprofloxacin-loaded hydrogels showed sustained release over 10 hours, accelerated by IONPs [35].
Multicellular Tumour Spheroid (MCTS) Generation
The 2025 CRC study provided optimized protocols for consistent MCTS formation [7].
U-bottom Plate Method with Cost-Effective Modification:
- Treat standard multi-well plates with anti-adherence solution instead of using expensive cell-repellent plates.
- Prepare single-cell suspension in appropriate growth medium.
- Seed cells into U-bottom wells at optimized density (varies by cell line).
- Centrifuge plates at low speed (300-500 × g) for 5-10 minutes to encourage cell aggregation.
- Culture at 37°C with 5% CO₂, monitoring spheroid formation daily.
- Compact spheroids typically form within 3-7 days, depending on cell line [7].
Co-culture with Fibroblasts for Enhanced Physiological Relevance:
- Include immortalized colonic fibroblasts (e.g., CCD-18Co) in cell suspension.
- Use ratio of cancer cells to fibroblasts appropriate for modeling tumour-stroma interactions (typically between 1:1 and 10:1).
- Co-cultures provide additional insights into tumour microenvironment interactions in a 3D setting [7].
The Scientist's Toolkit: Essential Research Reagents
Table 3: Key Research Reagents for Scaffold-Based 3D Cell Culture
| Reagent/Material | Function/Application | Examples/Notes |
|---|---|---|
| Matrigel | Basement membrane matrix for organoid culture and stem cell studies | Promotes consistent spheroid formation; contains endogenous growth factors [7] [36] |
| Type I Collagen | Natural ECM hydrogel for tissue engineering and migration studies | Cell line-dependent spheroid formation [7] |
| Agarose | Non-adherent surface for liquid overlay spheroid formation | Used for overlay method; inert and cost-effective [7] |
| Hyaluronic Acid | Natural polysaccharide for biomimetic hydrogels | Biocompatible; native ligand for CD44 receptor [35] |
| Chitosan | Natural polymer from crustacean shells for scaffold fabrication | Biodegradable, antibacterial properties [35] |
| Gelatin | Denatured collagen for tissue engineering scaffolds | Non-toxic, biodegradable, cost-effective [35] |
| Poly(ethylene glycol) | Synthetic polymer for tunable hydrogel scaffolds | Metabolically neutral; highly customizable [7] |
| Methylcellulose | Synthetic polymer for viscosity modification in 3D cultures | Used in hydrogel formulations for spheroid culture [7] |
| Glutaraldehyde | Crosslinking agent for enhancing scaffold mechanical strength | Increases breaking load of hydrogels [35] |
| Fe₃O₄ Nanoparticles | Magnetic component for guided tissue organization and drug delivery | Enables directional growth of cells; enhances drug release [35] |
Signaling Pathways and Cellular Responses in 3D Microenvironments
The 3D cellular microenvironment activates distinct signaling pathways compared to 2D culture, influencing critical cellular processes including proliferation, differentiation, and drug response.
Diagram 1: Signaling pathways and cellular responses activated in 3D scaffold microenvironments. The complex interplay of mechanical, biochemical, and physical cues in 3D cultures leads to more physiologically relevant cellular behavior and clinically predictive drug responses compared to traditional 2D systems.
Scaffold-based techniques using hydrogels, natural polymers, and synthetic matrices have fundamentally advanced 3D cell culture methodologies. The experimental data clearly demonstrate that the choice of scaffold material significantly influences cellular behavior, gene expression, and drug responses—highlighting the critical importance of selecting appropriate scaffolds for specific research applications [7] [36].
The future of scaffold-based 3D culture lies in the development of advanced composite materials that combine the advantageous properties of natural and synthetic polymers [33] [37]. The integration of smart elements—such as magnetic nanoparticles for guided tissue organization [35]—and the creation of vascularized scaffolds that support nutrient diffusion to inner layers represent the next frontier in tissue engineering. Furthermore, standardizing protocols and reducing costs through innovations like anti-adherence treated plates [7] will be essential for widespread adoption of these physiologically relevant models.
As the field evolves, the combination of scaffold-based 3D models with emerging technologies like organ-on-a-chip systems and artificial intelligence for data analysis promises to further enhance the predictive power of preclinical research, potentially reducing drug development costs and failure rates while diminishing reliance on animal models [3].
The transition from two-dimensional (2D) to three-dimensional (3D) cell culture represents a paradigm shift in biomedical research, offering models that more accurately mimic the intricate architecture and functionality of in vivo tissues [31] [38]. Within this landscape, scaffold-free 3D culture systems have emerged as powerful tools that enable cells to self-assemble into complex structures without the support of exogenous biomaterials [39]. These systems, primarily encompassing spheroids and organoids, preserve crucial intercellular interactions and extracellular matrix (ECM) support, closely mimicking natural biological niches [39]. The growing adoption of these methods is largely driven by the limitations of traditional 2D monolayers, where cells adhere to flat, rigid surfaces, resulting in altered morphology, disrupted polarity, and limited cell-cell interactions that poorly represent native tissue environments [31] [3].
This guide provides a comprehensive comparison of scaffold-free 3D culture techniques, focusing on their applications, methodologies, and performance relative to scaffold-based and traditional 2D alternatives. By objectively examining experimental data and detailed protocols, we aim to equip researchers, scientists, and drug development professionals with the necessary knowledge to select and implement appropriate scaffold-free models within their 3D vs. 2D research frameworks, ultimately enhancing the predictive accuracy and physiological relevance of their studies.
Understanding Scaffold-Free 3D Culture Systems
Defining Core Concepts: Spheroids vs. Organoids
Scaffold-free 3D culture systems are characterized by their ability to form three-dimensional cellular structures without relying on external scaffolding materials like Matrigel or collagen [39]. Instead, they leverage innate cell-cell adhesion properties to self-assemble into complex aggregates.
Spheroids are simple, spherical clusters of cells that form through the aggregation of one or more cell types [40] [41]. They typically lack the organizational complexity of original tissues but effectively model basic cellular interactions, nutrient gradients, and drug penetration barriers found in vivo [40]. Spheroids are widely used in cancer research, drug screening, and basic studies of cellular processes.
Organoids represent more advanced, complex structures that demonstrate self-differentiation and exhibit properties and functions similar to specific human organs [40]. Derived from embryonic stem cells (ESCs), induced pluripotent stem cells (iPSCs), or adult stem cells, organoids develop through largely self-organized processes and recapitulate key aspects of organ architecture and functionality [40] [41]. Their enhanced physiological relevance makes them ideal for disease modeling, personalized medicine, and developmental biology studies.
The Formation Process of 3D Structures
The formation of scaffold-free 3D structures typically occurs through a coordinated, multi-stage process [40]:
- Aggregation: Dispersed cells come together to form loose aggregates, facilitated by transmembrane receptors (integrins) that mediate cell-cell and cell-ECM adhesion.
- Compaction: The initially loose aggregates become more densely packed, assuming a rounded, spherical morphology through enhanced cell-cell interactions.
- Growth: The compacted spheroids continue to grow, developing internal organizational complexity, including gradients in oxygen and nutrient availability that lead to distinct cellular zones—proliferating cells at the periphery, quiescent cells in intermediate layers, and often apoptotic or necrotic cells in the core due to limited diffusion [40].
Table 1: Comparative Analysis of 3D Culture Model Types
| Feature | Spheroids | Organoids | Scaffold-Based 3D Cultures |
|---|---|---|---|
| Structural Complexity | Low to moderate; spherical aggregates [40] | High; mimics microanatomy of specific organs [40] | Variable; depends on scaffold material and structure [31] |
| Cellular Source | Cell lines (cancerous or primary), multiple cell types for co-culture [40] | Pluripotent stem cells (ESCs, iPSCs) or adult stem cells [40] [41] | Wide range, including primary cells and cell lines [31] |
| Self-Organization | Limited; primarily aggregation [40] | High; self-differentiation and patterning [40] | Guided by scaffold architecture [31] |
| Key Applications | Drug screening, tumor biology, basic cell processes [40] | Disease modeling, personalized medicine, developmental biology [40] | Tissue engineering, disease modeling, studying cell-matrix interactions [31] |
| Throughput | High (amenable to 96-well formats) [42] | Low to moderate [40] | Moderate [31] |
| Technical Ease | Relatively simple [40] [42] | Complex; requires specific cytokine/growth factor cocktails [40] | Moderate; requires optimization of scaffold properties [31] |
Figure 1: The multi-stage process of scaffold-free spheroid formation, from initial cell aggregation to the development of a mature 3D structure with internal complexity [40].
Key Scaffold-Free Technologies and Methodologies
Hanging Drop Method
The hanging drop technique is a traditional, yet effective, scaffold-free approach for generating uniform 3D spheroids [42] [1]. This method utilizes gravity to promote cell aggregation at the bottom of small droplets of cell suspension.
- Protocol: A droplet (typically 10-20 µL) of cell suspension is pipetted onto the underside of a culture dish lid. The lid is then carefully inverted and placed over a dish containing phosphate-buffered saline (PBS) to maintain humidity. Gravity causes the cells to settle and aggregate at the liquid-air interface of the droplet, forming a single spheroid per drop within 24-72 hours [42].
- Advantages: The hanging drop method is simple, cost-effective, and allows for precise control over the initial cell number, leading to highly uniform spheroid size [40] [42]. It is excellent for studies requiring consistency and is scaffold-free by design.
- Disadvantages: The technique can be cumbersome for high-throughput applications due to the need for manual droplet manipulation. Media exchange can be challenging, and there are limitations for long-term culture and high-resolution microscopy [40] [42].
Ultra-Low Attachment (ULA) Plates
Ultra-low attachment (ULA) plates are specially designed cultureware whose surfaces have been treated with a hydrophilic, neutrally charged polymer or hydrogel that effectively repels cell attachment [31] [42].
- Protocol: A cell suspension is simply added to the ULA wells (e.g., 200 µL per well of a 96-well plate). The repellent surface prevents cells from adhering, encouraging them to instead adhere to each other and form spheroids [42]. Plates are typically left undisturbed on a level surface for the first 24-48 hours to facilitate aggregation.
- Advantages: This method is exceptionally easy to use and amenable to automation and high-throughput screening. It allows for the culture of a wide range of cell types and facilitates more natural cell-cell interactions [42].
- Disadvantages: Not all cell types form spheroids equally well on these surfaces, and the homogeneity of spheroid formation can vary based on the inherent cell-cell adhesion properties [42]. The lack of attachment can also make certain analyses more challenging.
Magnetic Levitation and 3D Bioprinting
Emerging scaffold-free technologies include magnetic levitation and magnetic 3D bioprinting [1]. These methods typically involve incubating cells with magnetic nanoparticles. Subsequently, a magnetic field is applied to levitate the cells and bring them into close proximity, promoting aggregation into 3D structures [1]. While these technologies offer precise spatial control and are gaining attention, they are less established than hanging drop or ULA plate methods.
Table 2: Comparison of Scaffold-Free 3D Culture Techniques
| Method | Principle | Uniformity | Throughput | Ease of Use | Cost | Key Applications |
|---|---|---|---|---|---|---|
| Hanging Drop [40] [42] | Gravity-induced aggregation in droplets | High | Low | Moderate | Low | Basic research, protocol development, studies requiring high uniformity |
| ULA Plates [31] [42] | Cell aggregation on non-adherent surfaces | Moderate to High | High | Very Easy | Moderate to High | High-throughput drug screening, large-scale spheroid production |
| Magnetic Levitation [1] | Magnetic force-guided assembly | Moderate | Moderate | Moderate (requires nanoparticles) | High | Engineering complex tissue structures, specialized applications |
| Agitation-Based Methods [38] | Continuous motion prevents adhesion | Low | Moderate | Easy | Low | Bulk spheroid production for non-size-critical assays |
Performance Comparison: Scaffold-Free vs. Other Models
Biological Fidelity and Cellular Phenotypes
Scaffold-free 3D cultures demonstrate distinct and often more physiologically relevant cellular phenotypes compared to their 2D counterparts.
- Cell Morphology and Polarity: Cells in 3D scaffold-free systems maintain a more natural rounded shape, in contrast to the flat, stretched morphology seen in 2D monolayers [38]. They also retain proper polarity, which is frequently lost in 2D cultures [31].
- Proliferation and Viability: Proliferation rates in 3D cultures are typically reduced compared to 2D, which more closely mimics the growth dynamics of in vivo tissues [38]. Furthermore, viability is often enhanced in 3D formats like spheroids and cell sheets compared to 2D cultures over time [39].
- Gene and Protein Expression: Cells in scaffold-free 3D cultures exhibit gene expression, mRNA splicing, and protein expression profiles that more closely resemble in vivo conditions [31] [38]. For instance, mesenchymal stem cell (MSC) spheroids show enhanced expression of stemness markers (Sox-2, Oct-4, Nanog) and increased secretion of trophic factors (VEGF, HGF, FGF2) compared to 2D-cultured MSCs [39].
- Extracellular Matrix (ECM): Scaffold-free 3D cultures actively deposit their own ECM proteins, such as fibronectin, tenascin C, and collagen, creating a more authentic and native microenvironment [39].
Table 3: Phenotypic Differences of Cells in 2D vs. Scaffold-Free 3D Culture Systems Data derived from studies on Mesenchymal Stem Cells (MSCs) and various cancer cell lines [38] [39].
| Parameter | 2D Cell Culture | 3D Scaffold-Free Spheroid Culture |
|---|---|---|
| Cell Morphology | Mostly spindle-shaped, flattened [39] | Rounded, more natural shape [39] |
| ECM Deposition | Limited [39] | Enriched, self-produced ECM [39] |
| Cell-Cell Interaction | Limited [39] | Enhanced [39] |
| Cell Viability | Decreases over time [39] | Enhanced viability [39] |
| Proliferation Rate | High, replicative senescence occurs [38] [39] | Reduced, more in vivo-like [38] [39] |
| Differentiation Potential | Compromised [39] | Preserved or enhanced [39] |
| Cytokine/Growth Factor Expression | Reduced compared to 3D [39] | Increased secretion of pro-angiogenic, immunomodulatory factors [39] |
| Drug Response | Often overestimates efficacy [3] | More predictive, shows higher resistance [43] [44] |
Predictive Power in Drug Discovery and Disease Modeling
A critical advantage of scaffold-free 3D models is their superior performance in preclinical drug testing and disease modeling.
- Drug Response and Resistance: A study on dedifferentiated liposarcoma cell lines (Lipo246 and Lipo863) demonstrated that 3D collagen models showed higher cell viability after treatment with the MDM2 inhibitor SAR405838 compared to 2D models, indicating a more resistant phenotype often observed in vivo [44]. This aligns with the general finding that 3D cultures more accurately predict chemoresistance, partly due to the presence of diffusion barriers and heterogeneous microenvironments [43].
- Tumor Microenvironment Modeling: Multicellular tumor spheroids (MCTS) develop physiological gradients of oxygen, nutrients, and pH [40] [3]. This architecture creates regional heterogeneity, with proliferating cells on the outside, quiescent cells in the middle, and a necrotic core in the center—closely mimicking the pathophysiological situation of solid tumors in patients [40]. This makes them invaluable for studying drug penetration and efficacy.
- Personalized Medicine: Patient-derived organoids, which are often generated using scaffold-free or scaffold-based principles, are used to match therapies to individual patients with drug-resistant cancers, showcasing their direct clinical relevance [3].
Figure 2: A comparison of drug testing workflows in 2D versus 3D scaffold-free models. The 3D spheroid model, with its physiological gradients and cell-cell interactions, provides a more accurate prediction of drug response and clinical efficacy [43] [3] [44].
The Scientist's Toolkit: Essential Reagents and Materials
Successful implementation of scaffold-free 3D cultures requires specific reagents and materials. The following table details key solutions for setting up these systems.
Table 4: Essential Research Reagent Solutions for Scaffold-Free 3D Culture
| Product Category/Name | Function/Description | Example Vendor(s) |
|---|---|---|
| Ultra-Low Attachment (ULA) Plates [42] | Cultureware with covalently bound hydrogel or polymer surfaces that prevent cell attachment, forcing cell-cell aggregation. Available in various formats (96-well, 384-well). | Corning (Elplasia), MilliporeSigma (Millicell Microwell) |
| Hanging Drop Plates | Specialized plates with structured wells designed to facilitate the hanging drop technique without the need for manual lid inversion, improving throughput. | - |
| Micro-patterning Plates [42] | Plates (e.g., µ-Patterning slides) with defined adhesive patterns printed on a non-adhesive background, guiding spheroid formation to a specific size and location. | ibidi (µ-Slide) |
| Cell-Repellent Surface Coatings | Solutions that can be applied to standard cultureware to create a non-adhesive surface, offering a flexible way to convert existing plates for spheroid formation. | - |
| Tissue Clearing Reagents [41] | Reagents (e.g., Corning 3D Clear, Visikol HISTO-M) that render 3D spheroids and organoids transparent for improved imaging and analysis by light-sheet or confocal microscopy. | Corning, MilliporeSigma |
| 3dGRO Cancer Organoid Biobanks [41] | Ready-to-use, characterized patient-derived cancer organoid lines, conserving original genetic and phenotypic traits for predictive drug response studies. | MilliporeSigma |
Scaffold-free 3D cell culture methods, including spheroids and organoids, have firmly established their value by providing more physiologically relevant in vitro models that bridge the gap between traditional 2D monolayers and in vivo animal studies. As demonstrated, these systems excel in preserving native cell morphology, enhancing cell-cell interactions, generating predictive drug response data, and modeling complex disease microenvironments.
The choice of a specific scaffold-free technique—be it the simplicity and uniformity of the hanging drop, the high-throughput capability of ULA plates, or the emerging potential of magnetic assembly—should be guided by the specific research question, required throughput, and available resources. While 2D cultures remain useful for large-scale initial screening due to their cost-effectiveness and simplicity, scaffold-free 3D models are indispensable for validation stages where physiological accuracy is paramount. The continued evolution and integration of these technologies, particularly with advances in automation, imaging, and data analysis, promise to further enhance their role in driving successful drug discovery and deepening our understanding of fundamental biology.
The landscape of biomedical research is undergoing a profound transformation, moving away from traditional two-dimensional (2D) cell cultures toward sophisticated three-dimensional (3D) models that more accurately replicate human physiology. This shift is driven by the recognition that traditional 2D cell cultures fail to capture the complex cellular interactions, tissue architecture, and microenvironmental cues found in living organisms [13]. While 2D models have served as fundamental tools for decades, their limitations have become increasingly apparent, particularly in drug discovery, where approximately 90% of compounds that show promise in 2D cultures fail during clinical trials [13].
Advanced systems such as organs-on-chips (OoC) and 3D bioprinting represent a technological revolution that bridges the gap between conventional in vitro models and in vivo human physiology. These systems incorporate critical elements of the native cellular environment, including cell-cell interactions, cell-matrix interactions, and physiologically relevant diffusion dynamics [13]. The integration of microfluidic technologies further enhances these models by enabling precise control over the cellular microenvironment, dynamic nutrient perfusion, and the application of mechanical stimuli [45]. This comprehensive review examines these advanced systems, comparing their capabilities, applications, and performance relative to traditional approaches, with a focus on their transformative potential for biomedical research and drug development.
Organ-on-Chip (OoC) Systems
Organ-on-chip technology utilizes microfluidic devices to create microenvironments that mimic the structure and function of human organs. These systems typically feature microfluidic channels lined with living cells arranged to simulate tissue-tissue interfaces and organ-level functions [45]. The chips are often fabricated from optically transparent materials such as polydimethylsiloxane (PDMS), allowing for real-time observation of cellular behavior [46].
Key Characteristics: OoC platforms are defined by three fundamental characteristics: (1) the ability to create controlled microenvironments; (2) the integration of multiple cell types in physiologically relevant arrangements; and (3) the application of biochemical and mechanical stimuli to mimic in vivo conditions [45]. These systems leverage microfluidic channels to enable efficient nutrient transport, waste removal, and the establishment of biochemical gradients that guide cellular behavior [45].
Applications: OoC technology has been successfully implemented to model various organs, including:
- Lung-on-chip: Developed to mimic the alveolar-capillary interface, incorporating epithelial cells, endothelial cells, and immune cells to study respiratory diseases such as asthma, COPD, and pulmonary fibrosis [45].
- Liver-on-chip: Comprising hepatocytes, Kupffer cells, stellate cells, and endothelial cells to recapitulate hepatic functions for studying drug metabolism, hepatotoxicity, and liver diseases [45].
- Heart-on-chip: Featuring cardiomyocytes, fibroblasts, and endothelial cells to replicate myocardial tissue architecture for assessing cardiac function, drug cardiotoxicity, and cardiac therapies [45].
- Brain-on-chip: Incorporating neurons, astrocytes, microglia, and endothelial cells to mimic the neural network and blood-brain barrier for studying neurodegenerative diseases [45].
3D Bioprinting Technologies
3D bioprinting employs additive manufacturing techniques to create structured, biologically relevant tissue constructs through the layer-by-layer deposition of bioinks containing cells and biomaterials [47]. This approach allows for precise control over the spatial arrangement of cells, potentially enabling the recreation of native tissue architecture.
Bioprinting Techniques:
- Extrusion-based bioprinting: Utilizes pneumatic or mechanical dispensing systems to continuously deposit bioinks through a nozzle, enabling the creation of large, complex structures with resolutions typically ranging from 100 to 500 μm [47].
- Inkjet bioprinting: Employs thermal or piezoelectric actuators to eject droplets of bioink, offering higher printing speeds and excellent cell viability, though limited to lower viscosity bioinks [47].
- Laser-assisted bioprinting: Uses laser energy to transfer bioink from a donor slide to a substrate, achieving high resolution (often below 10 μm) and cell viability exceeding 95%, though at higher cost and complexity [47].
- Stereolithography (SLA): Relies on light-based crosslinking of photopolymerizable bioinks to create structures with high resolution (down to 10 μm) and smooth surface finishes [47].
Bioink Development: Advancements in bioink formulations have been crucial for improving the fidelity and functionality of bioprinted tissues. Innovative bioinks include printable polymer-based hydrogels and decellularized matrix bioinks that better replicate the native extracellular matrix [47]. A significant challenge in light-based bioprinting is the scattering of light caused by differences in refractive index between cells and bioink, which can reduce resolution. This has been addressed by incorporating compounds like iodixanol to tune the bioink's refractive index, reducing scattering effects by approximately 10-fold and achieving 50 μm resolution even at cell densities of 0.1 billion cells per milliliter [47].
Microfluidic Integration
Microfluidic technology provides the critical link between OoC and 3D bioprinting platforms, enabling precise fluid control at the microscale. The integration of microfluidics enhances 3D cell culture models by facilitating dynamic perfusion that ensures uniform nutrient distribution and waste removal throughout cellular constructs [45]. This continuous perfusion maintains cell viability and function over extended periods, more closely resembling the nutrient exchange observed in vivo [45].
Microfluidic platforms also enable the establishment of spatial gradients of signaling molecules, such as growth factors and oxygen, which play crucial roles in cellular behavior and differentiation [45]. Additionally, these systems allow for the application of mechanical stimuli, including fluid shear stress and cyclic strain, that influence cellular responses and tissue development [45].
Table 1: Comparative Analysis of Advanced Cell Culture Systems
| Feature | 2D Culture | Organ-on-Chip | 3D Bioprinting |
|---|---|---|---|
| Structural Complexity | Flat, monolayer | Moderate, with tissue-tissue interfaces | High, controlled spatial arrangement |
| Microenvironment Control | Limited | High, with dynamic flow and gradients | Moderate, depends on design and bioink |
| Physiological Relevance | Low | High, incorporates mechanical forces | Moderate to high, depends on complexity |
| Scalability | High | Moderate, challenging for high-throughput | Improving with automation |
| Throughput | High | Moderate | Lower, but improving |
| Cost | Low | Moderate to high | High initially, potentially cost-effective long-term |
| Applications | Basic screening, toxicity | Disease modeling, drug testing | Tissue engineering, personalized medicine |
Experimental Data and Performance Comparison
Quantitative Comparison of 2D vs. 3D Models
Recent studies have provided compelling quantitative data demonstrating the superior physiological relevance of 3D models compared to traditional 2D cultures. Research comparing 2D and 3D tumor models revealed significant differences in proliferation rates, metabolic profiles, and drug responses [13].
In studies using U251-MG human glioblastoma and A549 human lung adenocarcinoma cell lines, 3D cultures demonstrated reduced proliferation rates compared to 2D cultures, attributed to limited diffusion of nutrients and oxygen that more closely mimics in vivo tumor conditions [13]. Metabolic analysis revealed distinct profiles in 3D cultures, including elevated glutamine consumption under glucose restriction and higher lactate production, indicating an enhanced Warburg effect characteristic of in vivo tumors [13].
Perhaps most significantly, microfluidic-enabled monitoring revealed increased per-cell glucose consumption in 3D models, highlighting the presence of fewer but more metabolically active cells compared to 2D cultures [13]. This finding underscores the importance of 3D models for obtaining physiologically relevant metabolic data.
Table 2: Experimental Comparison of 2D vs. 3D Tumor Models
| Parameter | 2D Culture | 3D Culture | Implications |
|---|---|---|---|
| Proliferation Rate | High | Reduced, diffusion-limited | Better mimics in vivo tumor growth |
| Glucose Consumption (per cell) | Lower | Higher | More metabolically active cells in 3D |
| Lactate Production | Lower | Higher | Enhanced Warburg effect in 3D |
| Glutamine Consumption | Less responsive to glucose restriction | Elevated under glucose restriction | Alternative metabolic pathways activated |
| Cell Viability under Glucose Deprivation | Rapid cell death (1-3 days) | Extended survival (>5 days) | Better mimics tumor adaptability |
| Gene Expression Profile | Standard | Altered (e.g., CD44, OCT4, SOX2) | Enhanced stemness and drug resistance |
Performance in Drug Development Applications
The enhanced physiological relevance of OoC and 3D bioprinted models translates directly to improved performance in drug development applications. It is estimated that the use of OoC technology can reduce research, development and innovation (RDI) costs by 10-30%, representing a significant potential saving in the drug development process [48].
OoC platforms have demonstrated particular utility in drug toxicity assessment, where they provide more accurate prediction of human responses compared to traditional models. For example, liver-on-chip models enable better evaluation of drug-induced liver injury, while heart-on-chip models allow for more comprehensive assessment of cardiotoxicity [45]. The integration of sensors within OoC devices facilitates real-time monitoring of cellular responses to drug compounds, enabling earlier identification of adverse effects [45].
In the context of personalized medicine, both OoC and 3D bioprinting technologies offer opportunities to incorporate patient-specific cells, potentially enabling the development of tailored therapeutic approaches. The creation of patient-derived organoids and their integration into microfluidic platforms (organoids-on-chip) represents a particularly promising approach for predicting individual patient responses to treatments [46] [49].
Detailed Experimental Protocols
Protocol for Tumor-on-Chip Metabolic Analysis
This protocol outlines the methodology for comparing metabolic patterns in 2D versus 3D tumor models using microfluidic platforms, based on experimental approaches described in the literature [13].
Materials and Reagents:
- Microfluidic chips with appropriate architecture for 3D culture (e.g., collagen-based hydrogel compatibility)
- Cell lines of interest (e.g., U251-MG glioblastoma, A549 lung adenocarcinoma)
- Collagen-based hydrogel or similar ECM-mimicking material
- Cell culture media with varying glucose concentrations (high, low, and no glucose conditions)
- Metabolic assay reagents (e.g., Alamar Blue for metabolic activity, glucose/glutamine/lactate assay kits)
- Polydopamine coating for surface treatment (optional, for improved hydrogel adhesion)
Procedure:
- Chip Preparation: If necessary, treat microfluidic chip surfaces with polydopamine to enhance hydrogel adhesion [13].
- 3D Model Setup: For 3D cultures, suspend individual cells in collagen-based hydrogel at appropriate density and introduce into microfluidic chip chambers. Allow for hydrogel polymerization.
- 2D Model Setup: For comparative 2D cultures, seed cells on traditional culture plates or within designated 2D regions of chips at equivalent densities.
- Culture Maintenance: Apply culture media with defined glucose concentrations (high: standard glucose; low: reduced glucose; no glucose: glucose-free media) to both 2D and 3D models.
- Continuous Monitoring: Maintain cultures for extended period (up to 10 days for 3D models), with regular monitoring of metabolic parameters.
- Metabolic Assessment:
- Daily measurements of glucose consumption, glutamine consumption, and lactate production using appropriate assay kits
- Regular assessment of metabolic activity using Alamar Blue or similar reagents
- Microscopic monitoring of cell proliferation and morphology
- Endpoint analysis of gene expression patterns for metabolic markers
Data Analysis:
- Compare proliferation rates between 2D and 3D cultures under different nutrient conditions
- Calculate metabolic fluxes based on nutrient consumption and waste product accumulation
- Analyze differences in gene expression profiles related to metabolism
- Correlate morphological features with metabolic patterns
Protocol for 3D Bioprinting of Tissue Constructs
This protocol describes the general methodology for creating 3D tissue constructs using bioprinting techniques, based on current advancements in the field [47].
Materials and Reagents:
- Bioprinter (extrusion-based, inkjet, or laser-assisted depending on application)
- Bioink appropriate for cell type and printing technology (e.g., polymer-based hydrogels, decellularized matrix bioinks)
- Cells of interest (primary cells, cell lines, or stem cells)
- Crosslinking agents if required by bioink chemistry (e.g., UV light for photopolymerizable bioinks, calcium for alginate)
- Culture media specific to cell type
- Bioreactor system for post-printing maturation (optional)
Procedure:
- Bioink Preparation: Mix cells with bioink material at appropriate density (typically 1-10 million cells/mL), ensuring uniform distribution while maintaining cell viability.
- Printer Setup: Calibrate bioprinter according to manufacturer specifications. For extrusion-based printing, optimize parameters including pressure, speed, and nozzle diameter. For light-based printing, optimize light intensity and exposure time.
- Printing Process:
- Load bioink into printing cartridge while maintaining sterility
- Execute printing according to predefined digital model
- Implement crosslinking during or immediately after printing as required by bioink properties
- Post-processing: Transfer printed constructs to culture conditions, applying appropriate media and environmental controls.
- Tissue Maturation: Maintain constructs in culture for necessary maturation period, potentially using bioreactor systems to apply mechanical stimulation.
Quality Assessment:
- Evaluate structural fidelity compared to digital model
- Assess cell viability post-printing (typically 70-95% depending on technology)
- Characterize tissue functionality through marker expression, metabolic activity, and mechanical properties
Signaling Pathways and Experimental Workflows
The following diagrams illustrate key signaling pathways and experimental workflows relevant to advanced cell culture systems, created using Graphviz DOT language.
Diagram 1: Tumor Metabolic Pathways in 2D vs 3D Cultures. This diagram illustrates key metabolic pathways that differ between traditional 2D and advanced 3D culture models, particularly highlighting the enhanced Warburg effect (glycolysis leading to lactate production) and alternative pathway activation (glutamine metabolism) under nutrient restriction in 3D models [13].
Diagram 2: Experimental Workflow for 2D vs 3D Culture Comparison. This workflow outlines the parallel processes for establishing and analyzing traditional 2D cultures (red) versus advanced 3D culture models (green) in microfluidic platforms, highlighting key methodological differences at each stage [13].
The Scientist's Toolkit: Essential Research Reagents and Materials
Table 3: Essential Research Reagents and Materials for Advanced Cell Culture Systems
| Category | Specific Items | Function/Application | Examples/Notes |
|---|---|---|---|
| Microfluidic Materials | PDMS | Chip fabrication | Optically transparent, gas-permeable elastomer [45] |
| Extracellular matrix hydrogels | 3D scaffold formation | Collagen-based, Matrigel for organoid culture [13] [46] | |
| Perfusion systems | Medium flow control | Pumps, tubing for dynamic culture [45] | |
| Bioprinting Materials | Bioinks | Cell-laden printing | Polymer-based hydrogels, decellularized matrices [47] |
| Rheology modifiers | Bioink optimization | Adjust viscosity for printability [47] | |
| Crosslinking agents | Structure stabilization | UV light, calcium ions, thermal methods [47] | |
| Cell Culture Reagents | Specialized media | Cell-type specific support | Organ-specific formulations with growth factors [46] |
| Metabolic assay kits | Functional assessment | Glucose, glutamine, lactate measurement [13] | |
| Viability indicators | Cell health monitoring | Alamar Blue, Live/Dead staining [13] | |
| Analysis Tools | Microscopy systems | Structural imaging | Confocal, fluorescence for 3D visualization [13] |
| Biosensors | Real-time monitoring | Oxygen, pH, metabolite sensors [45] | |
| Molecular biology kits | Gene expression analysis | RNA sequencing, PCR for validation [13] |
The convergence of organ-on-chip technology, 3D bioprinting, and microfluidics represents a paradigm shift in biomedical research, offering unprecedented opportunities to model human physiology and disease. These advanced systems address critical limitations of traditional 2D cultures, particularly in recapitulating the three-dimensional architecture, microenvironmental cues, and multicellular interactions that define tissue function in vivo [48] [45] [13].
Looking forward, several emerging trends are poised to further enhance the capabilities of these technologies. The development of multi-organ platforms that integrate multiple tissue types within interconnected microfluidic networks will enable the study of systemic physiological responses and organ-organ interactions [45] [47]. The incorporation of patient-derived cells, including induced pluripotent stem cells (iPSCs), will facilitate the creation of personalized models for precision medicine applications [46]. Advances in sensing technologies and integration with artificial intelligence will improve real-time monitoring capabilities and enable more sophisticated data analysis [45] [47].
Despite the remarkable progress, challenges remain in achieving widespread adoption of these advanced systems. Standardization of protocols and materials across different platforms is essential to ensure reproducibility and comparability of results [45]. Scalability remains a constraint for high-throughput applications, though continued technological innovations are addressing this limitation [48]. Finally, regulatory acceptance of these models for drug development and toxicity testing requires extensive validation and establishment of clear qualification pathways [45].
In conclusion, advanced systems integrating organs-on-chips, 3D bioprinting, and microfluidics are transforming biomedical research by providing more physiologically relevant models of human tissues and organs. As these technologies continue to mature and overcome current limitations, they hold tremendous promise for accelerating drug discovery, advancing personalized medicine, and reducing reliance on animal models, ultimately contributing to more effective and efficient development of therapies for human diseases.
In the relentless pursuit of effective cancer therapies, the choice of cell culture model is not merely a technical decision but a foundational one that shapes translational outcomes. Traditional two-dimensional (2D) cell culture, where cells grow as a monolayer on flat plastic surfaces, has powered biomedical breakthroughs for decades. However, its limitations in predicting human physiology have become starkly clear, with a prominent example being a cancer therapy that cleared preclinical hurdles in 2D models and animal trials only to fail badly in Phase I human testing [3]. This failure was attributed to the model's inability to mimic the complex three-dimensional (3D) ecosystem of a real tumor, known as the tumor microenvironment [3]. This realization has catalyzed a shift toward three-dimensional (3D) cell culture—a move from Petri dish biology to tissue-like realism. This guide objectively compares the performance of 2D and 3D cell culture models within three critical applications: fundamental cancer research, the advancement of personalized medicine, and high-throughput drug screening. By synthesizing current experimental data and protocols, we provide a structured framework to help researchers, scientists, and drug development professionals select the most appropriate model for their specific goals.
Performance Comparison in Core Applications
The following tables summarize quantitative and qualitative performance data for 2D and 3D models across the spotlighted application areas, synthesizing findings from recent investigations.
Table 1: Performance in Cancer Research & Disease Modeling
| Feature | 2D Model Performance | 3D Model Performance | Experimental Evidence & Context |
|---|---|---|---|
| Tumor Architecture | Lacks spatial organization; forced monolayer growth [31]. | Forms structures (e.g., spheroids) with tissue-like spatial organization and layers [31] [7]. | MCTS mimic in vivo solid tumours in architecture, growth kinetics, and cellular heterogeneity [7]. |
| Tumor Microenvironment (TME) | Limited cell-cell and cell-ECM interaction; no physiological gradients [31]. | Recapitulates cell-ECM interaction, nutrient, oxygen, and pH gradients, and hypoxic cores [3] [13]. | 3D tumour spheroids model hypoxic tumor cores, critical for studying therapy resistance [3]. |
| Metabolic Profiles | Uniform nutrient access; high proliferation rates; does not mimic in vivo metabolism [13]. | Distinct, heterogeneous profiles; limited nutrient diffusion; reduced proliferation; enhanced Warburg effect observed [13]. | A 2025 microfluidic study showed 3D models have increased per-cell glucose consumption and lactate production [13]. |
| Gene & Protein Expression | Altered expression and splicing due to unnatural growth surface [31]. | Better preserves in vivo-like gene expression and splicing patterns; expression fidelity is critical for accurate biology [3] [31]. | Genes like ANXA1, CD44, OCT4, and SOX2 are differentially expressed in 3D prostate cancer models [13]. |
| Drug Resistance Behavior | Often overestimates drug efficacy; fails to model resistance mechanisms driven by TME [3]. | More accurately mimics inherent drug resistance due to barriers in penetration and TME-mediated survival pathways [3] [50]. | 3D cultures are more resistant to drug treatments, analogous to what occurs in the human body [50]. |
Table 2: Performance in Personalized Medicine & Drug Screening
| Feature | 2D Model Performance | 3D Model Performance | Experimental Evidence & Context |
|---|---|---|---|
| Predictive Accuracy for Clinical Response | Poor; only ~3.4% clinical success rate for oncology drugs first tested in 2D [51]. | Enhanced physiological relevance leads to more accurate prediction of in vivo efficacy and toxicity [51]. | 3D data are increasingly included in submissions to regulatory bodies like the FDA and EMA [3]. |
| Personalized Therapy Testing | Limited, as cultures lose patient-specific histology and genetic features quickly. | High; patient-derived organoids (PDOs) biobanks retain patient-specific tumor biology for drug matching [3] [7]. | Memorial Sloan Kettering uses PDOs to match therapies to drug-resistant pancreatic cancer patients [3]. |
| High-Throughput Screening (HTS) | Excellent; simple, inexpensive, scalable, and compatible with robust automation [3] [8]. | Improving; amenable to HTS using spheroids in U-bottom plates, but more complex and costly than 2D [52] [51]. | Revvity offers a 3D HTS service with a panel of ~200 cell lines screened in U-bottom spheroid plates [51]. |
| Throughput & Cost | High throughput, low cost per data point [3] [8]. | Lower throughput and higher cost than 2D, but prevents costly late-stage failures [3] [8]. | A tiered approach (2D for screening → 3D for prediction) is cost-effective for many labs [3]. |
| ADME-Tox Prediction | Poor predictor of human Absorption, Distribution, Metabolism, Excretion, and Toxicology [50]. | Promising alternative for predicting compound pharmacokinetic and pharmacodynamic fate in humans [50]. | 3D models like organoids and micro-physiological systems show great potential for human-relevant ADME-Tox [50]. |
Experimental Protocols for Key Applications
Protocol: Generating Multicellular Tumor Spheroids (MCTS) for Drug Screening
The following methodology is adapted from recent studies that compared techniques for producing consistent MCTS, particularly for colorectal cancer cell lines [7].
- Objective: To create standardized, compact 3D MCTS for reliable drug sensitivity testing.
- Cell Lines: The protocol has been applied to a panel of CRC lines (DLD1, HCT8, HCT116, LoVo, LS174T, SW480, SW620) and was specifically optimized for the previously challenging SW48 line [7].
- Key Materials:
- CellCarrier Spheroid ULA Plates (or regular U-bottom plates treated with an anti-adherence solution as a cost-effective alternative) [7] [51].
- Complete cell culture medium.
- Method-Specific Additives: Methylcellulose, Matrigel, or Collagen Type I hydrogels can be incorporated to promote compact spheroid formation in reluctant cell lines [7].
- Detailed Workflow:
- Cell Preparation: Create a single-cell suspension and determine cell count and viability.
- Plate Seeding: Seed cells at an optimized density (e.g., 750 cells per well for HT-29 in a 384-well plate) into the ULA plates [51]. Centrifuge plates briefly at low speed to aggregate cells at the well bottom.
- Culture: Incubate plates at 37°C with 5% CO₂ for 3-7 days. Compact spheroids typically form within this period.
- Validation: Monitor spheroid formation and morphology daily using brightfield microscopy. A well-formed spheroid will appear as a single, compact, and spherical aggregate [7] [51].
- Technical Notes: The hanging drop method and liquid overlay on agarose are alternative techniques, but U-bottom plates produce more homogeneous, single spheroids ideal for HTS [7]. Co-culture with fibroblasts (e.g., immortalized colonic fibroblasts like CCD-18Co) can be introduced during seeding to add TME complexity [7].
Protocol: Microfluidic Monitoring of Tumor Spheroid Metabolism
This protocol is based on a 2025 study that quantitatively compared metabolic patterns in 2D and 3D cultures using a microfluidic chip [13].
- Objective: To continuously monitor nutrient consumption and waste production in 3D tumor spheroids under controlled conditions.
- Cell Lines: Demonstrated with U251-MG human glioblastoma and A549 human lung adenocarcinoma cells [13].
- Key Materials:
- Microfluidic Chip with integrated microbioreactors.
- Collagen-Based Hydrogel to mimic the ECM and embed cells.
- Assay Kits for metabolites: Glucose, Glutamine, and Lactate.
- Alamar Blue Reagent to quantify metabolically active cells.
- Detailed Workflow:
- Chip Preparation: If required, treat the microfluidic chip surface with polydopamine to prevent hydrogel detachment during culture [13].
- 3D Model Seeding: Mix individual cells with the collagen hydrogel and seed into the microfluidic chip's culture chambers. This method allows cells to self-organize into spheroids, mimicking tumorigenesis [13].
- Perfusion Culture: Continuously perfuse culture medium with defined nutrient levels (e.g., high glucose, low glucose, glucose deprivation) through the microfluidic channels.
- Continuous Monitoring: Collect effluent daily for metabolite analysis using the specific assay kits.
- Endpoint Analysis: At the end of the culture period (e.g., 10 days), assess the number of metabolically active cells using Alamar Blue reagent [13].
- Technical Notes: This platform enables the study of nutrient gradients and their impact on tumor development in a way that is impossible with traditional 2D culture. The culture is typically divided into a "formation phase" (days 1-5) and a "spheroid growth/maintenance phase" (days 6-10) for analysis [13].
Visualizing Workflows and Biological Relationships
Decision Framework for Model Selection
This diagram outlines a strategic tiered approach for integrating 2D and 3D models in the drug discovery pipeline.
The 3D Tumor Spheroid Microenvironment
This diagram illustrates the key structural and physiological features of a multicellular tumor spheroid that contribute to its physiological relevance.
The Scientist's Toolkit: Essential Research Reagents and Materials
Table 3: Key Reagents and Materials for 3D Cell Culture
| Item | Function/Application | Example Use-Case |
|---|---|---|
| Ultra-Low Attachment (ULA) Plates | Prevents cell attachment to the plastic surface, forcing cell-cell adhesion and spheroid self-assembly. | High-throughput spheroid formation for drug screening (e.g., Revvity's CellCarrier Spheroid ULA plate) [51]. |
| Matrigel | A naturally derived, complex basement membrane matrix. Provides a biologically active scaffold for 3D growth and organoid culture. | Used to culture cells that require strong ECM cues to form tissue-like structures [7]. |
| Collagen Type I | A major component of the native extracellular matrix. Forms a hydrogel scaffold for 3D cell embedding. | Used in microfluidic chips to create a collagen-based hydrogel for spheroid self-organization [13]. |
| Methylcellulose | A viscosity-enhancing polymer. Added to media to reduce cell settling and promote compact spheroid formation. | An additive to help challenging cell lines (e.g., SW48) form compact spheroids in U-bottom plates [7]. |
| Alamar Blue / ATP-based Assays | Cell viability and metabolic activity assays optimized for 3D cultures, ensuring reagent penetration and signal detection. | Quantifying metabolically active cells in spheroids (e.g., ATPlite 3D assay) [13] [51]. |
| Microfluidic Chips | Miniaturized devices that allow for perfusion culture, precise control of the microenvironment, and real-time monitoring. | Studying nutrient gradients and metabolic fluxes in 3D spheroids over time [13]. |
The pharmaceutical industry and academic research institutions are increasingly adopting three-dimensional (3D) cell culture models to bridge the translational gap between traditional laboratory research and clinical outcomes. This shift is driven by the recognition that conventional two-dimensional (2D) cell cultures, while useful for high-throughput screening, often fail to recapitulate the complex physiology of human tissues, contributing to high failure rates in drug development [3]. Leading organizations are now leveraging advanced 3D technologies—including organoids, tumor spheroids, and organ-on-a-chip systems—to create more predictive models for drug discovery, disease modeling, and personalized medicine. This guide objectively compares the performance of these emerging 3D technologies against traditional 2D methods through specific industrial use cases, providing detailed experimental protocols and quantitative data to illustrate their impact on research and development outcomes.
Industrial Use Cases: From Research to Application
Major pharmaceutical companies and research institutions are implementing 3D cell culture technologies to address specific challenges in their R&D pipelines. The following examples highlight practical applications and validated outcomes.
Roche: Implementing 3D Models for Complex Disease Research
Roche has established the Institute of Human Biology (IHB) specifically to pioneer new approaches in drug discovery using human-relevant models [53]. The institute focuses on creating reliable predictive models, particularly human organoids, that better emulate the human body.
- Strategic Approach: IHB operates as a cross-disciplinary hub combining expertise in human biology, bioengineering, computational science, and pharmaceutical research. A key goal is to make organoid generation highly reproducible and consistent for application throughout the drug development process [53].
- Specific Applications:
- Target Identification and Validation: Using organoids to identify and validate novel therapeutic targets across disease areas.
- Preclinical Safety and Efficacy: Modeling organ-specific toxicities and treatment responses in human-derived tissues.
- Personalized Medicine: Developing patient-derived organoids to predict individual patient responses to therapies [53].
- Performance Data: Roche utilizes 3D tumor spheroids to model hypoxic tumor cores and test immunotherapies, recognizing that the tumor microenvironment critically influences treatment efficacy [3]. This approach allows for more accurate study of how tumors respond to treatments in conditions that mimic the in vivo reality.
Emulate Inc.: Organ-on-a-Chip Technology for Predictive Toxicology and Disease Modeling
Emulate Inc. provides organ-on-a-chip technology that simulates the microenvironment of human organs, offering a platform for more physiologically relevant testing. Their technology has been adopted by multiple pharmaceutical companies and research institutions for specific applications [54].
Table 1: Emulate Organ-on-a-Chip Applications by Institution
| Institution | Organ Model | Application | Key Findings/Objectives |
|---|---|---|---|
| AbbVie | Intestine-Chip | Inflammatory Bowel Disease (IBD) | Study impact of therapeutic intervention on goblet cells and barrier integrity [54] |
| Boehringer Ingelheim | Liver-Chip | Drug-Induced Liver Injury (DILI) | Cross-species DILI prediction and comparative liver toxicity studies [54] |
| Pfizer | Lymph Node-Chip | Immunotoxicity Testing | Predict antigen-specific immune responses for preclinical immunotoxicity testing [54] |
| Bayer | Blood-Brain Barrier (BBB)-Chip | CNS Drug Development | Translational studies to bridge in vitro prediction and in vivo outcomes [54] |
| Institut Pasteur | Lung-Chip | Infectious Disease | Study infection and barrier disruption from Streptococcus pneumoniae and SARS-CoV-2 variants [54] |
| US Air Force Research Laboratory | Brain-Chip | Neurotoxin Exposure | Rapid detection of neurotoxin exposure and evaluation of interventions using machine learning [54] |
The recent introduction of Emulate's AVA Emulation System, a next-generation 3-in-1 Organ-Chip platform, addresses scalability challenges by enabling 96 independent Organ-Chip experiments in a single run. This system demonstrates a four-fold reduction in consumable spend and up to 50% fewer cells and media per sample compared to previous generation technology, while reducing hands-on lab time by more than half through automation [54].
NIH and Academic Partnerships: Advancing Basic Research and Therapeutic Discovery
The National Institutes of Health (NIH) and its academic partners are employing 3D models to advance understanding of disease mechanisms and develop novel therapeutic approaches.
- NIH and Harvard Collaboration: Researchers built brain organoids to model the impact of the Zika virus on fetal development, providing a human-relevant system to study infectious disease pathology and potential interventions [3].
- Memorial Sloan Kettering Cancer Center (MSKCC): Uses patient-derived organoids to match therapies to individuals with drug-resistant pancreatic cancer, advancing personalized oncology approaches [3].
- Queen Mary University of London: Developed multiple musculoskeletal models, including a personalized synovium-cartilage chip for studying patient-specific inflammation in osteoarthritis and a bone metastasis model integrated with multi-omics tools for tracking osteolytic changes [54].
- University of Rochester Medical Center: Created a cutting-edge bone marrow chip to study acute myeloid leukemia in vitro, supporting personalized oncology research [54].
Comparative Experimental Data: 2D vs. 3D Performance
Recent studies provide quantitative comparisons between 2D and 3D models, demonstrating the enhanced predictive capability of 3D systems for drug response and physiological modeling.
Large-Scale Validation of 3D Micro-Tumor Model
A 2022 study established a matrigel-based 3D micro-tumor model on an array chip and conducted large-scale validation of its predictive value for in vivo drug response [55].
Table 2: Performance Comparison of 2D vs. 3D Tumor Models in Drug Screening [55]
| Parameter | 2D Model | 3D Micro-Tumor Model | Implications |
|---|---|---|---|
| Proliferation Kinetics | Faster proliferation rate | Slower proliferation kinetics | 3D model better mimics in vivo tumor growth rates |
| Morphology | Flat, stretched cells | Spheroid architecture | 3D model recapitulates tumor microarchitecture |
| Drug Resistance | Baseline sensitivity | 17.6% drug resistance identified | 3D model detects clinically relevant resistance mechanisms |
| False Positive Results | High (95% not confirmed in vivo) | Excluded 95% of 2D false positives | 3D model significantly improves prediction accuracy |
| Gene Expression Profile | ~30% genes differentially expressed vs in vivo | More similar to in vivo profile | 3D model better represents tumor biology |
Experimental Protocol: The matrigel-based 3D model was established on a specially designed array chip (IBAC S1). Cells were resuspended and mixed with matrigel on ice, then 8μL of the matrigel-cell mixture was added to each well of the chip. The chip was incubated at 37°C for 10 minutes to solidify the matrix, followed by addition of 150μL culture medium. The model was cultured for 4 days before drug administration, allowing spheroid formation [55].
Tumor-on-a-Chip Metabolic Analysis
A 2025 comparative study used a microfluidic chip to quantitatively compare metabolic patterns between 2D and 3D cultures, revealing critical differences in tumor metabolism [56].
Table 3: Metabolic Differences Between 2D and 3D Tumor Models [56]
| Metabolic Parameter | 2D Culture | 3D Culture | Biological Significance |
|---|---|---|---|
| Proliferation Rate | Higher proliferation | Reduced proliferation due to diffusion limits | Mimics nutrient/oxygen gradients in real tumors |
| Glutamine Consumption | Standard utilization | Elevated under glucose restriction | Demonstrates metabolic adaptability in 3D environment |
| Lactate Production | Standard production | Higher lactate production | Indicates enhanced Warburg effect in 3D models |
| Per-Cell Glucose Consumption | Standard consumption | Increased per-cell consumption | Suggests fewer but more metabolically active cells |
| Metabolic Heterogeneity | Uniform profile | Distinct metabolic profiles | Better represents tumor metabolic heterogeneity |
Experimental Protocol: The study employed a microfluidic chip that enabled daily monitoring of key metabolites (glucose, glutamine, lactate). This continuous monitoring approach allowed researchers to track dynamic changes in metabolic activity over time, revealing how 3D architecture influences nutrient consumption and waste production patterns in ways that mirror in vivo tumor behavior [56].
Technical Workflows and Signaling Pathways
The transition from 2D to 3D cell culture involves significant changes in both technical workflows and cellular signaling pathways. The following diagrams illustrate these differences.
Comparative Experimental Workflow: 2D vs. 3D Drug Screening
Diagram 1: Comparative drug screening workflow in 2D vs. 3D models.
Signaling Pathway Differences in 2D vs. 3D Environments
Diagram 2: Signaling pathways activated in 3D microenvironments.
The Scientist's Toolkit: Essential Research Reagents and Platforms
Implementing 3D cell culture technologies requires specific reagents, equipment, and platforms. The following table details key solutions used in the featured studies and industrial applications.
Table 4: Essential Research Reagents and Platforms for 3D Cell Culture
| Product Category | Specific Examples | Function/Application | Industrial Users |
|---|---|---|---|
| Extracellular Matrices | Matrigel (#354234, Corning) [55] | Provides scaffold for 3D growth; mimics in vivo ECM | Roche, Academic labs |
| Specialized 3D Culture Platforms | Array Chip (IBAC S1, Daxiang Biotech) [55] | Enables high-throughput 3D culture with minimal reagent use | Pharma screening labs |
| Organ-on-a-Chip Systems | Emulate Zoë-CM2 [54], Chip-R1 [54] | Provides controlled microenvironments for organ-specific models | AbbVie, Boehringer Ingelheim, Pfizer |
| 3D-Optimized Viability Assays | CellTiter-Glo 3D (#G9683, Promega) [55] | Measures cell viability in 3D structures with optimized reagent penetration | Universal application |
| High-Throughput Systems | AVA Emulation System (Emulate) [54] | Enables 96 simultaneous organ-chip experiments with automated imaging | Pharma and translational research |
| Scaffold-Free Systems | Ultra-low attachment plates (Corning) [3] | Promotes spheroid formation through minimized cell attachment | Academic and drug screening labs |
The industrial adoption of 3D cell culture technologies represents a paradigm shift in biomedical research and drug development. As demonstrated by leading pharmaceutical companies and research institutions, 3D models—including organoids, tumor spheroids, and organ-on-a-chip systems—provide superior predictive value for drug responses and disease mechanisms compared to traditional 2D cultures. The experimental data show that 3D models can identify drug resistance mechanisms missed by 2D screening (17.6% higher resistance detection) and exclude 95% of false positive results generated in 2D systems [55]. Furthermore, the distinct metabolic profiles and gene expression patterns observed in 3D cultures more closely mirror in vivo conditions [56].
The future of this field lies not in choosing between 2D and 3D models, but in developing integrated workflows that leverage the strengths of each approach. As noted by industry leaders, the most effective strategy often involves using 2D models for initial high-throughput screening followed by 3D models for validation and mechanistic studies [3]. This tiered approach, combined with advancing technologies in automation, microfluidics, and AI-driven data analysis, promises to accelerate the development of more effective and safer therapeutics through human-relevant models that better predict clinical outcomes.
Navigating the Third Dimension: Overcoming Practical Challenges
The choice between two-dimensional (2D) and three-dimensional (3D) cell culture models represents a significant strategic decision for research and development laboratories, extending far beyond mere technical considerations to encompass substantial financial and resource implications. While 2D cell culture has served as the workhorse for biological research for decades, growing cells as flat monolayers on plastic surfaces, 3D cell culture techniques that allow cells to grow in all directions to form tissue-like structures are increasingly demonstrating superior biological relevance [57]. This evolution from flat biology to dimensional realism introduces complex economic considerations that balance immediate costs against long-term scientific value.
Research directors and laboratory managers now face a critical juncture: continue with the established, cost-effective 2D systems or invest in the more physiologically relevant but resource-intensive 3D technologies. This analysis systematically examines the equipment, consumable, and hidden costs associated with both approaches while quantifying their relative long-term value propositions. The decision framework presented here aims to guide research institutions, pharmaceutical companies, and academic laboratories in making strategically sound investments that align with their scientific objectives and financial constraints, particularly as the 3D cell culture market rapidly evolves and is projected to grow at a compound annual growth rate (CAGR) of 15% through 2030 [58].
Financial Analysis: Direct and Indirect Costs of 2D and 3D Culture
Equipment and Infrastructure Costs
The initial capital investment required for implementing 2D versus 3D cell culture systems varies significantly, with 3D systems generally demanding more specialized equipment. Traditional 2D culture relies on standard laboratory equipment that most biological research facilities already possess, whereas 3D culture often requires purpose-built instruments to create and maintain the three-dimensional cellular environments.
Table 1: Equipment Cost Comparison for 2D vs. 3D Cell Culture
| Equipment Type | 2D Culture Requirements | 3D Culture Additional Requirements |
|---|---|---|
| Core Culture Devices | Standard CO₂ incubators, basic biological safety cabinets | Specialized incubators, hypoxia chambers |
| Culture Vessels | Traditional flasks, dishes, multi-well plates (<$100-500) | Low-attachment plates, bioreactors, microfluidic chips ($200-1000+) |
| Scaffolding Systems | Not applicable | Hydrogel kits, ECM matrices, 3D scaffolds ($150-800) |
| Analysis Instruments | Standard inverted microscopes | Confocal microscopes, high-content imaging systems |
| Specialized Systems | Basic liquid handling equipment | Bioprinters, spinning flask apparatus |
For laboratories establishing 3D capabilities, the most significant initial investments typically include advanced imaging systems capable of resolving thick 3D structures (such as confocal microscopes), specialized culture vessels that promote 3D growth (such as ultra-low attachment plates or microfluidic chips), and scaffolding materials that provide structural support for 3D cultures [59] [57]. The emerging category of organ-on-chip platforms represents a particularly sophisticated 3D culture system that incorporates microfluidics to create controlled microenvironments, with these advanced systems commanding premium prices but offering enhanced physiological relevance [58].
Consumables and Reagent Expenses
The recurring costs of consumables and reagents present another significant financial consideration, with 3D cultures typically incurring higher ongoing expenses. These cost differentials stem from the more complex materials required to support three-dimensional growth and the specialized supplements needed to maintain tissue-like structures over time.
Table 2: Consumables Cost Structure for 2D vs. 3D Cell Culture
| Consumable Category | 2D Culture Costs | 3D Culture Costs | Key Cost Drivers |
|---|---|---|---|
| Culture Vessels | $1-5 per standard plate | $5-50 per specialized plate | Plate geometry, surface modifications |
| Extracellular Matrices | Minimal coating costs | $50-500 per experiment | Natural vs. synthetic hydrogels |
| Media & Supplements | Basic media formulations | Enhanced media with specialized factors | Growth factors, differentiation cues |
| Cell Sources | Standard cell lines | Primary cells, stem cells, co-cultures | Cell type complexity, sourcing method |
| Assay Kits | Standardized protocols | Often require optimization | Antibody penetration issues |
The single most significant consumable cost differentiator lies in the extracellular matrix (ECM) substitutes required for 3D cultures. Scaffold-based 3D systems utilize natural hydrogels (such as collagen or Matrigel) or synthetic polymers to provide structural support, with natural hydrogels better mimicking the native ECM but exhibiting batch-to-batch variability [12] [59]. Scaffold-free systems (including hanging drop methods and low-adhesion plates) avoid these material costs but may produce more heterogeneous structures [12]. Additionally, 3D cultures often require specialized media formulations containing specific growth factors and differentiation cues not needed in 2D systems, further increasing recurring expenses [8].
Labor and Training Considerations
The human resource requirements for 2D and 3D culture techniques differ substantially, with 3D methods typically demanding more specialized technical expertise and hands-on time. Established 2D culture protocols are well-standardized and familiar to most researchers, whereas 3D techniques often require additional training and optimization.
Laboratory professionals working with 3D systems must master techniques such as handling viscous hydrogel solutions, quantifying 3D cell viability, and optimizing scaffold polymerization conditions [57]. The imaging and analysis of 3D cultures also presents technical challenges, requiring expertise in confocal microscopy, z-stack imaging, and 3D reconstruction software [59]. These specialized skills translate to longer training periods and potentially higher compensation requirements for qualified personnel. Furthermore, the experimental timelines for 3D cultures are often extended, with some organoid models requiring weeks or months to fully develop, compared to days for 2D cultures [13] [8].
Experimental Design: Methodologies for Cost-Benefit Assessment
Protocol for Comparative Drug Screening Assay
To objectively evaluate the cost-benefit ratio of 2D versus 3D culture systems, researchers can implement a direct comparative assay measuring compound efficacy. The following protocol outlines a standardized approach for parallel screening using both culture formats.
Materials and Reagents:
- Cell line of interest (e.g., HCT116 colon carcinoma or U251-MG glioblastoma [13])
- Standard 2D culture vessels (tissue culture-treated plates)
- 3D culture platform (ultra-low attachment spheroid plates or hydrogel system)
- Compound library for screening
- Cell viability assay kit (e.g., Alamar Blue, CellTiter-Glo 3D)
- High-content imaging system with confocal capability
Methodology:
- Cell Seeding: Seed identical cell numbers into both 2D and 3D formats following platform-specific optimal densities. For 3D cultures, optimize seeding parameters to generate uniform spheroids of 100-300μm diameter [13] [59].
- Culture Period: Maintain cultures for 3-7 days to allow 3D structure formation and microenvironment establishment.
- Compound Treatment: Apply identical compound concentrations to both systems, ensuring appropriate solvent controls.
- Viability Assessment: Measure cell viability at 72-hour post-treatment using a validated 3D-optimized assay [3].
- Data Analysis: Calculate IC₅₀ values and generate dose-response curves for both systems.
- Penetration Assessment: For 3D cultures, include analysis of compound penetration through immunohistochemistry or using fluorescently-labeled compounds [59].
Technical Considerations: The key methodological challenge involves ensuring that viability assays are properly validated for 3D cultures, as standard 2D assays may not penetrate dense spheroids effectively. Additionally, researchers should account for the different growth kinetics in 3D cultures, where proliferation rates are typically reduced due to diffusion limitations [13].
Diagram 1: Drug screening workflow for 2D vs. 3D models.
Metabolic Analysis Protocol in 2D vs 3D Cultures
The following protocol quantifies metabolic differences between 2D and 3D cultures, highlighting the enhanced physiological relevance of 3D systems while accounting for associated cost increments.
Materials and Reagents:
- Microfluidic biochips or standard culture plates
- Glucose, glutamine, and lactate assay kits
- Extracellular flux analyzer (e.g., Seahorse XF)
- Metabolite monitoring system (HPLC or comparable)
Methodology:
- Platform Setup: Establish parallel 2D and 3D cultures using identical cell numbers.
- Metabolite Monitoring: Collect conditioned media at 24-hour intervals for 5-10 days.
- Consumption/Production Rates: Quantify glucose consumption, glutamine utilization, and lactate production using standardized assays.
- Extracellular Flux Analysis: Measure oxygen consumption rates (OCR) and extracellular acidification rates (ECAR) in both systems.
- Gene Expression Analysis: Extract RNA and analyze expression of key metabolic genes (e.g., glycolytic enzymes, transporters).
- Data Normalization: Normalize all metabolic data to cell number or DNA content.
Key Measurements: Research indicates that 3D cultures typically demonstrate elevated glutamine consumption under glucose restriction and higher lactate production, indicating an enhanced Warburg effect more representative of in vivo tumors [13]. These metabolic differences have significant implications for drug development, particularly for compounds targeting metabolic pathways.
Value Assessment: Quantifying Long-Term Research Benefits
Predictive Value in Drug Development
The most significant long-term value of 3D culture systems lies in their enhanced predictive capability for clinical outcomes, potentially saving millions of dollars in failed clinical trials. Traditional 2D models have limitations, with approximately 90% of compounds that show promise in 2D culture failing to progress successfully to clinical trials [13]. This high attrition rate represents enormous sunk costs for pharmaceutical companies.
In contrast, 3D models demonstrate superior performance in predicting drug responses, particularly for solid tumors where tissue architecture and microenvironment play crucial roles in treatment efficacy. Studies comparing chemotherapy agent effectiveness have shown that 3D cultures predicted patient responses more accurately than 2D [60]. This enhanced predictiveness stems from several factors: more physiologically relevant drug penetration barriers, authentic cell-ECM interactions that influence survival signaling, and the development of physiological gradients of oxygen, nutrients, and pH that mimic in vivo conditions [3] [13]. The economic value of these more predictive models becomes apparent when considering that late-stage clinical failures cost pharmaceutical companies an average of $50-100 million per failed compound, suggesting that investments in more predictive 3D systems can yield substantial returns despite higher upfront costs.
Research Efficiency and Translation Impact
Beyond direct financial metrics, 3D culture systems offer significant value through enhanced research efficiency and improved translational impact. The ability to model complex tissue environments in vitro enables researchers to answer biological questions that are intractable in 2D systems, potentially accelerating discovery timelines.
Table 3: Long-Term Value Comparison of 2D vs. 3D Culture Systems
| Value Metric | 2D Culture System | 3D Culture System | Impact Assessment |
|---|---|---|---|
| Predictive Accuracy | Limited clinical translation (≈10% success) | Enhanced clinical relevance | Reduces late-stage failures |
| Biological Complexity | Basic proliferation, cytotoxicity | Disease mechanisms, microenvironment | More comprehensive insights |
| Technical Versatility | Standardized protocols | Specialized applications possible | Addresses complex questions |
| Regulatory Alignment | Historical data abundance | Increasing regulatory acceptance | Future-proofing research |
| Personalized Medicine | Limited patient-specific modeling | Patient-derived organoids possible | Enables precision medicine |
The emerging regulatory landscape further enhances the value proposition of 3D systems. The FDA Modernization Act 2.0 (2022) and proposed Modernization Act 3.0 (2025) specifically promote using human-relevant cell-based assays as alternatives to animal testing [8]. Additionally, regulatory bodies like the FDA and EMA are increasingly including 3D data in submissions [3]. This regulatory shift suggests that investments in 3D capabilities represent a strategic positioning for future research and development requirements.
Strategic Implementation Framework
Hybrid Approach for Balanced Investment
For most research organizations, a complete immediate transition from 2D to 3D culture is neither practical nor financially prudent. A phased, hybrid approach represents the most cost-effective strategy for integrating 3D capabilities while maximizing return on investment.
Tiered Implementation Model:
- Initial Phase: Maintain 2D systems for high-throughput screening and routine maintenance while establishing foundational 3D capabilities for validation studies.
- Intermediate Phase: Implement parallel screening workflows where primary screening occurs in 2D followed by secondary validation in 3D models [3] [57].
- Advanced Phase: Develop specialized 3D models for specific research applications where physiological relevance is critical, such as tumor microenvironment studies or personalized medicine approaches.
This tiered strategy allows laboratories to balance the cost-efficiency and throughput of 2D systems with the predictive power of 3D models, optimizing resource allocation while progressively enhancing research capabilities. Leading research organizations are increasingly adopting this hybrid model, with many advanced labs now using a workflow where 2D serves for initial screening, 3D for prediction, and organoids for personalization [3].
Essential Research Reagent Solutions
Successful implementation of 3D culture systems requires specific reagents and materials that represent core investments. The following table details essential solutions for establishing robust 3D capabilities.
Table 4: Essential Research Reagent Solutions for 3D Cell Culture
| Reagent Category | Specific Examples | Primary Function | Cost Range |
|---|---|---|---|
| Scaffold Materials | Matrigel, collagen, synthetic hydrogels | Provide 3D structural support | $200-500/kit |
| Specialized Media | Organoid differentiation media | Support tissue-specific development | $100-300/L |
| Culture Vessels | Ultra-low attachment plates, microfluidic chips | Enable 3D structure formation | $5-50/plate |
| Analysis Reagents | 3D viability assays, deep tissue labels | Enable quantification in 3D | $150-400/kit |
| Dissociation Kits | Organoid dissociation reagents | Enable processing of 3D structures | $200-500/kit |
Diagram 2: Decision framework for 2D vs. 3D culture selection.
The cost-benefit analysis of 2D versus 3D cell culture systems reveals a nuanced landscape where initial cost advantages of 2D systems must be weighed against the long-term scientific and economic value of 3D technologies. While 2D culture remains appropriate for high-throughput applications, basic mechanistic studies, and resource-constrained environments, 3D culture systems offer superior biological relevance that translates to enhanced predictive power in drug development and disease modeling.
The most strategically sound approach for research organizations involves gradual integration of 3D capabilities aligned with specific research needs, leveraging the complementary strengths of both systems through hybrid workflows. As regulatory trends increasingly favor human-relevant models and the 3D cell culture market continues to innovate and mature, investments in 3D technologies represent not only a scientific advancement but also a strategic positioning for future research requirements. Laboratories that successfully implement balanced approaches to cell culture model selection will be best positioned to maximize both their scientific impact and resource utilization in an increasingly competitive research landscape.
The transition from traditional two-dimensional (2D) cell culture to three-dimensional (3D) models represents a paradigm shift in biomedical research, offering unprecedented ability to mimic complex tissue environments. Spheroids—simple clusters of broad-ranging cells that form through self-aggregation—and organoids—complex, organ-specific structures derived from stem cells that self-assemble with scaffolding—have emerged as powerful tools that bridge the gap between conventional cell culture and in vivo models [61] [62]. Unlike 2D cultures where cells grow in a single layer on flat surfaces, these 3D models recapitulate critical tissue-specific features including spatial architecture, biochemical gradients, and cell-ECM interactions [63] [3]. This enhanced biological relevance comes with significant standardization challenges that affect the reliability, reproducibility, and clinical translation of research findings.
The reproducibility crisis in 3D culture models stems from multiple technical variables that collectively introduce substantial experimental variability. While 2D cultures benefit from decades of protocol optimization and relatively uniform growth conditions, 3D models must account for complex, dynamic microenvironments where nutrient gradients, oxygen tension, and mechanical forces create heterogeneous cellular landscapes [63] [64]. This comprehensive analysis examines the key standardization hurdles in spheroid and organoid cultures, provides experimental data quantifying their impact, and outlines standardized methodologies to enhance reproducibility in preclinical research and drug development.
Comparative Analysis of Standardization Challenges
The standardization challenges affecting spheroids and organoids vary in nature and magnitude due to their fundamental biological differences. Spheroids, as simpler cellular aggregates, primarily face hurdles related to physical uniformity and culture conditions, while organoids encounter more complex challenges involving differentiation protocols and cellular complexity [61] [62]. The table below summarizes the key standardization challenges for both models, along with their impact on experimental outcomes.
Table 1: Standardization Challenges in Spheroid and Organoid Cultures
| Challenge Category | Impact on Spheroids | Impact on Organoids | Overall Effect on Reproducibility |
|---|---|---|---|
| Protocol Variability | High size and shape variation between batches [63] [65] | Inconsistent differentiation and cellular composition [66] [62] | Prevents direct comparison between experiments and laboratories |
| Culture Conditions | Significant differences in necrosis and viability based on oxygen and serum levels [63] | Altered maturation and tissue-specific function [66] [67] | Affects drug response accuracy and disease modeling reliability |
| Analytical Methods | Diameter-only measurements miss structural heterogeneity [65] | Complex internal structures require advanced imaging [61] [67] | Incomplete characterization leads to misinterpretation of results |
| Scalability | Relatively scalable but with consistency issues [64] | Limited scalability due to complexity and cost [66] [62] | Restricts high-throughput applications and large-scale screening |
| Microenvironment Control | Gradient formation affects cellular zones [64] | Incomplete recreation of tissue-specific niches [67] [62] | Reduces physiological relevance and predictive power |
Quantifying the Impact of Culture Conditions
Recent large-scale studies have systematically quantified how specific culture variables affect spheroid attributes. Analysis of 32,000 spheroid images revealed that oxygen tension significantly influences spheroid size and necrosis development, with spheroids cultured at 3% oxygen exhibiting reduced dimensions and increased necrotic cores compared to those under standard conditions [63]. Similarly, serum concentration in media critically regulates cell viability and structural integrity, with concentrations above 10% promoting dense spheroid formation with distinct necrotic and proliferative zones [63].
Table 2: Quantitative Impact of Culture Conditions on Spheroid Attributes
| Experimental Variable | Parameter Measured | Low Level | High Level | Impact on Spheroids |
|---|---|---|---|---|
| Oxygen Tension | Spheroid Size | 3% O₂ | 20% O₂ | ~25% reduction in diameter at 3% O₂ [63] |
| Necrosis | 3% O₂ | 20% O₂ | Significant increase in necrotic core at 3% O₂ [63] | |
| Serum Concentration | Viability | 0% FBS | 20% FBS | >60% increase in ATP content at 10-20% FBS [63] |
| Structural Integrity | 0% FBS | 20% FBS | Dense spheroids with distinct zones at ≥10% FBS [63] | |
| Initial Seeding Density | Size Uniformity | 2,000 cells | 6,000 cells | High variability in spheroid size at higher densities [63] |
| Sphericity | 2,000 cells | 6,000 cells | Progressive reduction in sphericity with increased density [63] |
For organoids, the challenges are even more complex. The extracellular matrix (ECM) composition significantly influences development, with Matrigel—the most commonly used matrix—exhibiting significant batch-to-batch variability in mechanical and biochemical properties [67]. This variability directly affects experimental reproducibility across different research groups and time points. Additionally, organoid cultures require specific growth factor cocktails that must be precisely optimized for different tissue types, introducing another layer of protocol variability [67] [62].
Experimental Protocols and Methodological Standardization
Standardized Spheroid Production Protocols
Multiple methods have been developed for spheroid generation, each with distinct advantages and standardization considerations:
Scaffold-free methods including forced-floating techniques and hanging drop methods are among the most commonly used approaches. In the hanging drop technique, cells are seeded in media droplets suspended from a surface, forcing them to aggregate into single spheroids per drop through gravity [61]. This method produces highly uniform spheroids but has limitations for high-throughput applications.
Low-attachment surfaces with specialized coatings prevent cell adhesion to vessel surfaces, promoting cell-cell adhesion and spheroid formation. These methods are particularly suitable for larger-scale production and have demonstrated excellent reproducibility across multiple cancer types, including breast, colon, and lung cancers [68] [64].
Scaffold-based methods utilize biocompatible materials such as synthetic hydrogels or ECM components to provide a 3D framework for spheroid formation. These approaches allow better control over mechanical properties but introduce additional variability through matrix batch differences [61].
The following workflow diagram illustrates a standardized spheroid culture and analysis process that incorporates recent advances in quality control:
Spheroid Culture and Analysis Workflow
Advanced Analytical Approaches for Quality Control
Traditional assessment of 3D cultures relying primarily on diameter measurements fails to capture critical structural heterogeneity. Recent advances incorporate biophysical characterization coupled with multivariate analysis to better quantify quality. The PCA-Biophysical Characterization (PCA-BC) method simultaneously measures spheroid mass density, diameter, and weight, enabling more comprehensive quality control [65].
This approach integrates Principal Component Analysis (PCA) and Hierarchical Cluster Analysis (HCA) to identify variability sources within and across spheroid populations. Studies demonstrate that PCA-BC can effectively discriminate between different cell lines based on biophysical characteristics and highlight inter-operator variability, making it particularly valuable for standardization efforts [65].
Table 3: Research Reagent Solutions for Standardized 3D Culture
| Reagent Category | Specific Examples | Function in 3D Culture | Standardization Considerations |
|---|---|---|---|
| Extracellular Matrices | Corning Matrigel matrix, collagen-based hydrogels, synthetic peptides | Provides structural support and biochemical cues for 3D organization [61] [67] | High batch-to-batch variability; requires pre-testing and validation [67] |
| Specialized Media | Gibco Organoid Media, defined growth factor cocktails | Supports stem cell maintenance and directed differentiation [68] [62] | Component consistency critical; serum-free formulations reduce variability [63] |
| Culture Surfaces | Nunclon Sphera plates, ultra-low attachment surfaces | Prevents cell adhesion, promotes 3D self-assembly [68] | Consistent surface properties essential between production lots |
| Assessment Kits | CellTiter-Glo 3D Cell Viability Assay, AlamarBlue | Enables viability measurement in 3D structures [65] | Optimized for penetration and detection in 3D models |
Technological Innovations Addressing Standardization Hurdles
Emerging Technologies for Enhanced Reproducibility
Several technological approaches show promise for addressing standardization challenges in 3D cultures:
Microfluidic and Organ-on-Chip Platforms: These systems provide precise control over the cellular microenvironment, including fluid flow, mechanical forces, and nutrient gradients. Integration of organoids with organ-chips combines their 3D structure with dynamic functionality, enhancing cellular differentiation and tissue functionality [66] [67]. These platforms enable co-culture with immune cells or microbes, allowing researchers to study complex interactions in diseases like inflammatory bowel disease or cancer immunotherapy [67].
Automation and AI-Driven Solutions: Automated systems for organoid and spheroid production reduce operator-dependent variability. A 2023 survey revealed that nearly 40% of scientists now rely on complex human-relevant models like organoids, with use expected to double by 2028 [66]. Solutions combining automation and AI successfully address reproducibility challenges by standardizing protocols and removing human bias from decision-making [66].
Advanced Characterization Methods: New biosensing approaches including optical coherence tomography and electrochemical biosensing enable non-destructive analysis of whole spheroids without sectioning or disaggregation [61]. These methods facilitate better quality control throughout culture duration rather than just at endpoint measurements.
The following diagram illustrates how these technologies integrate into a comprehensive standardization framework:
Technological Framework for Standardization
Future Directions and Concluding Remarks
The future of reproducible spheroid and organoid cultures lies in the integration of multiple technologies and approaches. Hybrid workflows that combine 2D cultures for initial screening with 3D models for prediction and organoids for personalization represent the most promising path forward [3]. The regulatory landscape is also evolving, with the FDA Modernization Act 2.0 empowering researchers to use innovative non-animal methods, including organoids, for drug development and toxicity testing [66].
Substantial efforts are underway to develop organoid cell atlases toward better standardization and validated, assay-ready models that have undergone rigorous testing and characterization [66]. These advances, combined with improved synthetic matrix materials that provide consistent chemical compositions and physical properties, will address the current batch-to-batch variability issues [67].
For researchers embarking on 3D culture models, a tiered approach is recommended: begin with 2D cultures for high-throughput screening, then validate hits using spheroids for their balance of physiological relevance and practicality, and finally employ organoids for personalized medicine applications where their enhanced complexity justifies the additional technical challenges [3]. By systematically addressing the standardization hurdles through technological innovation, methodological rigor, and quality control advances, the research community can fully unlock the potential of spheroids and organoids to transform drug development, disease modeling, and personalized medicine.
Analysis and Imaging Complexities in Thick 3D Structures
The transition from traditional two-dimensional (2D) cell culture to three-dimensional (3D) models represents a paradigm shift in biomedical research, particularly in drug discovery and cancer biology. While conventional 2D monolayers have served as a fundamental tool for decades, they lack the physiological relevance of the natural cell microenvironment [69]. In living tissues, cells exist in a complex three-dimensional architecture characterized by intricate cell-cell interactions and cell-extracellular matrix (ECM) connections that significantly influence cellular behavior, gene expression, and drug responses [16]. Thick 3D models, including spheroids and organoids, have emerged to bridge this gap, offering a more accurate platform for studying human biology and disease. However, this increased physiological relevance introduces substantial complexities in analysis and imaging, creating both opportunities and challenges for researchers seeking to extract meaningful data from these sophisticated models.
The fundamental challenge in analyzing thick 3D structures lies in their inherent complexity. Unlike monolayer cultures where all cells are equally accessible, 3D models develop internal architectural gradients including varying oxygen tension, nutrient availability, and metabolic waste accumulation [59] [14]. These models can better mimic in vivo conditions, including the heterogeneous cell populations and physical barriers found in human tissues, particularly solid tumors [70]. Consequently, while 3D cultures provide more predictive data for drug screening and disease modeling, they demand advanced methodological approaches for proper characterization and analysis, especially when it comes to imaging techniques capable of penetrating and resolving structures deep within these thick cellular assemblies.
Comparative Analysis: 2D versus 3D Cellular Models
Fundamental Differences in Cellular Characteristics
The biological differences between 2D and 3D culture systems manifest across multiple parameters, from basic morphology to therapeutic responses. Cells cultured in 2D monolayers typically exhibit flattened morphologies and altered polarity compared to their in vivo counterparts, while 3D cultures enable cells to assume more natural shapes and spatial organizations [69]. These structural differences drive significant functional consequences, including variations in gene expression profiles, cell signaling pathways, and drug resistance mechanisms [14].
Table 1: Key Characteristics of 2D versus 3D Cell Culture Models
| Parameter | 2D Culture System | 3D Culture System |
|---|---|---|
| Cell Morphology | Flattened, stretched morphology [69] | Natural, in vivo-like architecture [16] |
| Cell-Cell Interactions | Limited to peripheral contacts [59] | Complex, multi-directional interactions [16] |
| Proliferation Rate | Uniform, rapid proliferation [69] | Heterogeneous, location-dependent [69] |
| Gene Expression | Altered expression patterns [14] | In vivo-like expression profiles [14] |
| Drug Responses | Typically more sensitive [14] | Increased resistance, mimicking in vivo [14] |
| Nutrient/Gradient Access | Uniform [69] | Gradient-dependent (oxygen, nutrients, metabolites) [69] |
| Tissue-like Organization | Minimal [16] | High, with defined tissue architecture [16] |
Quantitative Experimental Comparisons
Empirical evidence demonstrates significant functional differences between 2D and 3D cultures that directly impact research outcomes, particularly in drug development. A comprehensive 2023 study comparing colorectal cancer models found that cells grown in 3D displayed significant differences (p < 0.01) in proliferation patterns, cell death profiles, and responsiveness to chemotherapeutic agents including 5-fluorouracil, cisplatin, and doxorubicin compared to 2D cultures [14]. Transcriptomic analysis revealed substantial dissimilarity (p-adj < 0.05) in gene expression profiles between the two systems, involving thousands of differentially expressed genes across multiple pathways [14].
Table 2: Experimental Data Comparison in Colorectal Cancer Models [14]
| Experimental Measure | 2D Culture Findings | 3D Culture Findings |
|---|---|---|
| Proliferation Pattern | Consistent exponential growth | Significant (p<0.01) difference in pattern over time |
| Apoptosis Profile | Standard death phase profile | Distinct apoptotic cascade |
| Drug Sensitivity | Higher sensitivity to chemotherapeutics | Increased resistance to 5-fluorouracil, cisplatin, doxorubicin |
| Methylation Pattern | Elevated methylation rate | Similar pattern to patient-derived FFPE samples |
| microRNA Expression | Altered expression profiles | Similar pattern to patient-derived FFPE samples |
| Transcriptomic Profile | Significant (p-adj<0.05) dissimilarity with thousands of differentially expressed genes | More representative of in vivo conditions |
These differences have profound implications for drug development. The failure rate of drugs that show promise in traditional 2D models is remarkably high, with approximately 90% of drugs that work in preclinical models, including conventional cell cultures, failing in human trials [70]. This staggering attrition rate underscores the critical need for more physiologically relevant models like 3D cultures that can better predict human responses.
Imaging Complexities in Thick 3D Structures
Technical Challenges in 3D Model Imaging
The imaging of thick 3D cellular structures presents unique challenges that distinguish it from conventional 2D microscopy. Light scattering and absorption phenomena significantly impede high-resolution imaging in thicker specimens, limiting the ability to resolve fine cellular details in deep tissue layers [71]. As 3D models increase in size and complexity, they develop internal optical barriers that restrict penetration of both light and chemical probes, creating technical hurdles for comprehensive visualization [59].
The structural complexity of 3D models further complicates imaging approaches. Larger spheroids (>500 μm diameter) develop physiological gradients that mimic the oxygen and nutrient zonation found in solid tumors, with proliferating cells at the periphery and quiescent or necrotic regions in the core [59]. This architectural heterogeneity demands imaging solutions capable of resolving not only individual cells but also their spatial relationships and functional status within the three-dimensional context. Additionally, the extracellular matrix components in scaffold-based 3D models can introduce optical aberrations and autofluorescence, further complicating image acquisition and analysis [59].
Advanced Imaging Modalities for 3D Structures
To overcome these challenges, researchers are employing sophisticated imaging technologies that enable visualization of thick 3D structures. Confocal fluorescence microscopy and its advanced modalities have emerged as powerful techniques that allow researchers to extract spatial and temporal information from entire 3D cellular assemblies [59]. These approaches can be combined with high-content screening and analysis to generate rich quantitative data about cellular processes and drug responses within 3D environments [59].
Emerging computational approaches are also advancing the field of 3D imaging. Recent innovations in dimensionality reduction techniques, particularly non-negative matrix factorization, have enabled scattering imaging using standard wide-field fluorescence microscopy with an expanded field of view [71]. However, these methods still face limitations in tissues exhibiting non-sparse structural features or strong background fluorescence, where decomposition can introduce artifacts and reduce quantitative accuracy [71]. For the most challenging imaging scenarios, techniques such as picosecond ultrasonics have shown promise for characterizing sub-optical-wavelength structures through optically opaque layers, though their application in biological systems remains limited [72].
Experimental Protocols for 3D Model Analysis
Standardized Spheroid Formation Protocol
The production of consistent, high-quality 3D models requires meticulous attention to methodology. For spheroid formation using scaffold-free approaches, researchers typically employ low-adhesion plates to encourage self-aggregation of cells. A representative protocol derived from published methodologies involves several critical steps [14]:
Cell Preparation: Harvest and resuspend cells at appropriate density in complete culture medium. For colorectal cancer cell lines, a concentration of 5 × 10³ cells per well in 200 μL of suspension has been successfully used [14].
Spheroid Formation: Transfer cell suspension into super-low attachment U-bottom 96-well microplates to promote spontaneous aggregation. The U-bottom geometry facilitates the consistent formation of single spheroids per well.
Culture Maintenance: Maintain spheroids in a controlled environment (37°C, 5% CO₂, humidified) with careful medium exchange. Protocol specifics include three consecutive 75% medium changes every 24 hours to maintain nutrient supply while minimizing disruption to developing spheroids [14].
Maturation Monitoring: Allow 72 hours for spheroid consolidation before experimental use, as 3D cultures typically require longer establishment periods compared to 2D systems [14].
This scaffold-free approach leverages inherent cellular tendencies to self-assemble, producing spheroids that maintain cell-cell contacts and natural morphology without artificial matrix influences. The reproducibility of this method makes it particularly suitable for drug screening applications where consistency across samples is paramount.
Advanced 3D Model Imaging Protocol
Imaging thick 3D structures requires optimized protocols to overcome light penetration limitations. A comprehensive approach combines appropriate instrumentation with sample preparation techniques:
Sample Preparation: For fluorescence imaging, ensure optimal penetration of staining reagents by allowing sufficient incubation time. For thicker structures (>500 μm), consider sectioning or clearing techniques to improve imaging depth.
Microscope Configuration: Utilize confocal microscopy systems with spectral detection capabilities to minimize background autofluorescence. Implement resonant scanners for rapid image acquisition to reduce photobleaching during Z-stack collection.
Image Acquisition Parameters:
- Set appropriate Z-step size (typically 1-5 μm depending on resolution requirements)
- Optimize laser power and detector gain to balance signal intensity with sample viability
- Implement tile scanning for larger specimens exceeding the microscope's field of view
Computational Processing: Apply deconvolution algorithms to improve resolution and contrast. For particularly challenging samples, advanced matrix factorization methods can help mitigate scattering artifacts [71].
This protocol emphasizes the importance of integrating both wet-lab and computational approaches to overcome the inherent challenges of 3D structure imaging, enabling researchers to extract meaningful biological information from these complex models.
The Scientist's Toolkit: Essential Research Reagents and Materials
Successful analysis of thick 3D structures requires specialized materials and reagents tailored to the unique demands of these complex models. The following table details essential components for establishing and analyzing 3D cellular systems:
Table 3: Essential Research Reagents and Materials for 3D Cell Culture Analysis
| Product Category | Specific Examples | Function and Application |
|---|---|---|
| Scaffold Materials | Matrigel, collagen, laminin, synthetic hydrogels [59] | Provides 3D extracellular matrix environment for cell growth and organization |
| Specialized Culture Vessels | Nunclon Sphera U-bottom plates, low-adhesion surfaces [14] | Enables scaffold-free spheroid formation by preventing cell attachment |
| Imaging Consumables | Glass-bottom dishes, chambered coverslips | Facilitates high-resolution microscopy with optimal optical properties |
| Viability Assays | CellTiter 96 AQueous Assay, fluorescent live/dead stains [14] | Assesses metabolic activity and cell viability within 3D structures |
| Apoptosis Detection Kits | FITC Annexin V/PI apoptosis detection [14] | Quantifies programmed cell death in response to therapeutic agents |
| Fluorescent Probes | CellTracker dyes, cytoplasmic membrane stains | Enables cell visualization and tracking within 3D environments |
| RNA Extraction Reagents | Column-based or TRIzol methods [14] | Isolves high-quality RNA for transcriptomic analysis of 3D models |
The selection of appropriate reagents significantly impacts the quality and reproducibility of 3D culture experiments. Natural ECM materials like Matrigel provide a biologically relevant microenvironment but can exhibit batch-to-batch variability that introduces experimental inconsistency [59]. Synthetic alternatives offer greater consistency but may lack the biological cues present in natural matrices. Similarly, the choice between scaffold-based and scaffold-free approaches depends on research objectives, with each system offering distinct advantages for specific applications.
The analysis and imaging of thick 3D cellular structures present significant but not insurmountable challenges for biomedical researchers. While technical hurdles related to light penetration, sample accessibility, and data interpretation complicate working with these models, continued methodological advancements are steadily overcoming these limitations. The investment in mastering these complexities yields substantial returns through improved predictive power in drug screening and disease modeling.
As the field progresses, standardization of protocols and analytical approaches will be critical for maximizing the potential of 3D culture systems. Current limitations in reproducibility and scalability represent important areas for development, particularly for high-throughput applications in drug discovery [16]. Nevertheless, the demonstrated ability of 3D models to better recapitulate in vivo responses confirms their value as intermediate systems between traditional 2D cultures and animal models. By embracing both the challenges and opportunities presented by thick 3D structures, researchers can accelerate the development of more effective therapeutics and advance our understanding of complex biological systems.
The transition from traditional two-dimensional (2D) to physiologically relevant three-dimensional (3D) cell culture models represents a paradigm shift in biomedical research. This evolution coincides with critical advances in cell sourcing, particularly the emergence of induced pluripotent stem cells (iPSCs) as a powerful alternative to primary cells. While primary cells are isolated directly from human or animal tissues and offer close physiological relevance, their use is constrained by limited lifespan, donor variability, and expansion challenges [8]. In contrast, iPSCs—somatic cells reprogrammed to an embryonic-like pluripotent state—provide an unlimited, ethically neutral source for deriving virtually any human cell type [73] [74].
The synergy between iPSC technology and 3D culture systems enables researchers to create sophisticated human disease models and screening platforms that more accurately mimic in vivo conditions. When selecting between primary cells and iPSCs for 3D microenvironments, researchers must consider multiple factors including experimental goals, required throughput, budget, and desired physiological relevance. This guide provides a detailed comparison of these cell sources to inform strategic decision-making for research and drug development applications.
Technical Comparison: Primary Cells vs. iPSCs in 3D Models
The table below summarizes the key characteristics of primary cells and iPSCs when used in 3D culture systems.
Table 1: Comprehensive Comparison of Primary Cells vs. iPSCs in 3D Microenvironments
| Parameter | Primary Cells | iPSCs |
|---|---|---|
| Source | Directly isolated from human or animal tissues [8] | Reprogrammed from somatic cells (e.g., skin fibroblasts, blood cells) [73] [74] |
| Expansion Capacity | Limited lifespan; senesce after few passages [8] | Virtually unlimited self-renewal capacity [73] |
| Donor Variability | High variability between donors [8] | Can be minimized using isogenic controls; enables patient-specific modeling [8] [73] |
| Physiological Relevance | High, when freshly isolated; retain native phenotype [8] | Dependent on differentiation efficiency; can mirror development [73] [75] |
| Genetic Manipulation | Challenging | Amenable to precise genetic engineering (e.g., CRISPR-Cas9) [73] [74] |
| Cost Considerations | High (especially for human primary cells) | Lower long-term cost due to expansion capability [8] |
| 3D Culture Compatibility | Can be challenging for some fragile types (e.g., primary human Kupffer cells) [8] | Generally robust in culture; can form complex organoids [8] [73] |
| Typical 3D Applications | Patient-derived organoids for personalized medicine [19] | Disease modeling, drug screening, developmental biology, cell therapy [73] [74] |
Experimental Evidence: Functional Outcomes in 3D Systems
Performance in Disease Modeling and Drug Screening
The functional differences between cell sources significantly impact experimental outcomes, particularly in pharmaceutical applications. iPSC-derived hepatocytes demonstrate superior performance in cytochrome P450 (CYP) metabolism studies compared to 2D cultures, with enzyme activity maintained for significantly longer periods in 3D formats [8]. Meanwhile, primary cell-derived organoids have proven invaluable in personalized oncology, with Memorial Sloan Kettering Cancer Center utilizing patient-derived organoids to match therapies for drug-resistant pancreatic cancer patients [3].
For infectious disease modeling, the NIH and Harvard have successfully employed iPSC-derived brain organoids to study Zika virus pathogenesis, demonstrating how iPSCs can model complex host-pathogen interactions in a human-relevant system [3]. The choice between primary and iPSC-derived models often depends on the specific application: primary cells may offer immediate physiological relevance, while iPSCs provide unprecedented opportunities for genetic manipulation and scale.
Quantitative Functional Assessment
Recent studies provide direct quantitative comparisons of cellular behavior in different culture systems. The table below summarizes key experimental findings that highlight performance differences.
Table 2: Experimental Data Comparison of Cellular Functions in Different Culture Systems
| Functional Assessment | 2D Culture Performance | 3D Culture Performance | Significance |
|---|---|---|---|
| Drug Sensitivity | Often overestimated [3] | More clinically predictive [3] [13] | Better translation to human responses |
| CYP450 Activity (Hepatocytes) | Declines rapidly (within days) [8] | Maintained for 4-6+ weeks [8] | More accurate drug metabolism data |
| Gene Expression Profiles | Artificial profiles due to forced polarity [13] | More physiologic, tissue-like patterns [3] [13] | Better disease modeling capabilities |
| Cell Proliferation Rates | Rapid, uniform proliferation [13] | Slower, heterogeneous proliferation [13] | Mimics in vivo tumor heterogeneity |
| Glucose Dependency (U251-MG cells) | Cannot survive beyond 3 days without glucose [13] | Survives and proliferates for 5+ days without glucose [13] | Enhanced resilience with alternative metabolic pathways |
| Metabolic Activity (Per Cell) | Lower glucose consumption [13] | Higher glucose consumption [13] | Fewer but more active cells in 3D |
Experimental Approaches: Methodologies for 3D Culture
The methodology for creating 3D models varies significantly based on cell source and research objectives. For iPSC-derived 3D models, the process typically begins with somatic cell reprogramming using Yamanaka factors (OCT4, SOX2, KLF4, MYC) or modifications thereof, followed by directed differentiation toward specific lineages using defined molecular cues [73]. These differentiated cells can then be assembled into 3D structures using various scaffolding techniques.
For primary cell-derived 3D models, the process often involves embedding freshly isolated cells within natural or synthetic hydrogels that mimic the extracellular matrix (ECM), allowing them to self-organize into tissue-like structures [76] [19]. Primary cells typically require optimized media formulations with specific growth factors to maintain viability and function in 3D cultures.
Advanced Protocol: Alternating 2D/3D Culture for Mesenchymal Stem Cells
A recent innovative approach demonstrates how hybrid culture systems can optimize cell properties. The alternating 2D/3D culture protocol for mesenchymal stem cells (MSCs) combines the expansion capacity of 2D culture with the functional enhancement of 3D spheroid formation [77].
Diagram 1: Alternating 2D/3D MSC Culture Workflow
This protocol leverages the advantages of both systems: 2D expansion enables scale-up, while periodic 3D spheroid culture reduces cell size, delays senescence, and enhances immunomodulatory function [77]. The methodology includes ECM supplementation and defined media to enhance viability, with scalable implementation using RGD-functionalized alginate hydrogel tubes (AlgTubes) for continuous culture transitions.
The Scientist's Toolkit: Essential Reagents and Materials
Successful implementation of 3D culture systems requires specialized reagents and materials tailored to the specific cell source and application.
Table 3: Essential Research Reagents for 3D Cell Culture Applications
| Reagent/Material | Function | Application Notes |
|---|---|---|
| Matrigel/ECM Hydrogels | Provides biomimetic scaffold for 3D growth; mimics native extracellular matrix [76] | Essential for organoid culture; composition varies by tissue type |
| Reprogramming Factors (OSKM) | Converts somatic cells to iPSCs (OCT4, SOX2, KLF4, MYC) [73] | Multiple delivery methods available: viral, mRNA, protein |
| Small Molecule Inhibitors/Activators | Directs differentiation toward specific lineages (e.g., CHIR99021, XAV939) [75] | Critical for patterning iPSCs into target cell types |
| Ultra-Low Attachment Plates | Prevents cell adhesion, enabling spheroid formation [3] [76] | Used for scaffold-free 3D culture |
| Defined Media Formulations | Supports specific cell types and maintains phenotype in 3D culture [77] | Often requires optimization for primary vs. iPSC-derived cells |
| Alginate Hydrogels (e.g., AlgTubes) | Synthetic scaffold for scalable 3D culture [77] | Enables dynamic culture transitions |
| Magnetic Nanoparticles | Facilitates magnetic levitation for 3D spheroid formation [3] [76] | Enables spatial control of cell aggregation |
Signaling Pathways in iPSC Differentiation and 3D Maturation
The successful integration of iPSCs into 3D microenvironments relies on precise control of developmental signaling pathways during differentiation and subsequent tissue maturation. The core pathways outlined below guide the acquisition of tissue-specific identity, particularly in complex 3D systems.
Diagram 2: iPSC Differentiation and 3D Maturation Pathways
This pathway illustrates how iPSCs from different mesodermal origins (cardiac and paraxial) converge toward similar mature endothelial cell fates when placed in appropriate 3D microenvironments [75]. The local tissue microenvironment ultimately dominates over developmental origin in establishing organ-specific EC identity, demonstrating the powerful influence of 3D context on cellular differentiation [75].
Strategic Implementation Guidelines
Decision Framework for Cell Source Selection
Choosing between primary cells and iPSCs requires careful consideration of research objectives and practical constraints:
Select Primary Cells When: Working with established co-culture systems where cell-cell interactions are well-defined; conducting short-term studies where donor variability is not a concern; when immediate physiological relevance is prioritized over scalability [8] [19].
Select iPSCs When: Long-term studies requiring extensive expansion; genetic manipulation is needed; patient-specific modeling is desired; working with difficult-to-isolate cell types (e.g., human neurons, cardiomyocytes) [8] [73] [74].
Emerging Trends and Future Outlook
The field is moving toward integrated approaches rather than exclusive use of one cell source. Hybrid workflows utilize 2D cultures for high-throughput screening followed by 3D models for lead validation, combining the strengths of both systems [8] [3]. The FDA Modernization Act 2.0 and proposed 3.0 are accelerating this transition by promoting human-relevant cell-based assays as alternatives to animal testing [8].
Future developments will likely focus on standardizing differentiation protocols, improving the reproducibility of 3D culture systems, and integrating advanced technologies like AI-driven analysis and organ-on-chip systems [3] [74]. As these technologies mature, the strategic selection of cell sources will continue to play a pivotal role in bridging the gap between in vitro models and human physiology.
Ensuring Nutrient and Oxygen Gradient Management for Tissue Viability
The management of nutrient and oxygen gradients represents a fundamental distinction between traditional two-dimensional (2D) and three-dimensional (3D) cell culture models. In 2D cultures, cells experience uniform access to oxygen and nutrients, an environment that poorly mimics physiological conditions [31]. In contrast, 3D models naturally develop physiologically relevant gradients that critically influence tissue viability, cellular behavior, and therapeutic responses [78] [13]. These gradients create microenvironments with distinct regions of proliferation, quiescence, and necrosis—mirroring the conditions observed in human tissues and solid tumors [13]. Understanding and controlling these parameters is therefore essential for researchers aiming to develop more predictive in vitro models for drug discovery and disease modeling.
Comparative Analysis of Gradient Formation in 2D vs. 3D Cultures
The architecture of cell culture models directly determines how nutrients and oxygen are distributed, which in turn governs cellular behavior and viability.
Gradient Formation and Microenvironment
In 2D cultures, cells grow as a monolayer on a flat surface, resulting in uniform exposure to oxygen and nutrients dissolved in the culture medium [31] [3]. This environment lacks the physical barriers that create microenvironments in living tissues. Consequently, all cells experience nearly identical conditions, which leads to aberrant cell morphology, loss of tissue-specific polarity, and altered metabolic states [31] [76].
In 3D cultures, cells grow in all three dimensions, forming structures like spheroids, organoids, or scaffold-embedded tissues. This arrangement creates diffusion-limited microenvironments [78]. As oxygen and nutrients diffuse from the periphery towards the core, and metabolic wastes diffuse outward, distinct concentric zones emerge:
- A proliferative zone on the periphery with ample oxygen and nutrients.
- A quiescent zone in the middle where cells are viable but less active.
- A necrotic core in the center, where diffusion limits are exceeded, and cells die [13].
Table 1: Fundamental Differences in Gradient Formation Between 2D and 3D Cultures
| Feature | 2D Culture | 3D Culture | Biological Implication |
|---|---|---|---|
| Oxygen/Nutrient Access | Uniform, unlimited [31] | Variable, diffusion-limited [31] [13] | 3D models mimic in vivo tissue access |
| Microenvironment | Single, homogeneous zone [3] | Multiple, heterogeneous zones (proliferative, quiescent, necrotic) [13] | 3D models recapitulate tissue/tumor architecture |
| Metabolic Waste Accumulation | Evenly dissipated [3] | Gradients of metabolites and pH form [78] [3] | 3D models experience in vivo-like metabolic stress |
| Physiological Relevance | Low; does not mimic natural tissue structure [31] | High; mimics physical and biochemical features of solid tissue/tumors [31] [13] | 3D models provide more predictive data for drug responses |
Impact on Cellular and Molecular Phenotypes
The differences in the physical microenvironment translate directly to significant functional consequences as shown in recent comparative studies.
Gene Expression and Metabolic Profiles: A 2023 transcriptomic study on colorectal cancer cell lines revealed significant dissimilarity in gene expression profiles between 2D and 3D cultures, with thousands of genes being up- or down-regulated [14]. A 2025 tumor-on-chip study demonstrated that 3D cultures exhibit distinct metabolic profiles, including elevated glutamine consumption under glucose restriction and higher lactate production, indicating an enhanced Warburg effect typical of in vivo tumors [13].
Drug Response: The same 2025 study found that cell proliferation is more glucose-dependent in 2D culture than in 3D, and 3D cultures showed reduced sensitivity to metabolic inhibitors [13]. The 2023 study confirmed that 3D cultured colorectal cancer cells showed different responsiveness to chemotherapeutics like 5-fluorouracil, cisplatin, and doxorubicin compared to their 2D counterparts [14].
Table 2: Experimental Outcomes Highlighting Functional Differences Driven by Gradients
| Experimental Parameter | Findings in 2D Culture | Findings in 3D Culture | Source |
|---|---|---|---|
| Proliferation Rate | High, exponential growth [13] | Reduced, limited by diffusion [13] | [13] |
| Glucose Dependence | High; proliferation stops upon glucose removal [13] | Moderate; alternative pathways allow survival [13] | [13] |
| Drug Sensitivity | Often overestimated [3] | More resistant; mimics in vivo tumor response [14] | [3] [14] |
| Gene Expression Profile | Altered; does not reflect in vivo state [31] | More in vivo-like; shares patterns with patient FFPE samples [14] | [31] [14] |
Key Experimental Protocols for Analyzing Gradients
Protocol 1: Microfluidic-Based Metabolic Monitoring
This protocol, adapted from a 2025 study, allows for quantitative, real-time comparison of metabolite consumption and production in 2D and 3D cultures [13].
Objective: To continuously monitor glucose, glutamine, and lactate levels in 2D and 3D cultures to uncover critical differences in metabolic patterns.
Methodology Details:
- Chip Fabrication: Use a microfluidic chip design that incorporates microbioreactors. For the 3D model, seed individual cells inside a collagen-based hydrogel that mimics the extracellular matrix (ECM) [13].
- Cell Culture: Maintain 2D cultures on flat plastic surfaces within the chip. For 3D cultures, allow cells to proliferate and self-organize into spheroids within the hydrogel over approximately 5 days (formation phase), followed by a tumor maintenance phase (up to 10 days) [13].
- Real-Time Monitoring: Use integrated sensors or off-line analysis (e.g., HPLC) to take daily measurements of metabolite concentrations (glucose, glutamine, lactate) directly from the microfluidic channels [13].
- Endpoint Analysis: At the end of the culture period, assess the number of metabolically active cells using a reagent like Alamar Blue [13].
Key Workflow Diagram:
Protocol 2: Finite Element Modeling (FEM) for Predicting Oxygen Gradients
This computational approach, highlighted in a 2021 review, simulates oxygen distribution within 3D cultures to optimize experimental settings before wet-lab work begins [78].
Objective: To predict oxygen profiles (partial pressure, pO₂) within 3D aggregates under various culture conditions to prevent core anoxia.
Methodology Details:
- Parameter Definition: Input key variables into the model: cell seeding density, aggregate dimensions, oxygen consumption rate (OCR) of the specific cell type, and culture system geometry (e.g., media height) [78].
- Model Execution: Run the FEM simulation to visualize oxygen distribution throughout the 3D structure. The model will predict steepness of gradients and identify potential anoxic regions [78].
- Culture Optimization: Use the simulation results to adjust critical parameters. For example, reduce media height in static cultures or switch to a gas-permeable culture device to improve oxygen supply to the cells [78].
- Experimental Validation: Culture the 3D aggregates under the optimized conditions predicted by the model and validate the oxygen levels using sensitive probes or hypoxia markers [78].
Key Workflow Diagram:
The Scientist's Toolkit: Essential Reagents and Materials
Successful gradient management requires specific tools and materials. The following table details key solutions for establishing and analyzing viable 3D culture models.
Table 3: Research Reagent Solutions for Gradient Management Studies
| Product/Technology | Primary Function | Application in Gradient Studies |
|---|---|---|
| Nunclon Sphera U-Bottom Plates [14] | Scaffold-free spheroid formation | Promotes self-assembly of 3D spheroids, enabling natural gradient formation in a standardized format. |
| Collagen-Based Hydrogel [13] | ECM-mimetic scaffold | Provides a 3D matrix for cell embedding and spheroid growth, mimicking the diffusion barriers of native tissue. |
| Matrigel [31] [76] | Natural ECM hydrogel | Facilitates formation of tissue-like structures with cell-ECM interactions that influence gradient-driven differentiation. |
| Gas-Permable Culture Devices [78] | Enhanced oxygen supply | Ameliorates anoxic core formation in static cultures by improving oxygen transfer, modeling physio-normal pO₂. |
| Microfluidic Chips [13] | Dynamic microenvironment control | Creates perfused microbioreactors for real-time metabolite monitoring and controlled gradient application. |
| Alamar Blue Cell Viability Reagent [13] [14] | Metabolic activity assay | Quantifies the number of metabolically active cells, reporting on the functional state of cells within gradient zones. |
| FITC Annexin V/Propidium Iodide Apoptosis Kit [14] | Apoptosis/Necrosis detection | Distinguishes live, early apoptotic, late apoptotic, and necrotic cells, mapping cell fate across gradients. |
The conscious management of nutrient and oxygen gradients is not merely a technical challenge in 3D cell culture; it is the central factor that unlocks its superior physiological relevance. The evidence is clear: the diffusion-limited microenvironments inherent to 3D models drive distinct gene expression, metabolic profiles, and drug responses that are absent in 2D cultures but paramount to predicting in vivo outcomes [13] [14]. Embracing techniques like finite element modeling for oxygen prediction and microfluidics for real-time metabolic monitoring provides researchers with the tools to actively design and control these gradients [78] [13]. As the field advances, mastering this aspect of 3D culture will be indispensable for developing more accurate disease models and achieving a higher success rate in the translation of therapeutics from the lab to the clinic.
Data-Driven Decisions: Validating Predictive Power and ROI
The choice between two-dimensional (2D) and three-dimensional (3D) cell culture models is a fundamental decision in biomedical research. This guide provides an objective, data-driven comparison of these platforms across cost, throughput, and physiological relevance to inform experimental design in drug discovery and disease modeling.
Key Parameters at a Glance
The table below summarizes the core differences between 2D and 3D cell culture systems based on current industry and research data.
| Parameter | 2D Cell Culture | 3D Cell Culture |
|---|---|---|
| Cost | Low initial and consumable costs [3] [8]. | Higher costs; requires specialized materials like hydrogels, microfluidic chips, and assay kits [3] [58]. |
| Throughput | Excellent for High-Throughput Screening (HTS); easily scalable to 384/1536-well plates [3] [8]. | Moderate to high throughput; scaffold-free spheroid systems are improving HTS compatibility, though generally more complex than 2D [58] [79]. |
| Physiological Relevance | Low; unnatural cell morphology, altered gene expression, and lack of tissue-like architecture [3] [13] [8]. | High; recapitulates native tissue morphology, cell-cell/matrix interactions, and generates physiological gradients (e.g., oxygen, nutrients) [3] [13] [80]. |
| Cell Morphology & Growth | Flat, spread-out growth on a rigid plastic surface [80]. | Tissue-like structures with natural cell polarity and organization [3] [80]. |
| Gene Expression Profile | Altered due to the unnatural physical environment, often not reflective of in vivo conditions [13] [80]. | Closer mimicry of in vivo gene expression, providing more translatable data for pathways like drug metabolism [3] [13]. |
| Drug Response | Often overestimates efficacy; lacks barriers to drug penetration like those in solid tumors [3] [80]. | More accurately predicts clinical efficacy and drug penetration, modeling resistance seen in patients [3] [13] [58]. |
| Primary Application | High-throughput compound screening, basic mechanistic studies, and genetic manipulations [3] [8]. | Disease modeling (especially cancer), toxicology, personalized medicine, and regenerative medicine [3] [58] [81]. |
Supporting Experimental Data and Protocols
Recent studies quantitatively highlight the impact of model choice on experimental outcomes.
Metabolic and Proliferation Differences in Cancer Models
A 2025 study in Scientific Reports directly compared 2D monolayers and 3D microfluidic tumor models using glioblastoma (U251-MG) and lung adenocarcinoma (A549) cell lines [13].
- Protocol: Cells in 3D were embedded in a collagen-based hydrogel within a microfluidic chip, while 2D cultures were grown traditionally. Proliferation and metabolic markers (glucose, glutamine, lactate) were monitored over 10 days (3D) and 5 days (2D) [13].
- Key Findings:
- Proliferation: Cell proliferation in 2D culture was highly dependent on glucose availability. In contrast, 3D cultures showed sustained proliferation even under glucose restriction, indicating a better ability to activate alternative survival pathways [13].
- Metabolism: 3D cultures exhibited distinct metabolic profiles, including higher per-cell glucose consumption and lactate production, indicating a more pronounced Warburg effect—a hallmark of cancer metabolism—compared to 2D cultures [13].
Chemotherapy Response in Ovarian Cancer Models
Research on high-grade serous ovarian cancer cells compared 2D and 3D culture responses to chemotherapy, underscoring differences in drug sensitivity [43].
- Protocol: 3D multicellular tumor spheroids (MCTS) were formed using ultra-low attachment (ULA) plates, a scaffold-free method, and treated with various anticancer drugs [43].
- Key Findings: The study confirmed that cells in 3D spheroids consistently showed reduced sensitivity to chemotherapy drugs compared to cells in 2D culture, more accurately modeling the drug resistance often observed in clinical settings [43].
Experimental Workflow and Decision Pathway
The following diagram illustrates a tiered experimental strategy that leverages the strengths of both 2D and 3D models, a workflow increasingly adopted by advanced labs [3] [81].
Tiered Cell Culture Strategy
The Scientist's Toolkit: Essential Research Reagents
Building robust 2D and 3D models requires specific materials and reagents. The table below details key solutions for establishing these cultures [58] [81] [80].
| Research Reagent | Function in Cell Culture |
|---|---|
| Ultra-Low Attachment (ULA) Plates | Prevents cell attachment, enabling scaffold-free spheroid formation via self-aggregation [43] [81]. |
| Hydrogels (e.g., Collagen, Matrigel) | Acts as a scaffold in 3D cultures, mimicking the natural extracellular matrix (ECM) to support 3D tissue structure [13] [58]. |
| Defined/Xeno-Free Media | Provides controlled, reproducible nutrient supply; reduces variability from animal-derived components [81]. |
| Microfluidic Chips | Creates precise, perfusable microenvironments for advanced models like organ-on-a-chip, allowing real-time analysis [13] [58]. |
| Bioinks | Used in 3D bioprinting to encapsulate cells and fabricate complex, spatially defined tissue constructs [58]. |
The evidence demonstrates that the choice between 2D and 3D cell culture is not a binary replacement but a strategic decision. A hybrid workflow that uses 2D for high-speed screening and 3D for predictive, physiologically relevant modeling is emerging as a powerful paradigm to enhance the translational potential of biomedical research [3] [81].
The high failure rate of cancer therapies in clinical trials, despite promising preclinical results, represents a significant challenge in drug development. A primary reason for this discrepancy lies in the inadequate predictive power of traditional two-dimensional (2D) cell culture models, which fail to recapitulate the complex physiology of human tumors [3]. This guide provides an objective comparison between 2D and three-dimensional (3D) cell culture models, focusing on their performance in predicting chemoresistance and drug toxicity. We present supporting experimental data to help researchers select the most appropriate model for their drug development workflows.
Three-dimensional models, including spheroids, organoids, and tumor-on-chip systems, incorporate critical tissue-like architecture, cell-cell interactions, and cell-extracellular matrix engagement that significantly influence drug penetration and cellular response [3] [13]. These models self-assemble into structures that create natural gradients of oxygen, pH, and nutrients, providing a more realistic environment for disease modeling and toxicological prediction [3]. The following sections present quantitative comparisons and case studies demonstrating the enhanced predictive fidelity of 3D model systems.
Physiological and Technical Comparison of 2D vs. 3D Culture Systems
Fundamental Differences in Microenvironment and Cellular Behavior
The architectural differences between 2D and 3D culture systems lead to significant variations in cellular behavior, gene expression, and drug sensitivity. The table below summarizes the key distinguishing characteristics:
Table 1: Fundamental Characteristics of 2D vs. 3D Cell Culture Models
| Feature | 2D Culture System | 3D Culture System |
|---|---|---|
| Growth Pattern | Monolayer; uniform expansion on flat surface | Multilayer; expansion in all directions [3] |
| Cell-Cell Interactions | Limited to peripheral contact in single plane | Extensive, omnidirectional interactions mimicking tissue architecture [3] [13] |
| Spatial Organization | None; artificially homogeneous | Structured with nutrient, oxygen, and pH gradients [3] [13] |
| Extracellular Matrix (ECM) | Minimal to no natural ECM interaction | Dynamic ECM engagement influencing signaling and behavior [3] |
| Proliferation Rates | Generally high and uniform | Heterogeneous; reduced in core regions [13] |
| Gene Expression Profiles | Often altered due to artificial substrate attachment | Better preservation of in vivo-like gene expression profiles [3] [13] |
| Drug Penetration | Immediate and uniform access to all cells | Limited, gradient-dependent diffusion mimicking in vivo barriers [3] |
Metabolic and Phenotypic Differences with Therapeutic Implications
Quantitative comparisons reveal significant metabolic differences between 2D and 3D cultures that directly impact drug response assessment. A 2025 tumor-on-chip study directly comparing 2D and 3D models demonstrated that 3D cultures showed distinct metabolic profiles, including elevated glutamine consumption under glucose restriction and higher lactate production, indicating an enhanced Warburg effect [13]. This metabolic reprogramming closely mirrors the behavior of in vivo tumors and contributes to differential drug sensitivities.
The same study revealed that 3D cultures exhibited increased per-cell glucose consumption, highlighting that these models contain fewer but more metabolically active cells compared to 2D cultures [13]. At the genetic level, gene expression analysis shows significant differences between 2D and 3D cultures, with genes involved in drug metabolism such as CYP2D6, CYP2E1, NNMT, and SLC28A1 being upregulated in 3D hepatocellular carcinoma models [13]. These differences fundamentally alter how cells in 3D cultures respond to therapeutic interventions.
Quantitative Comparison of Drug Response Prediction
Predictive Accuracy for Clinical Chemotherapy Response
Multiple recent studies have directly compared the predictive value of 2D and 3D models for clinical chemotherapy response. The following table summarizes key findings from comparative studies:
Table 2: Comparison of Drug Response Prediction Accuracy Between Models
| Cancer Type | Therapeutic Agent | 2D Model Correlation with Clinical Response | 3D Model Correlation with Clinical Response | Study Reference |
|---|---|---|---|---|
| Colon Cancer | 5-fluorouracil | Not directly reported | Hazard Ratio: 3.91 (95% CI: 1.54-9.39) [82] | PharmaFormer AI model [82] |
| Colon Cancer | Oxaliplatin | Not directly reported | Hazard Ratio: 4.49 (95% CI: 1.76-11.48) [82] | PharmaFormer AI model [82] |
| Bladder Cancer | Gemcitabine | Not directly reported | Hazard Ratio: 4.91 (95% CI: 1.18-20.49) [82] | PharmaFormer AI model [82] |
| Gastric Cancer | Clinical chemotherapies | Limited correlation | Significant correlation (p<0.05) with clinical outcomes [83] | 3D bioprinting study [83] |
| Ovarian Cancer | Platinum-based therapies | Often overestimates efficacy | Predicts clinical resistance accurately [84] | PDTO platform [84] |
A transformative approach combining 3D models with artificial intelligence has demonstrated remarkable improvements in prediction accuracy. The PharmaFormer model, which integrates transfer learning from 2D cell lines to 3D organoid data, showed substantially improved hazard ratios for predicting patient survival following specific chemotherapies [82]. For oxaliplatin in colon cancer, the model achieved a hazard ratio of 4.49, indicating strong predictive power for clinical outcomes.
Case Study: Metabolic Basis of Chemoresistance in Glioblastoma and Lung Adenocarcinoma
A 2025 microfluidic study directly compared 2D and 3D tumor models to investigate how tumor organization impacts metabolic patterns and chemoresistance [13]. The experimental protocol involved:
- Cell Lines: U251-MG human glioblastoma and A549 human lung adenocarcinoma
- Culture Conditions: 2D monolayers vs. 3D collagen-based hydrogel in microfluidic chips
- Glucose Conditions: High glucose (4.5 g/L), low glucose (1.0 g/L), and glucose deprivation
- Duration: 5 days for 2D cultures, 10 days for 3D cultures
- Measurements: Daily monitoring of proliferation, glucose consumption, glutamine consumption, and lactate production
The key findings demonstrated that cells in 3D models survived significantly longer under glucose deprivation compared to 2D cultures, indicating enhanced activation of alternative metabolic pathways that contribute to therapy resistance [13]. Specifically, 3D cultures showed elevated glutamine consumption under glucose restriction, illustrating metabolic flexibility that is not observed in 2D systems. This metabolic adaptation has direct implications for drug development, as it reveals potential resistance mechanisms that would be missed in traditional 2D screening.
Toxicity Prediction Fidelity: Comparative Analysis
AI-Enhanced Toxicity Prediction Across Platforms
Toxicity remains a major cause of drug candidate failure, accounting for approximately 30% of attrition in drug development [85]. Advanced AI models now leverage both 2D and 3D data to improve toxicity prediction, though significant differences exist in their predictive value:
Table 3: Toxicity Prediction Capabilities Across Experimental Platforms
| Platform | Data Sources | Prediction Strengths | Clinical Concordance Limitations |
|---|---|---|---|
| In Vitro 2D | MTT assays, CCK-8 tests, high-throughput screening [85] | Rapid compound screening, mechanistic studies | Limited concordance with human toxicity (species differences) [86] |
| In Vivo | Animal models, pharmacokinetic parameters [85] | Whole-organism effects, systemic toxicity | Species differences limit human extrapolation accuracy [85] |
| 3D Organoids | Patient-derived organoids, spheroids, tissue-like models [3] [16] | Tissue-specific toxicity, human-relevant biology | Limited systemic interaction modeling [16] |
| Clinical Data | FAERS, electronic medical records [85] | Human-relevant toxicity profiles | Retrospective only, not predictive for new compounds |
A 2023 multi-task deep learning study demonstrated that clinical toxicity predictions were significantly improved when models incorporated in vivo and in vitro data, but noted that toxicophore recovery captured more of the in vitro (53%) and in vivo (56%) endpoints than clinical endpoints (8%), highlighting the persistent translational gap [86]. This underscores the importance of using more physiologically relevant 3D models for toxicity assessment.
Case Study: Multi-Task Deep Learning for Clinical Toxicity Prediction
A comprehensive study published in 2023 developed a multi-task deep learning framework to simultaneously model in vitro, in vivo, and clinical toxicity data [86]. The experimental protocol included:
- Data Sources: Clinical toxicity (ClinTox dataset), 12 in vitro endpoints (Tox21 Challenge), and in vivo acute oral toxicity in mice (RTECS dataset)
- Molecular Representations: Morgan fingerprints and pre-trained SMILES embeddings
- Model Architectures: Single-task Deep Neural Networks (STDNN) vs. Multi-task Deep Neural Networks (MTDNN)
- Explanation Method: Contrastive Explanations Method (CEM) for identifying pertinent positive and negative features
The results demonstrated that multi-task models with SMILES embeddings showed superior performance in predicting clinical toxicity compared to existing benchmarks [86]. Furthermore, the study revealed that minimal in vivo data was needed for accurate clinical toxicity predictions when using transfer learning approaches, potentially reducing animal testing while maintaining predictive accuracy.
Advanced 3D Model Implementation: Protocols and Reagents
Experimental Workflow for 3D Drug Response Studies
The following diagram illustrates a typical integrated workflow for drug response studies using 3D models, combining experimental and computational approaches:
Essential Research Reagent Solutions for 3D Culture
Implementation of robust 3D culture systems requires specific reagents and materials. The following table details key solutions and their applications:
Table 4: Essential Research Reagents for 3D Cell Culture Models
| Reagent Category | Specific Examples | Function and Application |
|---|---|---|
| Scaffold Materials | Matrigel, Collagen-based hydrogels, GelMA, HAMA [83] [13] | Provide 3D extracellular matrix environment for cell growth and organization |
| Specialized Cultureware | Ultra-low attachment plates, Hanging drop plates [3] [43] | Promote spontaneous spheroid formation by preventing cell adhesion |
| Microfluidic Systems | Tumor-on-chip platforms [13] | Enable nutrient perfusion, gradient formation, and real-time monitoring |
| Cell Viability Assays | Alamar Blue, ATP-based assays [13] | Measure metabolic activity in 3D structures with better penetration |
| Imaging Tools | Confocal microscopy, Light sheet microscopy | Enable visualization of internal structure and spatial organization |
| Dissociation Reagents | Enzyme cocktails (collagenase, dispase) | Allow breakdown of 3D structures for cell retrieval and analysis |
Recent advances in bioink formulations have significantly improved 3D model fidelity. A 2025 gastric cancer study demonstrated that GelMA-HAMA hybrid hydrogels exhibited excellent biocompatibility and appropriate rheological properties for 3D bioprinting, maintaining viability over 85% while enabling the formation of patient-specific tissue architectures [83].
The comparative data presented in this guide demonstrates that 3D cell culture models provide superior predictive value for both chemoresistance and toxicity assessment compared to traditional 2D systems. The enhanced performance stems from better preservation of tissue architecture, physiological gradients, and natural cell-ECM interactions that significantly influence drug response.
However, 2D systems retain value for high-throughput preliminary screening and basic mechanistic studies due to their lower cost, simplicity, and compatibility with automated systems [3]. The most effective approach employs a tiered strategy: utilizing 2D models for initial high-throughput screening followed by 3D models for lead optimization and predictive assessment [3].
Emerging methodologies that combine 3D models with AI, such as the PharmaFormer platform, demonstrate that transfer learning from 2D to 3D data can dramatically improve clinical response prediction [82]. Similarly, multi-task deep learning frameworks that integrate in vitro, in vivo, and clinical toxicity data show promise for enhancing safety assessment while potentially reducing animal testing [86]. As these technologies continue to mature, they are poised to significantly improve the efficiency and success rate of the drug development pipeline.
The transition from two-dimensional (2D) to three-dimensional (3D) cell culture models represents a paradigm shift in biomedical research, particularly in the study of gene and protein expression profiles. While 2D cell culture—where cells grow as a single layer on flat plastic surfaces—has been a research cornerstone for decades, it imposes significant limitations on cellular behavior and molecular expression patterns [31] [87]. The recognition that cellular microenvironment profoundly influences fundamental biological processes has driven the adoption of 3D models that better recapitulate the architectural and biochemical complexity of native tissues [88].
In 3D cultures, cells establish more natural cell-cell and cell-extracellular matrix (ECM) interactions, develop physiologically relevant gradients of oxygen and nutrients, and maintain appropriate cell polarity and morphology [31] [41]. These conditions result in gene expression profiles and protein signatures that more closely mirror in vivo states compared to 2D systems. This comparative analysis examines the substantial differences in molecular expression between these culture platforms and their profound implications for cancer research, drug development, and predictive toxicology.
Physiological Differences Between 2D and 3D Microenvironments
The physical constraints and biochemical signaling possibilities of 2D versus 3D culture systems create fundamentally different microenvironments that dictate cellular behavior at the molecular level. In 2D monolayers, cells are forced into an artificial flattened state with disrupted polarity and uniform exposure to nutrients, oxygen, and signaling molecules [31] [87]. This environment fails to replicate the spatial organization and biochemical gradients present in living tissues and tumors.
In contrast, 3D culture systems enable the formation of natural gradients of oxygen, nutrients, and metabolic waste products that drive region-specific gene expression patterns [41] [3]. The restoration of proper cell-ECM interactions in 3D environments allows for appropriate mechanical signaling and tissue-specific organization that directly influences transcriptional and translational programs [31] [89]. These physiological differences underlie the distinct expression profiles observed between the two culture systems and explain why 3D models often demonstrate superior correlation with in vivo responses.
Table 1: Fundamental Microenvironmental Differences Between 2D and 3D Culture Systems
| Characteristic | 2D Culture | 3D Culture | Biological Impact |
|---|---|---|---|
| Spatial Organization | Monolayer; forced 2D expansion | Multi-layered; natural 3D organization | Alters cytoskeletal arrangement, nuclear shape, and mechanotransduction signaling |
| Cell-Cell Interactions | Limited to peripheral contact in single plane | Extensive; omnidirectional as in native tissue | Impacts differentiation, proliferation, and survival pathways through juxtacrine signaling |
| Cell-ECM Interactions | Single, unnatural attachment surface | Natural, bi-directional ECM engagement | Modulates integrin signaling, growth factor responses, and metabolic activity |
| Nutrient/Oxygen Gradients | Uniform access; no physiological gradients | Established concentration gradients as in tissues | Creates heterogeneous microenvironments influencing hypoxia-responsive genes |
| Cell Polarity | Disrupted apical-basal polarity | Appropriate polarization maintained | Affects protein trafficking, membrane receptor localization, and specialized cellular functions |
Comparative Analysis of Gene Expression Profiles
Transcriptomic Studies Reveal Widespread Differences
Comprehensive transcriptomic analyses demonstrate substantial differences in gene expression between 2D and 3D culture systems. A landmark study comparing five different colorectal cancer cell lines (Caco-2, HCT-116, LS174T, SW-480, and HCT-8) in 2D versus 3D cultures revealed significant dissimilarity in gene expression profiles involving thousands of differentially expressed genes for each cell line [14]. RNA sequencing with thorough bioinformatic analyses showed significant differential expression (p-adj < 0.05) across multiple pathways in 3D cultures compared to their 2D counterparts.
The gene expression patterns observed in 3D cultures more closely matched those found in patient-derived Formalin-Fixed Paraffin-Embedded (FFPE) tumor samples than 2D cultures [14]. Specifically, 3D cultures and FFPE samples shared similar methylation patterns and microRNA expression profiles, while 2D cells showed elevated methylation rates and altered microRNA expression—indicating that epigenetic regulation is also strongly influenced by culture conditions.
Pathway-Specific Expression Differences
The transcriptomic differences between culture systems are not random but reflect pathway-specific alterations that correspond to functional changes in cellular behavior. Studies comparing B16F10 murine melanoma and 4T1 murine breast cancer cells grown in 2D, 3D, and in vivo tumors revealed that 3D models gene transcripts are more similar to in vivo tumors than 2D monolayers [89]. The most significantly altered pathways include those involved in:
- ECM-receptor interactions: Upregulation of integrins, collagens, and laminins in 3D cultures
- Focal adhesion signaling: Enhanced expression of focal adhesion kinase (FAK) and related molecules
- Hypoxia-responsive pathways: Induction of HIF-1α signaling and downstream targets
- Metabolic reprogramming: Shift toward more physiological energy metabolism
- Drug resistance mechanisms: Increased expression of ABC transporters and survival pathways
These pathway-specific changes explain why 3D cultures often demonstrate increased resistance to chemotherapeutic agents compared to 2D cultures, better modeling the treatment response observed in clinical settings [89].
Diagram 1: Molecular Pathways Influenced by 3D Microenvironment. The 3D culture environment activates multiple signaling pathways through physiological gradients, proper ECM interactions, and enhanced cell-cell signaling, leading to altered expression of genes involved in key cellular processes.
Protein Expression and Functional Differences
Extracellular Vesicle Production and Composition
The functional consequences of differential gene expression extend to protein production and secretion, with significant implications for intercellular communication. Recent research on extracellular vesicle (EV) production demonstrates that 3D cell culture systems generate EVs with composition and functionality that more closely resemble in vivo vesicles than those produced by 2D cultures [90]. The yield, molecular cargo, and biological activity of EVs differ significantly between culture models, with 3D systems providing more physiologically relevant EV populations for studying disease mechanisms and developing diagnostic biomarkers.
Drug Response and Resistance Proteins
Protein expression analyses reveal substantial differences in key mediators of drug response between culture systems. Cells grown in 3D models show increased resistance to chemotherapeutic agents including 5-fluorouracil, cisplatin, and doxorubicin compared to 2D cultured cells [14] [89]. This resistance correlates with enhanced expression of proteins involved in:
- Drug efflux transporters: P-glycoprotein and other ABC transporters
- Anti-apoptotic proteins: Bcl-2 family members and IAP proteins
- DNA repair enzymes: Enhanced base excision and double-strand break repair machinery
- Receptor tyrosine kinases: Altered growth factor signaling networks
These protein expression differences explain why 3D cultures often better predict in vivo drug responses and why compounds showing efficacy in 2D screens frequently fail in clinical trials [3].
Table 2: Experimentally Documented Differences in Drug Response Between 2D and 3D Cultures
| Experimental Parameter | 2D Culture Response | 3D Culture Response | Study System | Reference |
|---|---|---|---|---|
| 5-Fluorouracil Sensitivity | Significant growth inhibition | Reduced efficacy | Colorectal cancer cell lines | [14] |
| Cisplatin Cytotoxicity | High sensitivity | Increased resistance | Murine melanoma and breast cancer models | [89] |
| Doxorubicin Response | Dose-dependent cell death | Attenuated effect with penetration limitations | Colorectal cancer cell lines | [14] |
| Dacarbazine Efficacy | Effective cytotoxicity | Reduced potency | B16F10 murine melanoma | [89] |
| Apoptosis Induction | Uniform early/late apoptotic populations | Heterogeneous response with resistant subpopulations | Flow cytometry analysis | [14] |
Experimental Protocols for Comparative Expression Analyses
3D Spheroid Formation and Maintenance
Protocol 1: Spheroid Formation Using Ultra-Low Attachment Plates
This method utilizes commercially available ultra-low attachment plates to promote spontaneous spheroid formation through the prevention of surface adhesion [14].
- Cell Preparation: Harvest exponentially growing cells using standard trypsinization procedures and resuspend in complete culture medium at appropriate density (typically 5 × 10³ to 1 × 10⁴ cells/mL depending on spheroid size requirements).
- Plate Seeding: Aliquot 200 μL of cell suspension into individual wells of Nunclon Sphera super-low attachment U-bottom 96-well microplates.
- Spheroid Formation: Centrifuge plates at 300 × g for 3 minutes to enhance cell aggregation at well bottoms.
- Culture Maintenance: Maintain spheroids in a humidified atmosphere of 5% CO₂ at 37°C with three consecutive 75% medium changes every 24 hours to remove debris and non-aggregated cells.
- Maturation Monitoring: Observe spheroid formation daily using brightfield microscopy; compact, spherical structures typically form within 3-7 days depending on cell type.
Protocol 2: ECM-Based 3D Culture Using Matrigel
This method uses basement membrane extracts to provide a scaffold for 3D growth that supports natural cell-ECM interactions [31] [41].
- Matrix Preparation: Throw Corning Matrigel matrix on ice overnight and pre-chill tips and tubes. Keep all components at 4°C during handling to prevent premature polymerization.
- Cell-Matrix Mixture: Trypsinize cells and resuspend in cold culture medium. Mix cell suspension with chilled Matrigel to achieve desired final density (typically 1-5 × 10⁴ cells/mL of Matrigel).
- Plating: Quickly aliquot cell-Matrigel mixture into pre-warmed culture plates (30-50 μL per well for 24-well plate) and distribute evenly without introducing bubbles.
- Polymerization: Incubate plates at 37°C for 30-45 minutes to allow complete Matrigel solidification.
- Culture Initiation: Gently overlay polymerized Matrigel with pre-warmed complete culture medium, being careful not to disrupt the gel matrix.
- Medium Changes: Carefully replace 70-80% of culture medium every 2-3 days without disturbing the embedded structures.
Gene Expression Analysis Workflow
Diagram 2: Gene Expression Analysis Workflow. Comparative transcriptomic analysis follows a standardized workflow from cell culture through RNA extraction, sequencing, bioinformatic analysis, and experimental validation.
Protocol 3: RNA Extraction from 3D Cultures
RNA isolation from 3D structures requires modifications to standard protocols to overcome diffusion barriers and matrix interactions [14].
- Sample Collection: For spheroids in ultra-low attachment plates, carefully transfer spheroids to microcentrifuge tubes using wide-bore pipette tips to prevent structural damage. For ECM-embedded cultures, carefully scrape matrix into collection tubes using chilled spatulas.
- Matrix Dissolution: For ECM-embedded cultures, add appropriate dissolution solution (e.g., Corning Cell Recovery Solution or dispase enzyme solution) and incubate at 4°C with gentle agitation for 30-60 minutes to liberate cellular structures without compromising RNA integrity.
- Centrifugation: Pellet released spheroids or organoids at 300 × g for 5 minutes at 4°C and carefully remove supernatant.
- Lysis: Resuspend 3D structures in appropriate lysis buffer supplemented with β-mercaptoethanol, and homogenize using mechanical disruption (vortexing with ceramic beads) or thorough pipetting.
- RNA Isolation: Proceed with standard RNA isolation protocols (commercial silica-membrane columns are typically compatible). Include DNase treatment step to eliminate genomic DNA contamination.
- Quality Assessment: Evaluate RNA integrity using microfluidic electrophoresis systems (e.g., Bioanalyzer); accept samples with RNA Integrity Number (RIN) > 8.0 for sequencing applications.
Essential Research Reagent Solutions for 2D-3D Comparative Studies
Table 3: Essential Research Reagents for 2D-3D Comparative Expression Studies
| Product Category | Specific Examples | Application in Comparative Studies | Key Features |
|---|---|---|---|
| Ultra-Low Attachment Plates | Nunclon Sphera U-bottom plates; Corning Ultra-Low Attachment surfaces | Spheroid formation without scaffolds; study of cell-cell interaction-driven expression | Covalently bonded hydrogel surface prevents protein absorption and cell attachment |
| Basement Membrane Matrix | Corning Matrigel Matrix; Cultrex Basement Membrane Extract | ECM-supported 3D culture; organoid establishment | Complex mixture of ECM proteins that mimics natural basement membrane composition |
| Synthetic Scaffolds | Polyhydroxybutyrate (PHB) membranes; electrospun nanofiber matrices | Defined composition 3D culture; reduced batch variability | Controlled pore size and topography; consistent mechanical properties |
| Tissue Dissociation Reagents | Corning Cell Recovery Solution; dispase enzyme solutions | Liberation of cells and structures from ECM without disrupting surface markers | Non-enzymatic or matrix-specific enzymatic release preserves protein integrity |
| Viability/Proliferation Assays | CellTiter 96 AQueous MTS Assay; ATP-based viability assays | Functional comparison of metabolic activity between 2D and 3D cultures | Specialized protocols for penetration and reduction potential in 3D structures |
| RNA Isolation Kits | Column-based kits with enhanced lysis capabilities | High-quality RNA extraction from compact 3D structures | Efficient disruption of dense cellular aggregates while maintaining RNA integrity |
The substantial differences in gene and protein expression profiles between 2D and 3D culture systems have profound implications for biomedical research and therapeutic development. The more physiologically relevant expression patterns observed in 3D cultures translate to improved predictive accuracy in drug screening and disease modeling [3] [26]. The research community is increasingly adopting a tiered approach that leverages the throughput of 2D systems for initial screening while relying on 3D models for validation and mechanistic studies [3].
Future directions include the integration of advanced 3D models with artificial intelligence and machine learning approaches to extract deeper insights from complex expression data [26]. Additionally, the development of standardized, reproducible 3D culture systems and analytical protocols will enhance cross-study comparisons and accelerate the adoption of these physiologically relevant models throughout biomedical research. As the field progresses, the recognition that cellular microenvironment dictates molecular expression patterns will continue to drive innovation in how we model human biology and disease in vitro.
The drug development process is notoriously time-intensive and expensive, with a low success rate in clinical trials acting as the primary driver of these costs. Approximately 90% of drugs that enter clinical trials fail to receive FDA approval, and at least 75% of these failures are due to insufficient efficacy or poor safety profiles that were not predicted by preclinical models [14] [91]. This high attrition rate dramatically impacts the time and financial investment required to bring a new therapy to market. A significant contributor to this problem has been the reliance on traditional two-dimensional (2D) cell cultures, which often fail to accurately simulate the complex human tissue microenvironment [18] [13]. This guide objectively compares the performance of 2D and 3D cell culture models, providing the quantitative data and experimental context needed to assess their impact on predicting clinical outcomes and reducing development costs.
Direct Comparison: 2D vs. 3D Cell Culture Models
The table below summarizes the fundamental differences between 2D and 3D culture systems that underlie their predictive capabilities.
Table 1: Fundamental Comparison of 2D and 3D Cell Culture Models
| Feature | 2D Cell Culture | 3D Cell Culture | Key References |
|---|---|---|---|
| In Vivo Imitation | Does not mimic natural tissue/tumor structure | In vivo tissues and organs exist in a 3D form | [31] |
| Cell Interactions | Deprived of natural cell-cell and cell-ECM interactions | Proper cell-cell and cell-ECM interactions; creates environmental "niches" | [31] [18] |
| Cell Morphology & Polarity | Altered morphology, loss of diverse phenotype and polarity | Preserved native morphology, cell division, and polarity | [31] |
| Access to Nutrients/Oxygen | Unlimited, homogeneous access | Variable, diffusion-limited access creating gradients (e.g., hypoxic cores) | [31] [3] |
| Gene Expression & Biochemistry | Altered gene expression, mRNA splicing, and topology | Expression profiles, splicing, and biochemistry more closely resemble in vivo conditions | [31] [14] |
| Drug Response | Often overestimates efficacy; lacks resistance mechanisms | Better predicts drug resistance and efficacy due to physiological barriers | [18] [3] [14] |
| Cost & Throughput | Inexpensive, simple, high-throughput compatible | More expensive, time-consuming, though high-throughput solutions are emerging | [31] [1] [3] |
Quantitative Evidence: Impact on Drug Efficacy and Resistance
Empirical data from direct comparisons reveals that 3D models consistently alter the assessment of a drug's potential. The following table compiles key findings from preclinical studies.
Table 2: Experimental Evidence of Differential Drug Responses in 2D vs. 3D Models
| Cell Line / Model | Therapeutic Agent | Key Finding in 3D vs. 2D | Implication for Drug Development | Reference |
|---|---|---|---|---|
| HCT-116 (Colon Cancer) | Melphalan, Fluorouracil, Oxaliplatin, Irinotecan | Increased resistance to chemotherapeutics | Mirrors chemoresistance observed in vivo, which 2D models fail to capture | [18] |
| Multiple CRC Cell Lines (Caco-2, HCT-116, etc.) | 5-Fluorouracil, Cisplatin, Doxorubicin | Significant (p<0.01) differences in responsiveness | 3D models provide a more accurate screening platform for oncology candidates | [14] |
| HepG2 (Liver Cells) | Cytotoxic compounds | Greater viability and reduced drug effects | Better predicts in vivo-like drug metabolism and toxicity, improving safety profiling | [76] |
| U251-MG (Glioblastoma) & A549 (Lung Adenocarcinoma) | Glucose restriction | Distinct metabolic profiles; survived longer under nutrient stress | Unveils critical metabolic dependencies and adaptations relevant for tumor targeting | [13] |
| General Solid Tumors | Various | Development of nutrient, oxygen, and pH gradients | Models the physical barriers that limit drug penetration in solid tumors, a major cause of clinical failure | [3] |
Experimental Protocols for Comparative Studies
To generate the comparative data shown above, researchers employ standardized protocols. Below are detailed methodologies for key experiments cited in this guide.
Protocol 1: Assessing Drug Response in Colorectal Cancer Models
This protocol is adapted from the 2023 Scientific Reports study comparing 2D and 3D colorectal cancer models [14].
Cell Culture:
- 2D Culture: Seed colorectal cancer cell lines (e.g., HCT-116, Caco-2) in standard 96-well plates at a density of 5x10³ cells/well and culture until 70-80% confluent.
- 3D Spheroid Culture: Seed the same cell lines at 5x10³ cells/well in Nunclon Sphera super-low attachment U-bottom 96-well microplates to promote spheroid formation.
Drug Treatment: After spheroids are formed (typically 3-7 days), treat both 2D and 3D cultures with a concentration range of therapeutics (e.g., 5-Fluorouracil, Doxorubicin). Include untreated controls.
Viability/Proliferation Assay:
- Use the CellTiter 96 Aqueous Non-Radioactive Cell Proliferation Assay (MTS assay).
- Add 20 µL of MTS/PMS mixture to each well containing 100 µL of culture medium.
- Incubate for 4 hours at 37°C.
- Measure the absorbance of the soluble formazan product at 490 nm using a plate reader.
Apoptosis Analysis:
- Harvest cells from both cultures using gentle trypsinization.
- Wash cells with HBSS and resuspend in Annexin-binding buffer.
- Stain cells with FITC-labeled Annexin V and Propidium Iodide (PI) for 15 minutes at room temperature.
- Analyze using a flow cytometer (e.g., FACSCalibur) to distinguish live, early apoptotic, late apoptotic, and dead cell populations.
Protocol 2: Metabolic Profiling in 2D vs. 3D Microfluidic Cultures
This protocol is based on the 2025 Scientific Reports study investigating tumor metabolism [13].
Model Setup:
- 2D Culture: Seed cells (e.g., U251-MG, A549) in standard culture plates or on-chip 2D chambers.
- 3D Culture: Embed individual cells in a collagen-based hydrogel within a microfluidic chip to mimic the ECM and allow self-organization into spheroids.
Experimental Conditions: Culture cells in media with different glucose concentrations (e.g., high, low, and no glucose). For 3D models, extend the culture time to capture both spheroid formation and growth/maintenance phases.
Continuous Monitoring:
- Proliferation: For 2D, monitor via daily image acquisition and cell counting. For 3D, quantify metabolically active cells using assays like Alamar Blue at regular intervals.
- Metabolite Measurement: Use the microfluidic platform to collect effluent daily. Quantify key metabolite concentrations (glucose, glutamine, lactate) using commercial assay kits (e.g., colorimetric or fluorometric).
Data Analysis: Calculate consumption/production rates per cell. Compare growth kinetics and metabolic patterns (e.g., Warburg effect, indicated by lactate production) between 2D and 3D models under different nutrient conditions.
Visualizing the Workflow and Key Pathways
The following diagrams illustrate the core experimental workflow and the critical biological pathway differentially regulated in 3D models.
Drug Testing Workflow from Culture to Analysis
Drug Resistance Pathways in 3D Microenvironments
The Scientist's Toolkit: Essential Reagents and Materials
The following table details key reagents and platforms essential for conducting robust 2D vs. 3D comparative studies.
Table 3: Key Research Reagent Solutions for 2D/3D Comparative Studies
| Item | Function/Application | Example Use Case |
|---|---|---|
| Ultra-Low Attachment (ULA) Plates | Promotes scaffold-free 3D spheroid formation by minimizing cell adhesion. | Generating multicellular tumor spheroids (MCTS) for high-throughput drug screening [31] [14]. |
| Extracellular Matrix (ECM) Hydrogels | Provides a scaffold that mimics the in vivo basement membrane for cell embedding and growth. | Matrigel is widely used for cultivating organoids and for invasion assays [31] [76]. |
| Hanging Drop Plates | Allows spheroid formation via self-aggregation in a gravity-driven droplet. | Creating uniform spheroids for co-culture studies, such as cardiac spheroids from iPSCs [18] [76]. |
| Microfluidic Chips (Organ-on-a-Chip) | Creates dynamic, perfused 3D cell culture models with fine control over the microenvironment. | Modeling vascularized tissue barriers, nutrient flow, and mechanical forces (e.g., shear stress) [1] [13]. |
| Cell Viability Assay Kits | Measures cell proliferation and metabolic activity in both 2D and 3D formats. | CellTiter 96 AQueous One (MTS) used to assess drug cytotoxicity [14]. |
| Apoptosis Detection Kits | Distinguishes between live, early apoptotic, and late apoptotic/dead cells via flow cytometry. | FITC Annexin V/PI staining to quantify mechanism of cell death post-treatment [14]. |
| Metabolite Assay Kits | Quantifies consumption of nutrients (glucose, glutamine) and production of waste (lactate). | Monitoring metabolic shifts and the Warburg effect in 2D vs. 3D cultures [13]. |
The body of evidence demonstrates that 3D cell culture models are not merely a technical upgrade but a strategic necessity for de-risking drug development. By more accurately recapitulating the in vivo tissue architecture, cellular interactions, and physiological gradients, 3D models provide superior predictivity of drug efficacy, safety, and resistance mechanisms. The experimental data shows that compounds which appear effective in simple 2D monolayers often fail in 3D models that mimic the in vivo tumor microenvironment, mirroring their subsequent failure in clinical trials.
Integrating 3D models into the preclinical workflow—using 2D for initial high-throughput screening and 3D for lead optimization and safety pharmacology—represents a pragmatic path forward. This tiered approach leverages the strengths of each system, enabling researchers to eliminate poorly performing candidates earlier and with greater confidence. As 3D technologies continue to advance in scalability and accessibility, their adoption is poised to bridge the critical gap between traditional in vitro assays and human trials, ultimately reducing the staggering attrition rate in clinical development and lowering the overall cost of bringing new drugs to patients.
In the relentless pursuit of new therapeutics, a stark reality persists: approximately 90% of drug candidates fail in clinical trials, despite promising preclinical data [92]. This costly attrition rate is frequently attributed to the limited predictive power of traditional preclinical models, particularly conventional two-dimensional (2D) cell cultures, which poorly mimic human physiology [13] [3]. However, the solution is not a wholesale replacement of one model for another. Instead, a new, more strategic paradigm is emerging—the hybrid workflow. This approach integrates the high-throughput screening capabilities of 2D cultures with the physiological relevance of three-dimensional (3D) models for validation. By leveraging the distinct advantages of each system, researchers can build a more efficient and predictive pipeline, accelerating the journey from discovery to clinically effective therapies. This guide explores the quantitative data, experimental protocols, and practical tools that underpin this powerful strategy.
Section 1: A Data-Driven Comparison of 2D and 3D Models
A growing body of evidence highlights critical functional differences between 2D and 3D cultures that directly impact drug discovery outcomes. The tables below summarize key comparative data.
Table 1: Proliferation and Metabolic Differences in 2D vs. 3D Cultures (based on U251-MG glioblastoma and A549 lung adenocarcinoma cells) [13]
| Parameter | 2D Culture Findings | 3D Culture Findings |
|---|---|---|
| Proliferation Rate | High, glucose-dependent; cells stop proliferating or die under glucose deprivation. | Reduced, less glucose-dependent; cells survive and proliferate longer under glucose deprivation. |
| Glucose Consumption per Cell | Lower | Increased, indicating fewer but more metabolically active cells. |
| Lactate Production | Lower | Higher, indicating an enhanced Warburg effect (aerobic glycolysis). |
| Response to Glucose Restriction | Proliferation stops. | Elevated glutamine consumption, indicating activation of alternative metabolic pathways. |
Table 2: Key Characteristics and Experimental Trade-offs [93] [3] [8]
| Characteristic | 2D Cell Culture | 3D Cell Culture |
|---|---|---|
| Physiological Relevance | Low; does not reflect in vivo tissue architecture or microenvironment. | High; better mimics cell-cell/matrix interactions, gradients, and tissue organization. |
| Drug Sensitivity | Often overestimated; exposed surface leads to high drug efficacy. | More accurate; mimics drug penetration barriers and tumor resistance. |
| Gene Expression Profile | Altered; does not faithfully represent in vivo gene expression. | More in vivo-like; shows fidelity in expression of genes related to drug metabolism and stemness. |
| Cost & Scalability | Low cost, highly scalable for High-Throughput Screening (HTS). | Higher cost, technically challenging to scale, though technologies are improving. |
| Protocol & Data Turnaround | Simple, well-established protocols; fast data turnaround. | Complex, requires expertise and specialized equipment; longer experimental timelines. |
| Imaging & Analysis | Simple and standardized. | Challenging; requires specialized microscopy, tissue clearing, or sectioning. |
Section 2: Experimental Protocols for a Tiered Workflow
The hybrid model strategically applies 2D and 3D systems at different stages of the research pipeline. The following diagram and protocols outline this integrated approach.
Protocol 1: High-Throughput Screening in 2D
This protocol is designed for the rapid, cost-effective screening of large compound libraries [3] [8].
- 1. Cell Seeding: Plate immortalized or primary cells (e.g., HepG2, HEK293) onto tissue culture-treated 96-well or 384-well microplates at a standardized density (e.g., 5,000-10,000 cells/well for a 96-well plate) [8].
- 2. Compound Addition: After a 24-hour adhesion period, treat cells with a library of small molecule compounds across a range of concentrations (e.g., 1 nM - 100 µM). Include controls (e.g., DMSO vehicle).
- 3. Incubation & Assay: Incubate for 24-72 hours. Assess cell viability using standardized, high-throughput compatible assays like the CellTiter 96 AQueous Non-Radioactive Cell Proliferation Assay (MTS) [3].
- 4. Data Analysis: Use plate readers and automated data analysis software to calculate IC50 values. Select the most potent and efficacious compounds (the "hits") for further validation.
Protocol 2: Physiological Validation in 3D Spheroids
This protocol uses scaffold-free spheroids to validate the hits from the 2D screen in a more physiologically relevant context [13] [12].
- 1. Spheroid Formation:
- Method A (Low-Attachment Plates): Seed cells (e.g., U251-MG or A549) in a 96-well round-bottom ultra-low attachment (ULA) plate. Centrifuge the plate (e.g., 500 x g for 5 minutes) to promote cell aggregation at the well bottom [12].
- Method B (Hanging Drop): Suspend cells in droplets (e.g., 20 µL) on the lid of a culture dish. Invert the lid; cells aggregate at the bottom of the droplet to form a single spheroid [12] [41].
- 2. Culture & Treatment: Culture spheroids for 3-5 days until compact, spherical structures form. Treat with the shortlisted hit compounds. Extend treatment duration compared to 2D to account for slower drug penetration.
- 3. Metabolic & Viability Analysis:
- Viability: Use assays like Alamar Blue to measure the number of metabolically active cells over time, which can reveal different growth kinetics and drug responses compared to 2D [13].
- Metabolite Monitoring: In a microfluidic chip setup, collect medium daily to monitor key metabolites like glucose, glutamine, and lactate via assays or biosensors, revealing critical differences in metabolic patterns [13].
- 4. Imaging: Fix spheroids, clear using agents like Corning 3D clear tissue clearing reagent or Visikol HISTO-M, and image using confocal microscopy to assess drug penetration and effects on the spheroid's internal architecture (e.g., hypoxic core) [41].
Section 3: The Molecular Basis for Integration - Signaling Pathways
The differential response to compounds in 2D versus 3D is rooted in fundamental changes in cellular signaling, driven by the microenvironment. The diagram below illustrates key pathways altered in 3D tumor spheroids.
Key Pathway Alterations in 3D Cultures: [13] [16]
- Gene Expression: 3D cultures show significant differences in gene expression compared to 2D. Key changes include upregulation of CD44 (involved in cell adhesion and migration), OCT4 and SOX2 (genes related to self-renewal and stemness), and downregulation of putative tumor suppressors like ANXA1 [13].
- Drug Metabolism: Genes involved in drug metabolism (e.g., CYP2D6, CYP2E1) can be upregulated in 3D cultures, leading to differential drug sensitivity [13].
- Metabolic Pathways: The spatial gradients of oxygen and nutrients in 3D spheroids create a heterogeneous microenvironment. This leads to a hypoxic core and an enhanced Warburg effect, where cells preferentially use glycolysis for energy production even in the presence of oxygen, as evidenced by higher lactate production [13].
Section 4: The Scientist's Toolkit: Essential Research Reagents & Materials
Successfully implementing a hybrid screening workflow requires specialized materials. The following table details key solutions.
Table 3: Essential Research Reagent Solutions for Hybrid 2D/3D Workflows
| Item | Function/Application | Specific Examples |
|---|---|---|
| Ultra-Low Attachment (ULA) Plates | Promotes scaffold-free 3D spheroid formation by inhibiting cell adhesion to the plastic surface. | Corning Spheroid Microplates, Millicell Microwell 96-well plates (for homogeneous organoid formation) [41]. |
| Hydrogels / ECM Scaffolds | Provides a biomimetic 3D scaffold that mimics the native extracellular matrix, supporting cell growth, signaling, and organization. | Corning Matrigel matrix (a natural hydrogel), synthetic PEG-based hydrogels (for higher consistency) [12] [41]. |
| Microfluidic Organ-on-a-Chip | Enables precise control of the cellular microenvironment, including fluid flow and nutrient gradients, for advanced 3D models. | Mimetas OrganoPlate, Emulate Inc. liver-on-chip [3] [1]. |
| Tissue Clearing Reagents | Renders 3D tissues transparent for deep, section-less imaging using confocal or light-sheet microscopy. | Visikol HISTO-M, Corning 3D clear tissue clearing reagent [41]. |
| Viability & Metabolic Assays | Quantifies cell health, proliferation, and metabolic activity in both 2D and 3D formats. | CellTiter 96 AQueous Assay (MTS) for 2D HTS, Alamar Blue for 3D metabolic activity [13] [3]. |
| 3D Bioprinter | Allows for the precise spatial patterning of cells and biomaterials to create complex, multi-cellular tissue constructs. | Corning Matribot (optimized for handling Matrigel) [41]. |
The choice between 2D and 3D cell culture is no longer a binary one. The future of efficient and predictive preclinical research lies in a hybrid, tiered workflow that leverages the unique strengths of each model. By using 2D cultures as a powerful filter for high-volume screening and 3D models as a rigorous validator of physiological relevance, researchers can de-risk the drug development pipeline. This strategy, further enhanced by patient-derived organoids for personalization, allows for more informed decisions earlier in the process. As technologies advance and costs decrease, this integrated approach will become the standard, bridging the long-standing gap between in vitro results and clinical success, and ultimately delivering better therapies to patients faster.
Conclusion
The choice between 2D and 3D cell culture is not a binary one but a strategic decision based on research goals. While 2D remains valuable for high-throughput screening and basic mechanistic studies, 3D models offer unparalleled physiological relevance that is critical for predictive drug discovery and complex disease modeling. The future lies in hybrid workflows that intelligently combine the speed of 2D with the realism of 3D, augmented by AI-driven analytics and standardized protocols. As regulatory bodies increasingly accept 3D data, the widespread adoption of these advanced models promises to reduce reliance on animal testing, lower attrition rates in clinical trials, and ultimately accelerate the development of more effective, safer therapeutics.
References
- 1. 2D Versus 3D Cell Cultures: Advantages and Disadvantages [https://www.mimetas.com/en/blogs/315/2d-versus-3d-cell-cultures-advantages-and-disadvantages.html]
- 2. 2D vs 3D Cell Culture: Advantages, Limitations, and Lab ... [https://www.astorscientific.us/blogs/news/2d-vs-3d-cell-culture?srsltid=AfmBOoqMmtbkRch5pS4inNnerlwoEFll314SvFakE5Zy_k2zWWh0JKoT]
- 3. 3D vs 2D Cell Culture: Which Model Suits Your Lab in 2025? [https://www.pharmanow.live/knowledge-hub/research/3d-vs-2d-cell-culture-comparison]
- 4. Modeling Physiological Events in 2D vs. 3D Cell Culture [https://pmc.ncbi.nlm.nih.gov/articles/PMC5545611/]
- 5. Cell Culture: Key Insights and Advantages 3 D vs 2 D [https://www.mimetas.com/resources/3d-cell-culture-vs-traditional-2d-cell-culture-explained]
- 6. A comparison of human skeletal muscle cell maturation in 2 ... D versus [https://pubmed.ncbi.nlm.nih.gov/40515433/]
- 7. Comparative analysis of 3D-culture techniques for ... [https://www.nature.com/articles/s41598-025-13588-x]
- 8. 2D vs 3D Cell Culture: Choosing the Right Model [https://www.tempobioscience.com/2d-vs-3d-cell-culture-choosing-the-right-model-by-tempo-bioscience/]
- 9. From monolayer to spheroid: assessing influenza a virus infection in... [https://virologyj.biomedcentral.com/articles/10.1186/s12985-025-02939-9]
- 10. and three‑dimensional culture systems in tumor models ... [https://www.spandidos-publications.com/10.3892/ijmm.2025.5626?text=fulltext]
- 11. Mimicking the Complexity of Solid Tumors: How Spheroids ... [https://pmc.ncbi.nlm.nih.gov/articles/PMC11987746/]
- 12. 3D Cell Culture Methods and Applications [https://elveflow.com/microfluidic-reviews/3d-cell-culture-methods-and-applications-a-short-review/]
- 13. 2D versus 3D tumor-on-chip models to study the impact of ... [https://www.nature.com/articles/s41598-025-03504-8]
- 14. Comparative analysis between 2D and 3D colorectal ... [https://www.nature.com/articles/s41598-023-45144-w]
- 15. 3D tumor cultures for drug resistance and screening ... [https://molecular-cancer.biomedcentral.com/articles/10.1186/s12943-025-02281-2]
- 16. Three-Dimensional Culture System: A New Frontier in ... [https://pmc.ncbi.nlm.nih.gov/articles/PMC12292892/]
- 17. Three-dimensional cell culture in vitro could better ... [https://www.sciencedirect.com/science/article/abs/pii/S0040816625005282]
- 18. Three-Dimensional Cell Cultures in Drug Discovery and ... [https://pmc.ncbi.nlm.nih.gov/articles/PMC5448717/]
- 19. Bridging the gap: the role of 3D cell cultures in mimicking ... [https://pmc.ncbi.nlm.nih.gov/articles/PMC12378905/]
- 20. Breaking the mold: 3D cell cultures reshaping the future of ... [https://www.frontiersin.org/journals/cell-and-developmental-biology/articles/10.3389/fcell.2024.1507388/full]
- 21. Three-Dimensional in Vitro Cell Culture Models in Drug ... [https://www.frontiersin.org/journals/pharmacology/articles/10.3389/fphar.2018.00006/full]
- 22. Accelerating drug development with 3D neural models [https://www.nature.com/articles/d41586-023-01646-1]
- 23. Advances in tumor microenvironment: Applications and ... [https://www.sciencedirect.com/science/article/pii/S0006291X24008751]
- 24. A Comprehensive Review on 3D Tissue Models [https://pmc.ncbi.nlm.nih.gov/articles/PMC10843844/]
- 25. Three-dimensional in vitro culture models in oncology research [https://cellandbioscience.biomedcentral.com/articles/10.1186/s13578-022-00887-3]
- 26. Leveraging 3D cell culture and AI technologies for next- ... [https://www.sciencedirect.com/science/article/pii/S3050562325000418]
- 27. 3D Cell Culture Applications: Advancing Biological Research [https://cellculturecompany.com/3d-cell-culture-applications-advancing-biological-research/]
- 28. A Brief History of Cell Culture: From Harrison to Organs-on- ... [https://www.mdpi.com/2073-4409/13/24/2068]
- 29. In Vitro three-dimensional (3D) cell culture tools for ... [https://www.sciencedirect.com/science/article/pii/S247255522300028X]
- 30. 3D Organoids vs 2D Cell Lines in Drug Discovery & ... [https://www.moleculardevices.com/lab-notes/3d-biology/3d-organoids-vs-2d-cell-lines-drug-discovery]
- 31. 2D and 3D cell cultures – a comparison of different types of ... [https://pmc.ncbi.nlm.nih.gov/articles/PMC6040128/]
- 32. Hydrogel scaffolds for tissue engineering: Progress and ... [https://pmc.ncbi.nlm.nih.gov/articles/PMC3963751/]
- 33. A Comparative Review of Natural and Synthetic ... [https://www.mdpi.com/2073-4360/13/7/1105]
- 34. Review Multifunctional hydrogel scaffolds based on ... [https://www.sciencedirect.com/science/article/abs/pii/S0141813024102292]
- 35. Magnetic hydrogel scaffold based on hyaluronic acid ... [https://www.nature.com/articles/s41598-024-78696-6]
- 36. Comparative Analysis of 3D Culture Methodologies in ... [https://pubmed.ncbi.nlm.nih.gov/40609728/]
- 37. Design of 3D smart scaffolds using natural, synthetic and ... [https://www.sciencedirect.com/science/article/pii/S2590183422000473]
- 38. Three-Dimensional Cell Culture Systems and Their ... [https://pmc.ncbi.nlm.nih.gov/articles/PMC4026212/]
- 39. Scaffold-free 3D culture systems for stem cell-based tissue ... [https://pmc.ncbi.nlm.nih.gov/articles/PMC11446583/]
- 40. An Overview on Spheroid and Organoid Models in Applied ... [https://www.mdpi.com/2413-4155/7/1/27]
- 41. 2D vs 3D Cell Cultures [https://fluorofinder.com/2d-vs-3d-cell-cultures/]
- 42. Generation and Cultivation of 3D Cell Models [https://ibidi.com/content/1037-generation-and-cultivation-of-3d-cell-models]
- 43. Comparison of two-dimensional and three- ... [https://www.sciencedirect.com/science/article/pii/S2405580824002024]
- 44. Comparison of three-dimensional cell culture techniques ... [https://www.frontiersin.org/journals/cell-and-developmental-biology/articles/10.3389/fcell.2024.1362696/full]
- 45. Exploring Organ-on-a-Chip Technology: A comprehensive ... [https://elveflow.com/microfluidic-reviews/exploring-organ-on-a-chip-technology-a-comprehensive-review/]
- 46. Organoids VS Organ-on-a-chip: A Comparative Review ... [https://elveflow.com/microfluidic-reviews/organoids-vs-organ-on-a-chip/]
- 47. Advances in 3D Bioprinting and Microfluidics for Organ-on- ... [https://www.mdpi.com/2073-4360/17/22/3078]
- 48. State-of-the-Art Organ-on-Chip Models and Designs ... [https://pmc.ncbi.nlm.nih.gov/articles/PMC12383757/]
- 49. 3D Cell Culture and Organ-on-a-chip Analysis 2025 ... [https://www.archivemarketresearch.com/reports/3d-cell-culture-and-organ-on-a-chip-782466]
- 50. Role of in vitro two-dimensional (2D) and ... - PubMed Central [https://pmc.ncbi.nlm.nih.gov/articles/PMC9909725/]
- 51. Why you should use 3D cell models for high throughput ... [https://www.revvity.com/blog/why-you-should-use-3d-cell-models-high-throughput-screening]
- 52. 3D cell cultures toward quantitative high-throughput drug ... [https://pubmed.ncbi.nlm.nih.gov/35504760/]
- 53. Modeling the future [https://www.roche.com/stories/modeling-the-future]
- 54. Expanding the Frontiers of Human Biology with Organ-on-a ... [https://emulatebio.com/expanding-the-frontiers-of-human-biology-with-organ-on-a-chip-technology-highlights-from-the-2025-mps-world-summit/]
- 55. Establishment and large-scale validation of a three ... [https://pmc.ncbi.nlm.nih.gov/articles/PMC9596801/]
- 56. 2D versus 3D tumor-on-chip models to study the impact of ... [https://pubmed.ncbi.nlm.nih.gov/40461567/]
- 57. 2D vs 3D Cell Culture: Advantages, Limitations, and Lab ... [https://www.astorscientific.us/blogs/news/2d-vs-3d-cell-culture?srsltid=AfmBOopLzTHCVP4Qh9zz-_JNHQ46ljApAypyqB4R6AIanqYOmUnlSWmf]
- 58. 3d Cell Culture Market: Comprehensive Analysis and ... [https://www.pharmiweb.com/press-release/2025-02-12/3d-cell-culture-market-comprehensive-analysis-and-forecast-2025-2035]
- 59. Harnessing 3D cell models and high-resolution imaging to ... [https://pmc.ncbi.nlm.nih.gov/articles/PMC12277333/]
- 60. 3D vs 2D Cell Culture: A Comprehensive Comparison and ... [https://cellculturecollective.com/blog/3d-cell-culture-vs-2d-cell-culture/?srsltid=AfmBOor8QETD8YkhckD1hYAAH0iCFS4RioiPKzF6fXhZ-6xL3Aw9d-Ml]
- 61. Spheroid vs. Organoid: What's the Difference and Definition? [https://www.corning.com/worldwide/en/products/life-sciences/resources/stories/at-the-bench/organoid-vs-spheroid-what-is-the-difference.html]
- 62. Organoid and Spheroid Tumor Models - PubMed Central - NIH [https://pmc.ncbi.nlm.nih.gov/articles/PMC7922036/]
- 63. Influence of experimental variables on spheroid attributes | Scientific Reports [https://www.nature.com/articles/s41598-025-92037-1]
- 64. Unlocking the Potential of Spheroids in Personalized Medicine: A Systematic Review of Seeding Methodologies [https://www.mdpi.com/1422-0067/26/13/6478]
- 65. Redefine tumor spheroids heterogeneity via PCA-coupled biophysical characterization | Scientific Reports [https://www.nature.com/articles/s41598-025-19557-8]
- 66. 2025 Trends: Organoids [https://www.genengnews.com/topics/genome-editing/2025-trends-organoids/]
- 67. Breakthroughs and challenges of organoid models for ... [https://www.nature.com/articles/s41420-025-02505-w]
- 68. 3D Cell Culture Protocols [https://www.thermofisher.com/us/en/home/references/protocols/cell-culture/3-d-cell-culture-protocol.html]
- 69. Role of three-dimensional cell culture in therapeutics and ... [https://pmc.ncbi.nlm.nih.gov/articles/PMC10042111/]
- 70. 3D cell culture: market and industrial needs [https://elveflow.com/microfluidic-reviews/3d-cell-culture-market-industrial-needs/]
- 71. Fluorescence microscopy through scattering media with ... [https://www.sciencedirect.com/science/article/pii/S2667237525000670]
- 72. Characterization of Sub-Optical-Wavelength Structures ... [https://pmc.ncbi.nlm.nih.gov/articles/PMC12142679/]
- 73. Induced pluripotent stem cells (iPSCs) [https://www.nature.com/articles/s41392-024-01809-0]
- 74. Induced Pluripotent Stem Cell (iPSC) Industry Trends for ... [https://bioinformant.com/ipsc-industry-trends/]
- 75. Tissue microenvironment dictates the state of human iPSC ... [https://pmc.ncbi.nlm.nih.gov/articles/PMC12546991/]
- 76. Is It Time to Start Transitioning From 2D to 3D Cell Culture? [https://www.frontiersin.org/journals/molecular-biosciences/articles/10.3389/fmolb.2020.00033/full]
- 77. Alternating 2D and 3D culture reduces cell size and extends ... [https://pmc.ncbi.nlm.nih.gov/articles/PMC12411557/]
- 78. The Importance of Proper Oxygenation in 3D Culture - PMC [https://pmc.ncbi.nlm.nih.gov/articles/PMC8042214/]
- 79. The Model of Excellence in 3D Cell Culture: Scalable ... [https://insphero.com/3d-cell-culture-model-of-excellence/]
- 80. 3D vs 2D Cell Culture: A Comprehensive Comparison and ... [https://cellculturecollective.com/blog/3d-cell-culture-vs-2d-cell-culture/?srsltid=AfmBOookC-S8KWUKCzP1epUGc3ZPCqlk3omrTN1mIPpf2dULy62aRrBL]
- 81. Exploring Cancer Cell Culture in 2025: Emerging Models ... [https://cellculturecompany.com/exploring-cancer-cell-culture-advances-and-applications/]
- 82. PharmaFormer predicts clinical drug responses through ... [https://www.nature.com/articles/s41698-025-01082-6]
- 83. Exploring personalized prediction of clinical chemotherapy ... [https://pmc.ncbi.nlm.nih.gov/articles/PMC12522304/]
- 84. Longitudinal prediction of drug response in high-grade ... [https://www.sciencedirect.com/science/article/pii/S2090123225005983]
- 85. Artificial Intelligence-Driven Drug Toxicity Prediction [https://pmc.ncbi.nlm.nih.gov/articles/PMC12299075/]
- 86. Accurate clinical toxicity prediction using multi-task deep ... [https://www.nature.com/articles/s41598-023-31169-8]
- 87. A Century of Cell Culture And The Rise of Organ-Chips [https://emulatebio.com/2d-vs-3d-cell-culture-models/]
- 88. Advancing cancer research through 3D cell culture models [https://www.excli.de/excli/article/view/8563]
- 89. Comparison of 2D and 3D cell culture models for ... [https://www.sciencedirect.com/science/article/abs/pii/S0928493119305934]
- 90. improving physiological relevance and yield with 3D cell ... [https://pubs.rsc.org/en/content/articlelanding/2025/nr/d5nr00707k]
- 91. A comprehensive review on 3D tissue models [https://www.sciencedirect.com/science/article/abs/pii/S0142961223004167]
- 92. 3D bioprinting innovations: a new frontier in breast cancer ... [https://pubmed.ncbi.nlm.nih.gov/41249752/]
- 93. and 2 D 3 D Cell Culture Comparison [https://www.news-medical.net/life-sciences/2D-and-3D-Cell-Culture-Comparison.aspx]