Accelerated Timelines: Strategies for Rapid and High-Quality Stable Cell Pool Selection
This article provides a comprehensive guide for researchers and drug development professionals seeking to compress cell line development timelines.
Accelerated Timelines: Strategies for Rapid and High-Quality Stable Cell Pool Selection
Abstract
This article provides a comprehensive guide for researchers and drug development professionals seeking to compress cell line development timelines. It explores the inherent bottlenecks of traditional stable cell pool generation and presents cutting-edge high-throughput, automated platforms that can reduce selection timelines from several months to mere weeks. Covering foundational principles, practical methodologies, common troubleshooting scenarios, and rigorous validation techniques, the content synthesizes recent case studies and technological innovations. The strategies discussed are critical for meeting the demands of developing complex biologics, such as bispecific antibodies, and accelerating the pace from discovery to clinical manufacturing.
Understanding Stable Cell Pool Bottlenecks and Economic Drivers
The Critical Role of CHO Cells in Biologics Production and Inherent Workflow Delays
Chinese Hamster Ovary (CHO) cells are the primary host system for biopharmaceutical production, used to manufacture a wide range of therapeutics, including monoclonal antibodies, recombinant proteins, and viral vectors [1] [2] [3]. Their ability to perform human-like post-translational modifications, grow in serum-free suspension cultures, and maintain relative safety from human pathogenic viruses makes them indispensable in the industry [3].
However, the development of high-producing, stable clonal cell lines is a major bottleneck. Traditional processes are labor-intensive, time-consuming, and plagued by inherent biological challenges that can lead to significant workflow delays, impacting the entire drug development timeline [4] [1]. This technical support center addresses these delays with targeted troubleshooting and optimized protocols.
Frequently Asked Questions (FAQs)
Q1: What are the most common causes of delay in cell line development? The most significant delays stem from clonal heterogeneity, the labor-intensive process of screening and characterizing many single-cell clones, and instability in both growth and protein expression over time [1] [5].
Q2: How can I reduce variability when assessing the effect of a genetic knockout? Relying on a small number of single-cell clones can be misleading due to high clonal heterogeneity. Using stable, genetically engineered knockout pools is a superior approach, as they reduce variability caused by clonal heterogeneity and better reflect the host cell population's phenotype [1].
Q3: Are there alternatives to lengthy stable clone generation for early-stage material? Yes, advanced technologies now enable the use of stable cell pools for generating early-stage materials. Transposase-mediated stable pools and site-specific integration systems can produce material with comparable performance and product quality to clonal cell lines, significantly accelerating timelines for preclinical and toxicology studies [4] [5].
Q4: What are the key technical factors that can disrupt cell culture and cause delays? Common technical issues include incubation problems (temperature variations, evaporation), media defects, and suboptimal technique (insufficient mixing, static electricity affecting cell attachment, or insufficient cell inoculum) [6].
Troubleshooting Guides
Problem: Slow Growth and Low Viability
| Possible Cause | Observation | Solution |
|---|---|---|
| Suboptimal Culture Conditions | Fluctuations in growth rate, low viability. | Calibrate incubator; avoid frequent opening; ensure humidification to minimize evaporation [6]. |
| Apoptosis | Declining viability in production bioreactors. | Engineer host CHO cells to knock out key apoptotic genes (e.g., Apaf1, Bak/Bax) to delay cell death and improve production titers [5] [3]. |
| Media Defects | Poor growth across multiple cultures. | Test with a new batch or different source of media; ensure high-quality supplements [6] [7]. |
Problem: Low Recombinant Protein Titer
| Possible Cause | Observation | Solution |
|---|---|---|
| Inefficient Transgene Integration | Low expression across many stable clones. | Use site-specific integration systems (e.g., targeted integration) instead of random integration for more predictable, high-level expression [5]. |
| Weak Translation Initiation | Adequate mRNA but low protein yield. | Optimize the vector by incorporating a strong Kozak sequence (e.g., GCCGCCRCC) upstream of the start codon to enhance translation efficiency [3]. |
| Inefficient Protein Secretion | Cellular stress, improper protein folding. | Use systems biology and omics approaches to identify and engineer bottlenecks in the protein secretion pathway within CHO cells [5]. |
Problem: Inconsistent Product Quality
| Possible Cause | Observation | Solution |
|---|---|---|
| Clonal Heterogeneity | High batch-to-batch variation in product quality attributes (e.g., glycosylation). | Screen a larger number of clones or use engineered stable pools to find a consistent producer. Employ AI models to predict long-term clone stability based on epigenetic properties [1] [5]. |
| Unidentified Host Cell Proteins | Impurities in the final product. | Use CRISPR to knockout specific genes in CHO hosts (e.g., FN1) that can reduce problematic host cell protein levels [1]. |
Quantitative Data for Informed Decision-Making
Timeline Compression with Alternative Workflows
| Workflow Type | Traditional Workflow Duration | Accelerated Workflow Duration | Key Technology Enabler |
|---|---|---|---|
| CRISPR Knockout Screening | 9 weeks [1] | 5 weeks [1] | Stable KO pools (singleplex/multiplex) |
| Stable Cell Line Generation | Several months [4] | Weeks [4] [5] | Transposase-mediated integration; Site-specific integration |
Impact of Vector and Host Engineering on Protein Yield
| Engineering Strategy | Target | Resulting Titer Increase |
|---|---|---|
| Vector Optimization [3] | Addition of Kozak + Leader sequence | eGFP: 2.2-fold; SEAP: ~1.5-fold (stable) |
| Host Cell Engineering [3] | Apaf1 Knockout | Increased recombinant protein production |
| Host Cell Engineering [1] | FN1 (Fibronectin 1) Knockout | Up to 2-fold increase in final titer |
Detailed Experimental Protocols
Protocol 1: High-Throughput CRISPR Knockout Using Stable Pools
This protocol compresses the knockout screening timeline from 9 to 5 weeks by avoiding single-cell cloning [1].
Materials:
- CHO DG44 cells (or other CHO host line)
- Synthetic sgRNAs (e.g., TrueGuide Synthetic gRNAs)
- Cas9 Protein (e.g., TrueCut Cas9 Protein v2)
- NEON Transfection System or similar
- Chemically defined, serum-free medium
Method:
- sgRNA Design: Design 3 sgRNAs per target gene using software (e.g., Geneious Prime, Benchling) targeting an early exon present in all transcript variants. Select for high on-target efficiency and low off-target scores.
- RNP Transfection: Pre-assemble ribonucleoproteins (RNPs) from sgRNA and Cas9 protein at a 1:1 ratio. Transfect 2x10^5 CHO cells using an electroporation system (e.g., 1700 V, 20 ms pulse width, 1 pulse).
- Pool Expansion and Validation: 48 hours post-transfection, expand the transfected cell population without single-cell cloning. Extract genomic DNA and validate editing efficiency via Sanger sequencing and ICE analysis.
- Phenotypic Screening: Maintain the pool for over 6 weeks to confirm genetic and phenotypic stability. Use fed-batch shake flask cultures to screen for desired phenotypic effects (e.g., improved late-stage viability, increased titer).
Protocol 2: Enhancing Expression via Vector Optimization
This protocol details how to boost recombinant protein expression by incorporating regulatory elements into the expression vector [3].
Materials:
- Parental expression vector (e.g., pCMV with your gene of interest)
- Molecular biology cloning reagents
- CHO-S cells
Method:
- Vector Construction:
- Construct 1 (Kozak): Clone a strong Kozak sequence (GCCGCCRCC) directly upstream of the start codon (ATG) of your target gene.
- Construct 2 (Kozak + Leader): Clone the same Kozak sequence followed by an appropriate leader peptide sequence upstream of the target gene.
- Transient Transfection: Transfect CHO-S cells with the parental vector, Construct 1, and Construct 2.
- Analysis: 48 hours post-transfection, analyze expression. For fluorescent proteins (e.g., eGFP), use flow cytometry to measure Mean Fluorescence Intensity (MFI). For secreted proteins (e.g., SEAP), assay the culture supernatant using an appropriate kit.
- Stable Pool Generation: Create stable pools under antibiotic selection and repeat expression analysis to confirm the sustained benefit of the regulatory elements.
The Scientist's Toolkit: Key Research Reagent Solutions
| Item | Function | Example/Note |
|---|---|---|
| TrueCut Cas9 Protein v2 | CRISPR-mediated gene knockout in CHO cells [1]. | Used with synthetic sgRNAs to form Ribonucleoproteins (RNPs) for high-efficiency editing. |
| Transposase Enzyme | Enables stable, non-random integration of expression constructs [4]. | Faster generation of stable pools with high yields. |
| Kozak Sequence | Enhances translation initiation efficiency of mRNA [3]. | Sequence: GCCGCCRCC. |
| Leader Sequence | A signal peptide that aids in protein folding and secretion [3]. | Cloned upstream of the gene of interest. |
| Site-Specific Integration System | Targets transgene to a specific, well-characterized genomic locus [5]. | Reduces positional effect variability, accelerating cell line development. |
| FN1 sgRNA | Targets the Fibronectin 1 gene to prolong culture duration and improve viability [1]. | A validated target for host cell engineering. |
| Apaf1 sgRNA | Targets a key gene in the mitochondrial apoptosis pathway to reduce cell death [3]. | A validated target for inhibiting apoptosis. |
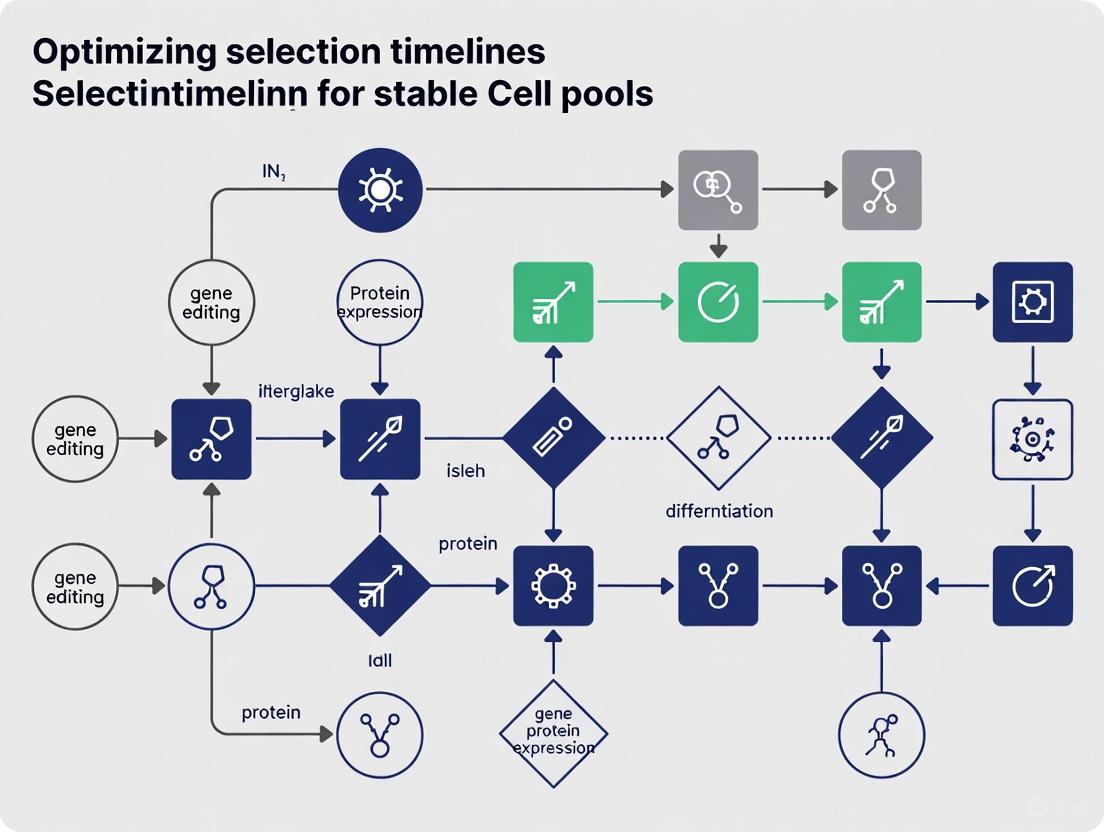
Workflow and Pathway Diagrams
CHO Cell Line Development Workflows
Strategies for CHO Cell Engineering
The development of stable cell pools is a critical foundation for biopharmaceutical research and development, enabling the production of recombinant proteins, monoclonal antibodies, and viral vectors. For years, the standard timeline for traditional stable cell line development has ranged from 6 to 12 months, with even the initial generation of stable pools often requiring approximately 3 months. This extended timeline creates significant bottlenecks in drug discovery and development pipelines, particularly as therapeutic modalities grow more complex.
This technical support center provides troubleshooting guidance and best practices for compressing these timelines, with a specific focus on achieving stable pool generation in as little as 7-10 weeks. The following sections are framed within a broader thesis on optimizing selection timelines for stable cell pool research, offering researchers actionable protocols, data-driven comparisons, and solutions to common experimental hurdles.
Quantitative Timeline Comparison: Traditional vs. Accelerated Processes
The transition to accelerated workflows represents a paradigm shift in cell line development. The table below quantifies the key differences between traditional and modern high-throughput approaches.
Table 1: Timeline Comparison of Traditional vs. Accelerated Stable Cell Pool Generation
| Process Phase | Traditional Timeline | Accelerated/High-Throughput Timeline | Key Acceleration Technologies |
|---|---|---|---|
| Overall Stable Cell Line Development | 6-12 months [8] | Not specified | |
| DNA to Fed-Batch Production | >3 months (approx. 12-14 weeks) [9] | 7-10 weeks [9] | Automated HTP platform, Leap-In transposase |
| Stable Pool Recovery & Small-Scale Material | Requires full recovery cycle [9] | 7 days post-transfection [9] | Early material supply from recovering pools |
| Pool Recovery & Working Stocks | Sequential stable transfections [9] | 14 days post-transfection [9] | Integrated automation (e.g., Lynx, NyOne) |
| Genetic Knockout Screening (Clonal) | ~9 weeks [1] | 5 weeks [1] | Pooled CRISPR knockout workflow |
Troubleshooting Guides and FAQs
FAQ: Addressing Common Timeline Challenges
Q1: What are the primary bottlenecks in a traditional 3-month stable pool development process? Traditional platforms are inherently sequential and labor-intensive [9]. They often involve repeated vector reformatting, low-throughput screening methods, and a requirement for separate transient expression campaigns to supply early-stage material, all of which cumulatively extend timelines [9].
Q2: How can we reduce variability and save time when screening genetic knockouts? Instead of relying on labor-intensive single-cell clones, which are highly variable and require screening hundreds of clones to find correctly edited ones, implement a stable knockout pool workflow [1]. This approach uses pools of genetically edited cells, reduces variability caused by clonal heterogeneity, and can compress screening timelines from 9 weeks to 5 weeks while increasing throughput 2.5-fold [1].
Q3: Our yields for bispecific antibodies are low due to production drift. How can we address this without extending our timeline? Implement a dual-antibiotic selection strategy. By designing vectors where each heavy chain is flanked by a different antibiotic resistance marker (e.g., blasticidin and puromycin), you can maintain yield and fidelity. One case study showed this strategy achieved titers over 3 times higher (2.7 g/L) compared to a single-selection control, and it has been successfully integrated into a standard 7-week HTP workflow [9].
Q4: What are the critical considerations for ensuring the genetic stability of rapidly developed cell pools? Genetic stability is paramount. While traditional methods like PCR and karyotyping are slow, Next-Generation Sequencing (NGS) is now the most accurate and comprehensive method. It provides a base-by-base view of the entire genome, allowing for early detection of genetic drift or mutations that could impact product quality and safety, thus ensuring regulatory compliance without sacrificing speed [10].
Troubleshooting Common Experimental Issues
Table 2: Troubleshooting Guide for Stable Pool Development
| Problem | Potential Cause | Solution | Preventive Measures |
|---|---|---|---|
| Low Titer Post-Transfection | Inefficient vector design or integration. | Screen multiple backbone vectors, promoters, and signal peptides in parallel [9]. | Use site-specific integration systems (e.g., Leap-In transposase) instead of random integration [9]. |
| Poor Viability in Fed-Batch | Suboptimal host cell line. | Engineer or use host cells with enhanced cellular machinery (e.g., CHOplus with increased ER capacity) [9]. | Employ a pooled CRISPR screen to identify gene knockouts (e.g., FN1) that improve late-stage viability [1]. |
| High Clonal Heterogeneity | Reliance on a limited number of single-cell clones. | Utilize stable knockout or expression pools to average out clonal variation [1]. | Implement high-throughput automation to screen a larger number of transfections in parallel (>1000) [9]. |
| Inconsistent Product Quality | Genetic instability of the cell pool over time. | Perform genetic stability testing using NGS to monitor the pool over serial passages [10]. | Characterize pools for critical quality attributes (CQAs) early in the development process. |
Detailed Experimental Protocols for Timeline Compression
Protocol 1: Automated High-Throughput Stable Pool Generation (7-10 Week Timeline)
This protocol outlines the end-to-end automated process for generating gram-scale material in 7-10 weeks [9].
Week 1: Vector Construction and Host Cell Preparation
- Vector Design: For bispecifics, use a dual-vector format with dual-antibiotic selection markers (e.g., blasticidin and puromycin). Perform killing curve assessments on the host cell line to determine optimal antibiotic concentrations [9].
- Host Cell Line: Use an engineered host line such as CHOZN or CHOplus. CHOplus has been shown to boost titers by 3.5-fold and can recover one week faster than standard CHOZN cells [9].
Week 1-2: High-Throughput Transfection and Selection
- Transfection: Perform >1,000 stable pool transfections in parallel using Leap-In transposase technology for multiple site-specific integrations [9].
- Automation: Integrate automated workstations (e.g., Lynx) for liquid handling and cell culture maintenance. Use imaging systems (e.g., NyOne) to monitor cell growth and confluence [9].
Day 7 Post-Transfection: Early Material Harvest
- Primary Screening: Harvest small-scale material (~150 μg) directly from the recovering pools. This eliminates the need for a separate transient expression campaign and allows for early-stage screening [9].
Day 14 Post-Transfection: Stable Pool Expansion
- Cell Banking: Freeze working cell banks of the recovered stable pools.
- Material Supply: Begin routine passages to supply 1-2 mg of material every 3-4 days for downstream assays [9].
Week 6-10: Fed-Batch Production and Analysis
- Scale-Up: Advance lead candidates to large-scale fed-batch production in bioreactor systems (e.g., Ambr15) [9].
- Analysis: Monitor titer, viability, and critical quality attributes (e.g., glycan profile) to select the final candidate [9].
Protocol 2: Pooled CRISPR Knockout Screening (5-Week Timeline)
This protocol describes a robust workflow for using stable knockout pools to evaluate gene targets, compressing the timeline from 9 to 5 weeks [1].
Week 1: sgRNA Design and RNP Complex Assembly
- sgRNA Design: Design three sgRNAs per target gene using software (e.g., Geneious Prime, Benchling) targeting an early exon present in all transcript variants. Select for high on-target efficiency and low off-target scores [1].
- RNP Assembly: Pre-assemble ribonucleoprotein (RNP) complexes using synthetic sgRNAs and Cas9 protein at a 1:1 ratio (e.g., 7.5 pmol each) [1].
Week 1: Cell Transfection and Culture
- Transfection: Transfect CHO cells (e.g., 2E5 cells) using an electroporation system (e.g., NEON Transfection System). Parameters: 1700 V, 20 ms pulse width, 1 pulse [1].
- Culture: Plate transfected cells in 24-well plates and expand as needed [1].
Week 2: Genotype Confirmation and Pool Expansion
- Genotyping: Extract genomic DNA 48 hours post-transfection. Perform PCR and Sanger sequencing of the target region. Analyze editing efficiency using software like ICE (Inference of CRISPR Edits) [1].
- Expansion: Expand the transfected cell population without single-cell cloning to create a heterogeneous but edited pool. This pool remains genetically stable for over 6 weeks, even in multiplexed formats targeting up to 7 genes [1].
Week 3-5: Phenotypic Screening in Fed-Batch Process
- Fed-Batch Assay: Inoculate shake flasks for a fed-batch bioprocess. Monitor viable cell concentration (VCC) and viability over time [1].
- Phenotypic Validation: Assess the phenotypic effect of the knockout (e.g., prolonged culture duration and improved late-stage viability for FN1 KO) and measure final product titer [1].
The Scientist's Toolkit: Essential Research Reagents and Solutions
The following table details key materials and technologies essential for implementing the accelerated workflows described in this guide.
Table 3: Research Reagent Solutions for Accelerated Stable Pool Development
| Reagent/Technology | Function | Application in Timeline Compression |
|---|---|---|
| Leap-In Transposase | Enables multiple site-specific genomic integrations of the gene of interest [9]. | Produces highly stable pools faster than random integration methods; core to the 7-week timeline [9]. |
| CHOplus Engineered Host | A CHOZN host cell line genetically engineered for enhanced endoplasmic reticulum (ER) capacity [9]. | Boosts titers by 3.5-fold and can reduce pool recovery time by one week [9]. |
| Dual-Antibiotic Selection | Uses two antibiotics (e.g., Blasticidin & Puromycin) to select for cells expressing all chains of a multispecific antibody [9]. | Minimizes production drift, improves bispecific yield and fidelity within the standard workflow [9]. |
| CRISPR/Cas9 RNP Complex | A pre-assembled complex of Cas9 protein and synthetic sgRNA for precise gene editing [1]. | Enables rapid generation of stable knockout pools without single-cell cloning, compressing target screening to 5 weeks [1]. |
| NGS (Next-Generation Sequencing) | A comprehensive method for genetic stability testing by sequencing the entire genome of a cell line [10]. | Provides rapid, base-by-base analysis to confirm genetic integrity of rapidly developed pools, ensuring quality and safety [10]. |
| High-Throughput Automation | Integrated robotic systems (e.g., Lynx, NyOne, Octet) for liquid handling, imaging, and analysis [9]. | Allows parallel processing of >1000 transfections, enabling massive throughput and reducing manual labor [9]. |
Facing patent cliffs and rising R&D costs, the biopharmaceutical industry is under immense pressure to accelerate development, particularly for complex modalities like bispecific antibodies and cell therapies. This technical support center provides targeted guidance to help researchers overcome critical bottlenecks in generating stable, high-producing cell pools—a key step in compressing these vital timelines.
Frequently Asked Questions & Troubleshooting
1. Our stable pools for bispecific antibodies have low yield and poor product fidelity. What strategies can improve this?
- Problem: Traditional selection methods for multi-chain molecules often lead to "production drift," where non-productive clones dominate, reducing yield and purity.
- Solution: Implement a dual-antibiotic selection strategy.
- Methodology: Design your expression vectors so that each heavy chain (e.g., HC1 and HC2) is flanked by a different antibiotic resistance marker, such as blasticidin (BSD) and puromycin (Puro). This ensures selective pressure for cells that have successfully integrated all necessary genetic components.
- Protocol:
- Conduct killing curve assays in your host cell line (e.g., CHOZN) to determine the optimal concentrations for both antibiotics.
- Co-transfect cells with your vectors and select using both antibiotics simultaneously.
- Culture and monitor the pools under these dual-selection conditions.
- Expected Outcome: This approach can significantly improve yield and fidelity. Case studies have shown a greater than threefold increase in titer (e.g., from 0.8 g/L to 2.7 g/L) compared to single-selection methods [9].
2. Our cell line development is slow and low-throughput, creating a discovery bottleneck. How can we increase speed?
- Problem: Conventional stable cell line development is sequential and labor-intensive, often taking over three months.
- Solution: Adopt an automated high-throughput (HTP) platform utilizing transposase-based technology.
- Methodology: Use Leap-In transposase technology for site-specific integration, combined with integrated automation for transfection, selection, and titer analysis.
- Protocol:
- Perform parallel transfections of thousands of stable pools in an automated workstation (e.g., Lynx).
- Use imaging systems (e.g., NyOne) and titer analysis (e.g., Octet) for rapid clone screening.
- For critical leads, use an opto-electronic system (e.g., Berkeley Lights Beacon) for clonal selection.
- Expected Outcome: This end-to-end automated system can reduce the timeline from DNA to large-scale fed-batch production to 7-10 weeks, cutting about a month from the standard process and enabling a single researcher to manage over 1,000 transfections [9].
3. We struggle with clonal variation and instability. Are there technologies to ensure consistent, high-yielding cell lines?
- Problem: Selection bias and unpredictable gene expression lead to clones that are unstable or have low productivity.
- Solution: Utilize platform technologies designed for site-specific integration and stability, such as the GPEx Lightning platform.
- Methodology: This platform uses a pre-engineered host cell line with specific "dock" sites and a recombinase enzyme to insert genes of interest site-specifically, without antibiotic selection.
- Protocol:
- Transfect cells with your gene of interest and the recombinase.
- The recombinase "flips" the gene into the pre-defined dock sites in the genome.
- Generate stable cell pools for rapid material production, or proceed to clonal selection.
- Expected Outcome: Generates highly stable cell pools and clones with consistent titers over many generations. Stable pools can produce titers of up to 12 g/L, and the process can deliver a research cell bank in as few as 40 days [11].
4. Our complex biologics have low titers even after optimization. Can host cell engineering help?
- Problem: Standard host cell lines may lack the cellular machinery to produce complex proteins at high yields.
- Solution: Employ engineered host cell lines with enhanced functionality.
- Methodology: Use hosts like CHOplus, which are engineered for increased endoplasmic reticulum (ER) capacity to handle the protein-folding load of complex molecules.
- Protocol:
- Substitute your standard host cell line (e.g., CHOZN) with the engineered alternative (CHOplus) in your standard CLD workflow.
- Proceed with stable pool generation and selection as usual.
- Expected Outcome: Engineered hosts can significantly boost productivity. In a bispecific program, using CHOplus resulted in a 3.5-fold increase in titer (from 0.33 g/L to 1.18 g/L) and faster pool recovery compared to the standard host [9].
Quantitative Data for Platform Comparison
The table below summarizes performance data from cited platforms to aid in selection and planning.
| Platform / Technology | Key Feature | Reported Output | Reported Timeline | Key Application |
|---|---|---|---|---|
| BMS HTP Platform [9] | Automated transposase-based integration | Titer: Up to 6 g/L (after vector optimization) | 7-10 weeks (DNA to production) | High-throughput mAb & bispecific screening |
| GPEx Lightning Platform [11] | Recombinase-mediated site-specific integration | Titer: ≤12 g/L (stable pools) | ~40 days (to stable pool) | Rapid production for complex molecules (e.g., 4-chain bispecifics) |
| Dual-Antibiotic Selection [9] | Selection for bispecific fidelity | Titer: 2.7 g/L (vs. 0.8 g/L for GS-only) | N/A (Integrated into workflow) | Improving yield & fidelity of bispecific antibodies |
| CHOplus Engineered Host [9] | Enhanced ER capacity | Titer: 1.18 g/L (vs. 0.33 g/L in CHOZN) | 1 week faster pool recovery | Boosting productivity for difficult-to-express molecules |
Essential Research Reagent Solutions
The following table lists key materials and technologies referenced in the experimental solutions.
| Reagent / Technology | Function | Example Use Case |
|---|---|---|
| Leap-In Transposase | Enables multiple site-specific genomic integrations for highly stable, high-producing pools. | Core technology in the BMS HTP platform for rapid stable pool generation [9]. |
| Dual-Antibiotic Vectors | Vectors with different resistance markers (e.g., BSD, Puro) for each chain to enforce co-expression. | Selecting for high-fidelity bispecific antibody production [9]. |
| CHOplus Engineered Host | A CHO host cell line engineered with enhanced ER capacity to improve protein folding and secretion. | Increasing titers for complex biologics where cellular capacity is a bottleneck [9]. |
| GPEx Lightning System | A platform using a pre-engineered cell line and recombinase for fast, stable gene insertion. | Accelerated development of stable cell pools for toxicology studies or early clinical material [11]. |
| Automated Workstations | Integrated systems (e.g., Lynx, NyOne, Octet) for hands-free cell culture, imaging, and analytics. | Enabling high-throughput parallel processing of thousands of stable transfections [9]. |
Experimental Workflow: Automated HTP Cell Line Development
The following diagram illustrates the integrated, automated workflow for high-throughput cell line development.
Stable Cell Pool Development Workflow
For projects requiring rapid material generation, the following workflow outlines the process for developing stable cell pools, from vector design to production.
In the pursuit of compressing biopharmaceutical development timelines, the use of stable cell pools has emerged as a powerful alternative to traditional single-cell cloning. This approach bypasses the labor-intensive and time-consuming process of clonal isolation and expansion, enabling a more direct assessment of a genetic modification's impact on the host cell population. The success of this strategy hinges on the rigorous monitoring of three critical, interdependent metrics during the pool selection timeline:
- Titer: The concentration of the therapeutic protein produced, which is the ultimate measure of cell line productivity.
- Viability: The percentage of living cells in a culture, which reflects overall cell health and culture longevity.
- Genetic Stability: The consistency of both the introduced genetic modification and the host cell genome over serial passages, which is essential for scalable and reproducible manufacturing processes.
Effectively defining and troubleshooting these metrics allows researchers to de-risk development, accelerate screening, and build a robust foundation for clinical manufacturing [1] [12].
Troubleshooting Guides
► Titer-Related Issues
Problem: Low or Unstable Protein Titer in Cell Pools
| Observation | Potential Root Cause | Recommended Action |
|---|---|---|
| Low titer from the start of culture | Low proportion of high-producing cells in the pool; inefficient transgene integration. | Increase the diversity of the initial mini-pool by screening a larger number of transfectants. Implement higher stringency selection pressure [12]. |
| Titer declines over prolonged culture | Genetic instability; loss of transgene or promoter silencing. | Perform stability studies over 70+ population doublings. Monitor genetic consistency via PCR or NGS at different time points [12]. |
| High titer but poor product quality | Suboptimal culture conditions driving undesirable post-translational modifications. | Optimize feed strategy and culture parameters (pH, temperature). Use machine learning (ML) to model complex interactions affecting product quality [13]. |
► Viability and Growth Issues
Problem: Poor Cell Growth or Rapid Viability Drop
| Observation | Potential Root Cause | Recommended Action |
|---|---|---|
| Poor growth after transfection | Cellular toxicity from the transfection or editing process. | Optimize transfection parameters (e.g., voltage, pulse width). Use high-quality, pre-assembled ribonucleoprotein (RNP) complexes for CRISPR editing [1]. |
| Viability crash during selection | Excessive selection agent pressure. | Titrate the concentration of the selection antibiotic (e.g., Puromycin) to determine the minimal effective dose that enriches edited cells without causing mass cell death [14]. |
| Gradual viability decline in extended fed-batch | Accumulation of metabolic by-products (e.g., lactate, ammonia) or depletion of essential nutrients. | Analyze metabolite profiles (glucose, lactate) to adjust feed strategies. Use spent media analysis to identify and replenish depleted nutrients [15]. |
| Cell clumping in suspension culture | Release of DNA from dead cells, increasing media viscosity. | Add harmless nucleases to the culture medium to degrade free DNA and reduce clumping [16]. |
► Genetic Stability Issues
Problem: Inconsistent or Lost Genetic Modifications in the Pool
| Observation | Potential Root Cause | Recommended Action |
|---|---|---|
| High editing efficiency but loss of KO phenotype over time | The cell pool is a mixed population, and unedited cells may outcompete edited ones. | Perform multiple transfections to increase the percentage of edited cells in the pool. Use high-fidelity Cas9 and validated sgRNAs to minimize off-target effects [1]. |
| Unintended genomic alterations | CRISPR off-target effects or genomic rearrangements from double-strand breaks. | Utilize computational tools to design sgRNAs with high on-target and low off-target scores. Perform whole-genome sequencing on the final selected pool to rule out major aberrations [1] [17]. |
| Inconsistent performance between scaled-up cultures | Genetic heterogeneity within the original pool leading to divergent population dynamics. | Ensure the master cell pool is created from a large, well-mixed population. Confirm that critical metrics (titer, viability) are maintained for at least 6 weeks (approx. 40-50 population doublings) to demonstrate stability [1]. |
Frequently Asked Questions (FAQs)
Q1: Why should I use a cell pool instead of a single clone for early-stage research? Cell pools provide a significant timeline advantage, compressing screening from approximately 9 weeks to just 5 weeks. They better represent the population-level phenotype of the host cell line and reduce the variability and potential bias introduced by clonal heterogeneity, which can be substantial in aneuploid cells like CHO. This makes pool-level data more reproducible for assessing the effect of a genetic knockout [1].
Q2: How long does it take to generate a stable, characterized cell pool? Using an optimized workflow, a research cell bank (RCB) of a stable pool can be generated in as little as 28 weeks. This timeline includes transfection, mini-pool generation and screening, productivity evaluation in scaled-down systems (e.g., Ambr 15 and 250), and final stability testing [12].
Q3: What is a key genetic stability benchmark for a CRISPR-edited knockout pool? A robust cell pool should demonstrate consistent genotypic (presence of the edit) and phenotypic (e.g., improved viability) stability for over 6 weeks in culture, which is comparable to the timeline required for a typical production bioreactor process [1].
Q4: How can I quickly check the editing efficiency in my cell pool without sequencing? The incorporation of an antibiotic resistance marker linked to the CRISPR edit allows for rapid enrichment of successfully edited cells. The efficiency can be inferred by the percentage of cells that survive selection pressure. However, genotypic confirmation via PCR and Sanger sequencing followed by ICE (Inference of CRISPR Edits) analysis is still required for quantitative validation [1] [14].
Q5: My cell pool has high viability but low titer. Where should I look first? First, confirm that the majority of cells in the pool contain the correct genetic modification. High viability with low titer can indicate a high proportion of non-producing cells that have outcompeted the producers. Analyze the pool's genetic consistency and reassess the selection strategy to ensure a high percentage of producing cells [1] [12].
Experimental Protocols & Workflows
► Protocol 1: Generating a Stable Knockout Pool Using CRISPR-Cas9
This protocol outlines the steps to create a genetically stable knockout (KO) cell pool, enabling high-throughput screening of gene targets without single-cell cloning [1] [14].
Key Reagents and Materials:
- Host CHO cells (or other cell line of interest)
- TrueCut Cas9 Protein v2
- Synthetic sgRNA (TrueGuide)
- NEON Transfection System & Kit
- Selection antibiotic (e.g., Puromycin)
Step-by-Step Methodology:
- sgRNA Design: Design 3-4 sgRNAs targeting an early exon of the target gene to cause frameshift mutations. Select guides based on high on-target efficiency scores and low off-target potential using software like Geneious or Benchling [1].
- RNP Complex Assembly: Pre-assemble the Cas9 protein and sgRNA at a 1:1 ratio (e.g., 7.5 pmol each) to form a ribonucleoprotein (RNP) complex. This complex is more precise and causes less cellular toxicity than plasmid-based methods.
- Cell Transfection: Transfect 2 x 10^5 cells using the NEON Transfection System with optimized parameters (e.g., 1700 V, 20 ms pulse width, 1 pulse).
- Pool Selection and Expansion: 48 hours post-transfection, begin applying the appropriate selection pressure. Expand the surviving cell population to create a heterogeneous but enriched knockout pool.
- Genotypic Validation: Extract genomic DNA from the pool. Amplify the target region by PCR and analyze the editing efficiency via Sanger sequencing and ICE analysis [1].
- Phenotypic Validation: Evaluate the pool in a fed-batch shake flask assay to confirm the expected phenotypic effect (e.g., prolonged viability, altered metabolic activity) [1].
► Protocol 2: Evaluating Pool Stability and Productivity
This protocol describes how to assess the critical metrics of titer, viability, and genetic stability over time to ensure pool robustness.
Key Reagents and Materials:
- Established cell pool
- Chemically defined culture medium
- Bench-top bioreactors (e.g., Ambr 15 or 250 systems)
- Metabolite Analyzer (e.g., BioProfile)
- PCR and sequencing reagents
Step-by-Step Methodology:
- Long-Term Stability Study: Passage the cell pool every 2-3 days for a minimum of 6 weeks (approximately 70 population doublings). Maintain parallel cultures to assess biological reproducibility [1] [12].
- Monitor Growth and Viability: Track viable cell density (VCD) and viability throughout the study using a cell counter (e.g., CASY). A stable, healthy pool will maintain consistent growth kinetics and high viability.
- Measure Productivity: Sample the culture supernatant at regular intervals (e.g., daily in fed-batch) and quantify protein titer using assays like HPLC or ELISA [12].
- Assess Genetic Stability: At designated time points (e.g., weeks 0, 3, and 6), sample the pool and re-run genotypic analysis (PCR/ICE) to confirm that the knockout is maintained in the population without reversion [1].
- Evaluate Product Quality: For pools producing therapeutic proteins, analyze critical quality attributes (CQAs) like charge variants at different time points to ensure process consistency [13].
► Workflow Diagram: Stable Cell Pool Generation & Screening
This diagram visualizes the integrated workflow from pool generation to final characterization, highlighting the compressed timeline.
The Scientist's Toolkit: Research Reagent Solutions
| Category | Item | Function in Pool Selection | Key Consideration |
|---|---|---|---|
| Cell Line Engineering | CRISPR-Cas9 RNP Complex | Enables precise gene knockout without plasmid integration. | Using pre-assembled RNP increases editing efficiency and reduces off-target effects [1]. |
| Synthetic sgRNA | Guides Cas9 to the specific genomic target site. | Design 3-4 per gene to mitigate variability in individual sgRNA efficiency [17]. | |
| Selection & Screening | Selection Antibiotics (e.g., Puromycin) | Enriches for cells that have successfully incorporated the edit. | Dose must be titrated to balance efficient selection with cell health [14]. |
| High-Throughput Bioreactors (e.g., Ambr systems) | Allows parallel, scaled-down fed-batch cultivation for clone and pool screening. | Provides highly predictive data for larger-scale performance [12]. | |
| Analytical Tools | Metabolite Analyzer (e.g., BioProfile) | Monitors concentrations of glucose, lactate, and other metabolites in real-time. | Essential for optimizing feed strategies and understanding cell health [15]. |
| ICE Analysis Software | Quantifies CRISPR editing efficiency from Sanger sequencing data. | A critical tool for genotypic validation without needing deep sequencing [1]. |
High-Throughput Platforms and Advanced Engineering for Rapid Selection
Leveraging Transposase Technologies (e.g., Leap-In) for Efficient Gene Integration
This technical support center provides troubleshooting and methodological guidance for researchers using transposase technologies, particularly the Leap-In Transposase platform, to optimize selection timelines for stable cell pool generation. The content is designed to help scientists and drug development professionals overcome common experimental hurdles and implement robust protocols that accelerate biologic drug development.
Troubleshooting Guide: Common Issues with Transposase-Mediated Stable Pool Generation
Table 1: Troubleshooting Common Problems in Stable Pool Generation
| Problem & Symptoms | Potential Root Cause | Recommended Solution | Expected Outcome |
|---|---|---|---|
| Low Transfection Efficiency & Poor Pool Recovery [9] • Low cell viability post-transfection • Few pools recovering after selection | • Low-quality DNA or mRNA • Suboptimal transfection reagent or conditions • Cytotoxicity from integration machinery | • Use high-quality, endotoxin-free plasmid DNA or mRNA. • Optimize transfection parameters (DNA:reagent ratio, cell density). • For Leap-In, use transposase mRNA to avoid genomic integration of transposase gene [18]. | Robust recovery of stable pools within 14 days post-transfection [9]. |
| Low Titer in Stable Pools [9] • Protein expression below expectations • Low productivity in fed-batch | • Suboptimal genetic construct • Inefficient integration into transcriptionally active regions • Low transgene copy number | • Screen multiple vector backbones, promoters, and signal peptides [9]. • Utilize platform hosts like CHOplus with enhanced ER capacity [9]. • Leverage Leap-In technology for integration into active chromatin [18]. | Titer improvements of >3-fold; case studies show gains from 0.33 g/L to >6 g/L [9]. |
| Poor Product Fidelity for Bispecifics [9] • Incorrect chain pairing • Low yield of functional molecule | • Genetic drift and dominance by non-productive cells during selection • Imbalanced expression of multiple chains | • Implement a dual-antibiotic selection strategy where each heavy chain (HC1, HC2) has a different resistance marker (e.g., blasticidin, puromycin) [9]. | Dramatically improved bispecific yield and fidelity; case study showed increase from <0.9 g/L to 2.7 g/L [9]. |
| Genetic Instability [18] • Drop in titer over extended culture (>60 generations) • Loss of transgene | • Random integration leading to gene silencing • Recombination of concatemeric inserts | • Use Leap-In transposase for single-copy, scarless integration, preventing repeat-induced silencing [18]. • Perform stability testing over 60 population doublings [18]. | Stable volumetric productivity and integrated transposon copy number over long-term culture [18]. |
Frequently Asked Questions (FAQs)
Q1: How does transposase technology fundamentally accelerate timelines compared to traditional methods?
Traditional cell line development (CLD) relying on random transgene integration is slow, low-throughput, and can take over three months from DNA to large-scale material [9]. Transposase-based systems, like Leap-In, leverage a "semi-targeted integration" (STI) mechanism that inserts single, intact copies of the transgene into transcriptionally active regions of the host genome [19]. This generates a stable, high-producing cell pool from the outset, eliminating the need for lengthy clonal screening campaigns during early development. This "pool-to-clone" strategy can compress the timeline from DNA to GMP manufacturing-ready material to under three months, saving several months compared to standard processes [9] [20].
Q2: What are the key advantages of using mRNA for transposase delivery over plasmid DNA?
Delivering the transposase as mRNA, rather than a plasmid, is a critical best practice. The mRNA is translated into a functional but transient transposase protein that performs the integration. The mRNA itself is then degraded by natural cellular pathways. This prevents the transposase gene from integrating into the host genome, ensuring that the transposon cannot be re-mobilized, which guarantees the long-term genetic stability of your stable pool or clonal line [18].
Q3: My project involves a complex molecule, like a bispecific antibody. What specific strategies can I use to ensure success?
For multi-chain proteins, achieving the correct stoichiometry is crucial. The Leap-In platform is particularly suited for this, as a single transposon can carry multiple open reading frames (ORFs) with the entire construct integrated intact, maintaining the designed expression ratios [18]. Furthermore, employing a dual-selection strategy is highly effective. By putting different selection markers (e.g., blasticidin and puromycin) on different chains of the bispecific antibody, you apply selective pressure for cells that have successfully integrated and express all required components, thereby minimizing drift toward non-productive cells and dramatically improving functional yield [9].
Q4: What are the typical yields I can expect from a stable pool, and when should I move to single-clone isolation?
Titers can vary based on the molecule, host cell, and process optimization. However, case studies with optimized systems report stable pool titers in the range of 1–3 g/L, with some programs achieving over 6 g/L [9]. The high quality of the stable pool means you can use it directly for generating early-stage material (e.g., for toxicology studies or early clinical trials). In parallel, you can initiate clonal isolation from the same high-producing pool to find an elite clone for higher commercial-scale production, which may achieve titers up to 5 g/L or more [20]. This dual-track approach de-risks and accelerates the entire development path.
Experimental Protocol: Generating a High-Titer Stable Pool Using Leap-In Transposase
This protocol outlines the generation of a recombinant stable cell pool using the Leap-In Transposase system in CHO host cells, designed for maximum efficiency and compressed timelines.
Key Reagent Solutions:
- Host Cells: CHOZN (BMS platform) or DG44 (ATUM platform) cells, adapted to serum-free media [9] [18].
- Transposon Vector: A Leap-In synthetic transposon containing your gene(s) of interest, flanked by Inverted Terminal Repeats (ITRs). For bispecifics, use a vector designed for multiple ORFs [18].
- Transposase: Leap-In Transposase mRNA (highly recommended over plasmid DNA).
- Selection Antibiotics: e.g., Puromycin, Blasticidin. Perform a killing curve assay in your host cell line to determine the optimal minimum concentration for selection [9].
Procedure:
Day -3 to 0: Host Cell Preparation
- Culture and expand your CHO host cells in an appropriate serum-free medium to ensure they are in log-phase growth and have >95% viability on the day of transfection.
Day 0: Co-transfection
- Seed cells at a pre-optimized density in a growth medium.
- Co-transfect the cells with the two key components:
- Synthetic Transposon DNA: Contains your gene(s) of interest.
- Leap-In Transposase mRNA: Facilitates the "cut-and-paste" integration.
- Use a transfection reagent and protocol optimized for your specific cell line.
Day 1: Post-Transfection Recovery
- Approximately 24 hours post-transfection, replace the transfection mixture with fresh growth medium.
Day 2: Initiation of Selection
- Begin selection by adding the pre-determined concentration of relevant antibiotics to the culture medium. This will eliminate untransfected cells that lack the resistance marker(s).
Day 7-14: Pool Recovery & Analysis
- Monitor cell viability and density closely. Viability should drop and then recover as the stable pool expands.
- By Day 7, small-scale material (~150 μg) can often be harvested from recovering pools for initial screening [9].
- By Day 14, the stable pool should be fully recovered. At this point:
- Freeze a working cell bank of the stable pool.
- Assess titer and product quality (e.g., via Octet, HPLC).
- The pool is now ready to be used to supply material (1-2 mg can be supplied every 3-4 days via routine passage) or to initiate fed-batch production for larger quantities [9].
Performance Data and Timeline Compression
Table 2: Quantitative Timeline and Titer Comparisons
| Metric | Traditional CLD (e.g., CHOZN) | HTP Transposase Platform (e.g., Leap-In) | Reference |
|---|---|---|---|
| Timeline (DNA to Fed-Batch) | >3 months | 7–10 weeks (saving ~1 month) | [9] |
| Stable Pool Recovery Time | N/A (not typically used) | ~14 days | [9] |
| Throughput (# Transfections) | Low-throughput, sequential | >1,000 stable pool transfections in parallel | [9] |
| Typical Stable Pool Titer (mAbs) | N/A | 1 - 3 g/L (case study range) | [9] [20] |
| Titer with Engineered Host (CHOplus) | Baseline | ~3.5x increase (e.g., from 0.33 g/L to 1.18 g/L) | [9] |
| GMP Manufacturing Readiness | 16–24 months | <6 months from transfection to Phase I trial start | [20] |
The Scientist's Toolkit: Essential Research Reagents
Table 3: Key Reagents for Transposase-Based Cell Line Development
| Reagent / Solution | Function & Description | Example Use Case |
|---|---|---|
| Leap-In Transposase mRNA | The enzyme that catalyzes the excision of the transposon from the donor vector and its integration into the host genome. Using mRNA ensures transient activity and long-term stability [18]. | Essential for all stable pool generation with the Leap-In system. |
| Synthetic Transposon (ITR-flanked Vector) | The DNA cargo to be integrated. It contains your gene(s) of interest and a selection marker, flanked by Inverted Terminal Repeats (ITRs) that are recognized by the transposase [18]. | Carries the therapeutic protein gene; can be designed with 2-4 ORFs for bispecific antibodies [18]. |
| CHOplus Engineered Host | A host cell line (e.g., based on CHOZN) engineered for enhanced endoplasmic reticulum (ER) capacity, reducing metabolic burden and increasing specific productivity [9]. | Boost titers for difficult-to-express molecules; shown to improve titer by 3.5x [9]. |
| Dual-Selection Antibiotics | Using two different antibiotics (e.g., Blasticidin and Puromycin), each linked to a different expression cassette. Ensures selective pressure for cells expressing all components of a complex molecule [9]. | Critical for maintaining yield and fidelity in bispecific antibody production. |
| VectorGPS Platform | A bioinformatics platform for the design and optimization of expression vectors, including codon optimization and expression balancing for multiple genes [18]. | Pre-experimental in-silico optimization of vector constructs to maximize productivity. |
Workflow Visualization
Stable Cell Pool Generation Workflow
Dual Selection Strategy for Bispecifics
Technical Support Center: Troubleshooting & FAQs
This technical support center addresses common challenges researchers face when integrating automated platforms like the Lynx automated workstation, Ambr bioreactor systems, and Octet analysis tools for stable cell pool development. The guidance is framed within the context of compressing selection timelines and enhancing productivity in biotherapeutics development.
Frequently Asked Questions (FAQs)
Q1: What are the key advantages of using an integrated Lynx, Ambr, and Octet platform for stable pool generation? An integrated high-throughput (HTP) platform significantly accelerates the timeline from DNA to stable cell pools and production-ready material. This system enables the parallel processing of over 1,000 stable pool transfections, provides early, small-scale material for primary screening within a week, and delivers high-titer, high-quality material in a fraction of the time required by conventional methods. It is designed to handle diverse molecule formats, including monoclonal and bispecific antibodies, by combining automation with optimized selection strategies [9].
Q2: Why might my stable pools for a bispecific antibody show low yield and poor product fidelity? This is often caused by production drift, where non-productive clones overtake the culture. A dual-antibiotic selection strategy can mitigate this. By constructing vectors where each heavy chain (HC1 and HC2) is flanked by a different antibiotic resistance marker (e.g., blasticidin and puromycin), you selectively pressure the cells to maintain both chains. This approach has been shown to increase titers more than threefold compared to using a single selection marker alone [9].
Q3: How can I increase the productivity of my CHO host cell line? Utilizing an engineered host cell line like CHOplus, which has enhanced endoplasmic reticulum (ER) capacity, can dramatically boost titers. In case studies, stable pools in CHOplus hosts recovered one week faster and achieved a 3.5-fold productivity increase compared to standard CHOZN cells. This host also maintains comparable product quality in terms of purity and glycan profiles [9].
Q4: My Octet titer measurements are inconsistent. What could be the issue? Ensure that the culture samples are properly homogenized before analysis, as air bubbles or cell debris can interfere with the bio-layer interferometry (BLI) signal. Consistent sample preparation is critical for reliable, quantitative titer data when using the Octet system for high-throughput screening [21].
Q5: What is the benefit of using a pooled CRISPR knockout (KO) workflow over a clonal one? A stable KO pool workflow directly screens genetically heterogeneous pools, reducing variability caused by clonal heterogeneity and better reflecting the host cell population's phenotype. This approach compresses screening timelines from 9 weeks to just 5 weeks and increases throughput by 2.5-fold by eliminating the need for single-cell clone isolation and expansion. The pools remain genetically stable for over 6 weeks, even when multiplexing targets [1].
Troubleshooting Guides
Table 1: Troubleshooting Stable Cell Pool Generation
| Problem Area | Potential Cause | Recommended Solution |
|---|---|---|
| Low Transfection Efficiency | Suboptimal transfection reagent or parameters | Use pre-assembled ribonucleoprotein (RNP) complexes with synthetic gRNA and Cas9 protein. Optimize electroporation parameters (e.g., 1700 V, 20 ms pulse width) [1]. |
| Poor Pool Recovery & Growth | Excessive antibiotic selection pressure | Perform a killing curve assessment for your host cell line to determine the optimal, non-lethal concentration of antibiotics (e.g., blasticidin, puromycin) for selection [9]. |
| Low Titer in Fed-Batch | Non-optimized culture process | Use the Ambr 15 or 250 systems for high-throughput media and feed screening to identify conditions that boost productivity, potentially doubling the final titer [12] [9]. |
| High Clonal Heterogeneity | Reliance on a limited number of clones | Implement a pooled screening approach using KO pools to assess genetic engineering effects, avoiding the bias and variability introduced by single-cell cloning [1]. |
Table 2: Troubleshooting Integrated System Operations
| Problem Area | Potential Cause | Recommended Solution |
|---|---|---|
| Data Integration Gaps | Systems (Lynx, Ambr, Octet) operating in siloes | Implement a centralized data management system to track samples and performance data across all platforms, enabling data-driven clone selection [9]. |
| Failed Scale-Up | Process conditions not representative | Use the Ambr 250 system to mimic larger bioreactor conditions and optimize parameters (pH, DO, feeding) before transferring to a 5 L benchtop bioreactor for confirmation [12]. |
| Inconsistent KO Phenotype | Clonal variation masking the true KO effect | Screen using stable KO pools to obtain a more reliable and reproducible phenotypic readout, as demonstrated with the FN1 KO which prolonged culture duration [1]. |
Experimental Protocols for Key Workflows
Protocol 1: High-Throughput Stable Cell Pool Generation & Titer Screening
This protocol outlines an automated, end-to-end process for rapidly generating and screening thousands of stable cell pools, compressing timelines to 7-10 weeks [9].
- Transfection: Use Leap-In transposase technology for site-specific integration in CHOZN or CHOplus host cells. Co-transfect >1,000 stable pools in a dual-vector format via an automated Lynx workstation.
- Selection & Recovery: Apply dual-antibiotic selection (e.g., GS + Blasticidin/Puromycin) 24-48 hours post-transfection. Monitor cell recovery and growth using integrated systems like the NyOne imaging system.
- Early-Stage Material Harvest: By day 7 post-transfection, harvest small-scale material (~150 µg) directly from the recovering pools for primary screening assays.
- High-Throughput Titer Analysis: Once pools are recovered (by day 14), use the Octet BLI platform (e.g., Octet RH96 or Red384) to rapidly quantify protein titers from culture supernatants [21] [9].
- Fed-Batch Evaluation: Advance high-producing pools to a micro-bioreactor system like Ambr 15 for small-scale fed-batch culture to evaluate growth, viability, and productivity under process-like conditions [21].
Protocol 2: Pooled CRISPR-KO Screening for Host Cell Line Engineering
This protocol describes a method for rapidly evaluating gene knockout effects using stable KO pools, reducing timelines from 9 to 5 weeks [1].
- sgRNA Design: Design three sgRNAs per target gene using software like Geneious Prime or Benchling. Target an early exon present in all transcript variants to induce frameshift mutations.
- RNP Transfection: Pre-assemble RNP complexes using 7.5 pmol of synthetic gRNA and Cas9 protein. Transfect into host cells (e.g., 2E5 CHO DG44 cells) using an electroporation system (e.g., NEON Transfection System) with parameters set to 1700 V, 20 ms, 1 pulse.
- Genotype Confirmation: 48 hours post-transfection, extract genomic DNA and perform PCR on the target region. Use Sanger sequencing and ICE analysis to confirm editing efficiency.
- Phenotypic Screening in Fed-Batch: Culture the heterogeneous KO pools in shake flasks or micro-bioreactors in fed-batch mode. Monitor culture duration, late-stage viability, and final titer. Compare to wild-type pools to identify beneficial KO effects, such as the two-fold titer increase observed with FN1 KO [1].
System Workflow Diagrams
The following diagram illustrates the integrated workflow and data flow between the Lynx, Ambr, and Octet systems within an automated cell line development platform.
Integrated Automated Workflow for Stable Pool Development
This logical workflow shows how automation and micro-scale cultivation are intertwined, with the Octet system serving as a key analytical node for decision-making.
Research Reagent Solutions
The table below lists essential materials and reagents used in the integrated automated workflows described.
Table 3: Key Research Reagents and Materials
| Item | Function in the Workflow |
|---|---|
| CHOZN / CHOplus Host Cells | The mammalian host cell line used for stable integration and recombinant protein production. CHOplus is engineered for enhanced ER capacity and higher productivity [9]. |
| Leap-In Transposase System | Enables site-specific integration of the gene of interest into the host cell genome, leading to highly stable pools and faster recovery compared to random integration [9]. |
| Synthetic gRNA & Cas9 Protein | Pre-complexed as Ribonucleoproteins (RNPs) for highly efficient CRISPR-Cas9 gene editing in host cell line engineering workflows [1]. |
| Dual-Antibiotic Markers (e.g., Blasticidin, Puromycin) | Used in bispecific antibody production to apply selective pressure for maintaining both heavy chains, thereby improving yield and product fidelity [9]. |
| Chemically Defined Media & Feeds | Optimized formulations used in the Ambr systems for fed-batch cultures to support high viable cell density and protein titer [12] [9]. |
This case study details the implementation of an automated high-throughput (HTP) stable CHO cell platform, which successfully compressed the cell line development timeline by approximately two months compared to traditional processes. The core achievement was the parallel processing of over 1,000 stable pool transfections to deliver material from DNA to large-scale fed-batch production in just 7–10 weeks [9].
The table below summarizes the key quantitative outcomes from the platform implementation.
Table 1: Summary of Key Experimental Outcomes
| Metric | Traditional Process | HTP Platform | Improvement |
|---|---|---|---|
| Total Timeline (DNA to Production) | ~3-4 months [9] | 7-10 weeks [9] | Shortened by ~2 months [9] |
| Stable Pool Throughput | Low-throughput, sequential | >1,000 pools in parallel [9] | Massive parallelization |
| Lead mAb Titer | Baseline (e.g., ~0.9 g/L for a challenging mAb) [9] | Up to 6 g/L after vector optimization [9] | ~7-fold increase |
| Material for Primary Screening | Required waiting for stable pools | Available by Day 7 post-transfection [9] | Enabled earlier decision-making |
| Bispecific mAb Titer | ~0.9 g/L (GS-only selection) [9] | 2.7 g/L (with dual-antibiotic selection) [9] | ~3-fold increase |
Detailed Experimental Protocols
Core Workflow for High-Throughput mAb Expression
The following protocol was used to screen 575 monoclonal antibodies (mAbs) and deliver large-scale material [9].
Transfection:
- Technology: Leap-In transposase technology was used for multiple site-specific genomic integrations [9].
- Scale: Co-transfection of >1,000 stable pools in CHOZN cells was performed in a dual-vector format, with duplicates [9].
- Automation: An integrated automated workstation (Lynx) was employed for high-throughput handling [9].
Selection & Recovery:
- Process: Cells underwent selection and recovery post-transfection.
- Monitoring: The process was monitored using a NyOne imaging system and Octet for titer analysis [9].
Early-Stage Material Supply:
Pool Recovery and Expansion:
- By Day 14, stable pools were fully recovered.
- Working cell banks were frozen, and the system could continuously supply 1 mg to 2 mg of material from routine passages every 3-4 days [9].
Clone Selection and Scale-Up:
- The top four lead mAbs were advanced to large-scale fed-batch production in bioreactors for further testing (e.g., immunogenicity, PK) [9].
Protocol for Improving Bispecific mAb Yield
For complex molecules like bispecific antibodies, a dual-antibiotic selection strategy was implemented to prevent production drift and ensure balanced chain expression [9].
Vector Design:
- Two heavy chains (HC1 and HC2) were cloned into separate vectors, each flanked by a different antibiotic resistance marker (e.g., blasticidin (BSD) and puromycin (Puro)) [9].
Killing Curve Assessment:
- The optimal antibiotic concentrations for selection were determined by performing killing curve assays in CHOZN host cells [9].
Transfection and Selection:
- Stable transfections were performed in triplicate under different selection conditions:
- GS only (control)
- GS + BSD/Puro (low concentration)
- GS + BSD/Puro (high concentration) [9]
- The highest-yielding pool was identified via titer analysis.
- Stable transfections were performed in triplicate under different selection conditions:
Workflow Visualization
The diagram below illustrates the integrated workflow of the automated HTP platform, highlighting the parallel processing path and key technological integrations.
The Scientist's Toolkit: Key Research Reagents & Equipment
The successful implementation of this HTP platform relied on a suite of specialized reagents, instruments, and technologies.
Table 2: Essential Research Reagents and Solutions
| Category | Item | Function / Application |
|---|---|---|
| Core Technology | Leap-In Transposase | Enables multiple site-specific genomic integrations for highly stable pools [9]. |
| Host Cell Line | CHOZN Cells | The baseline host cell line for stable transfection [9]. |
| CHOplus Engineered Host | An engineered CHOZN host with enhanced ER capacity, boosting titers by up to 3.5-fold [9]. | |
| Selection Agents | Blasticidin (BSD) & Puromycin | Dual-antibiotic selection for bispecifics to maintain yield and fidelity [9]. |
| Automation & Analysis | Lynx Automated Workstation | Automates liquid handling for medium-to-high-throughput workflows [9]. |
| NyOne Imaging System / Cell Metric | Provides imaging for cell growth and confirmation of single-cell cloning [9] [22]. | |
| Octet System | Performs high-throughput, label-free titer analysis via Biolayer Interferometry (BLI) [9] [23]. | |
| VIPS (Verified In-Situ Plate Seeding) | Images droplets to guarantee monoclonality (single cell per well) for regulatory assurance [22]. | |
| Ambr 15 Cell Culture System | Automated micro-bioreactor system for scalable fed-batch cultivation and process optimization [9] [23]. |
Frequently Asked Questions (FAQs) & Troubleshooting
Q1: Our stable pools for bispecific antibodies show good initial titer but a rapid drop in yield. What could be the cause? A1: This is a classic symptom of production drift, where non-productive cells outcompete productive ones. Implement a dual-antibiotic selection strategy where each heavy chain is linked to a different resistance marker (e.g., Blasticidin and Puromycin). This maintains selective pressure for cells expressing both chains, preserving yield and product fidelity [9].
Q2: How can I supply material for early-stage assays while stable pools are still developing? A2: The HTP platform demonstrates that you can harvest small-scale material (~150 µg) directly from recovering stable pools as early as 7 days post-transfection. This eliminates the need for a separate, resource-intensive transient expression campaign, accelerating early screening and decision-making [9].
Q3: Our cell line development is bottlenecked by the slow, manual process of single-cell cloning and monoclonality assurance. Are there solutions? A3: Yes, integrate automated cell imagers and dispensers. Instruments like the VIPS (Verified In-Situ Plate Seeding) image the droplet deposited into each well to confirm it contains a single cell, providing crucial documentation for regulatory compliance. The CellCelector system can also automate the screening of tens of thousands of clones with high probability of monoclonality (99.7%) [22] [24].
Q4: We are screening many clones, but the top producers in plates do not perform well in bioreactors. How can we improve clone selection? A4: Incorporate a scale-down model earlier in your workflow. Using a 96-well deep-well plate to run a small-scale fed-batch culture that mirrors your production process (Ambr 15 bioreactor conditions) helps identify and exclude clones whose performance does not translate to larger scales. This refines your selection and increases the chance of finding truly high-performing clones [24].
Q5: What are the main barriers to adopting an automated HTP platform like this? A5: The primary challenges include the high initial equipment costs, the complexity of integrating multiple automated systems, and the need for specialized training. Additionally, licensing agreements for technologies like Leap-In transposase may be required. For some very low-expressing constructs, additional optimization cycles might still be necessary despite the platform's throughput [9].
Frequently Asked Questions (FAQs)
Q1: What are CHOplus engineered host cells, and how do they enhance productivity? CHOplus refers to engineered Chinese Hamster Ovary (CHO) host cells designed with enhanced cellular machinery to boost recombinant protein production. A key improvement is the increased endoplasmic reticulum (ER) capacity, which alleviates a major bottleneck in protein processing and secretion [9]. In practice, this engineering has been shown to enable stable pools to recover one week faster and achieve a 3.5-fold productivity increase in large-scale fed-batch cultures, with titers rising from 330 mg/L in base CHO hosts to over 1.18 g/L in CHOplus hosts [9].
Q2: How do engineered hosts fit into a timeline for optimizing stable cell pools? Advanced host cell engineering is a foundational strategy for compressing selection timelines for stable cell pools. By starting with a host that has inherently higher productivity and faster growth, the entire cell line development process is accelerated. One automated high-throughput (HTP) platform demonstrated that using such engineered hosts enables moving from DNA to large-scale fed-batch production in just 7 to 10 weeks, cutting about a month off the conventional timeline [9].
Q3: What specific cellular pathways are targeted by host cell engineering to increase productivity? Engineering strategies often target pathways controlling cell proliferation, protein synthesis, and secretion. Key targets include:
- Transcription and Translation Factors: Overexpression of factors like eIF3i and eIF3c enhances cell growth and recombinant protein synthesis [25].
- Transcription Factors: Co-overexpression of MYC and XBP1s has been shown to increase both cell proliferation and recombinant protein production [25].
- Secretory Pathway Capacity: As seen with CHOplus, directly engineering the ER capacity helps the cell manage the load of producing complex therapeutic proteins [9].
Q4: Are there any drawbacks to using these advanced engineered host systems? While offering significant benefits, adoption can be constrained by upfront equipment costs for automated platforms, integration complexity, and training needs [9]. Licensing agreements for technologies like transposase systems may also be required [9]. For some very low-expressing or unstable constructs, additional optimization cycles might still be necessary even with an engineered host [9].
Troubleshooting Guides
Problem 1: Low Titer in Stable Pools
Potential Causes and Solutions:
- Cause: Inefficient Transgene Integration
- Solution: Move from random integration to targeted integration technologies like Leap-In transposase. This technology supports multiple site-specific integrations, producing highly stable pools with higher titers in shorter timelines [9].
- Cause: Limitations in Host Cell Capacity
- Solution: Utilize an engineered host like CHOplus. Case studies show that switching from a conventional CHO host to CHOplus #1 increased titers from 330 mg/L to 1.14-1.18 g/L for a bispecific molecule [9].
- Cause: Suboptimal Vector Design
- Solution: Perform high-throughput vector optimization. Screen different backbone vectors, promoters, and signal peptides. One study screened 60 combinations and achieved a titer of >6 g/L, a nearly sevenfold improvement over the baseline [9].
Problem 2: Slow Recovery and Outgrowth of Stable Pools
Potential Causes and Solutions:
- Cause: Poor Clonal Outgrowth Post-Single Cell Seeding
- Solution: Supplement cloning media with specialized additives like InstiGRO CHO PLUS. Testing showed the improved formulation of this supplement significantly enhanced both clonal outgrowth percentage and average colony size, speeding up the expansion of monoclonal lines [26].
- Cause: Inherent Host Cell Growth Characteristics
- Solution: Implement host cell engineering. CHOplus hosts have demonstrated a one-week faster recovery of stable pools compared to standard CHOZN hosts [9].
Problem 3: Poor Fidelity in Bispecific Antibody Production
Potential Cause and Solution:
- Cause: Production Drift and Non-Productive Cells
- Solution: Implement a dual-antibiotic selection strategy. Design vectors with each heavy chain (HC1 and HC2) flanked by different antibiotic resistance markers (e.g., blasticidin and puromycin). This ensures selective pressure for cells expressing all necessary chains. One case study using this method achieved a titer of 2.7 g/L, over three times higher than the control with single selection [9].
The following tables consolidate key performance metrics from published case studies.
Table 1: Performance Comparison of Engineered Hosts
| Host Cell Type | Time to Pool Recovery | Fed-Batch Titer (Example) | Key Feature | Source |
|---|---|---|---|---|
| CHOplus #1 | ~1 week faster | 1.14 - 1.18 g/L | Enhanced ER capacity | [9] |
| CHOplus #2 | ~1 week faster | 690 mg/L | Enhanced ER capacity | [9] |
| Base CHOZN | Standard timeline | 330 mg/L | Conventional host | [9] |
Table 2: Impact of Selection Strategies on Bispecific Antibody Titer
| Selection Strategy | Average Titer Achieved | Key Benefit | Source |
|---|---|---|---|
| Dual-Antibiotic (GS + BSD/Puro High) | 2.7 g/L | Ensures expression of all chains, improves fidelity | [9] |
| Single Selection (GS only) | < 0.9 g/L | Standard method, prone to production drift | [9] |
Experimental Protocols
Protocol 1: High-Throughput Stable Pool Generation Using Transposase Technology
This protocol outlines the generation of stable pools using Leap-In transposase technology for compressed timelines [9].
- Host Cell Preparation: Use an engineered host cell line (e.g., CHOplus) cultivated in serum-free medium.
- Vector Design: Clone the gene of interest into a transposase donor vector. For bispecifics, use a dual-vector system with separate antibiotic markers for each heavy chain.
- Transfection: Co-transfect host cells with the donor vector and a transposase vector. The HTP platform allows for >1,000 transfections in parallel.
- Selection & Recovery: Between 24-48 hours post-transfection, add appropriate antibiotics for selection. Monitor cell growth and viability using automated systems (e.g., Lynx workstation, NyOne imager).
- Small-Scale Material Generation: As early as 7 days post-transfection, harvest small amounts of material (~150 μg) from recovering pools for early screening.
- Pool Expansion: By day 14, stable pools are typically recovered. Freeze working cell banks and use the pools for material supply (1-2 mg every 3-4 days) or advance to clone screening.
Protocol 2: Dual-Antibiotic Selection for Bispecific Antibodies
This protocol details the strategy to minimize production drift in bispecific antibody production [9].
- Killing Curve Assay: First, perform killing curve assays in your CHO host for antibiotics like blasticidin (BSD) and puromycin (Puro) to determine the minimum concentration that kills all non-transfected cells within 7-14 days.
- Vector Construction: Create two expression vectors:
- Vector A: HC1 and Light Chain 1 + BSD resistance gene.
- Vector B: HC2 and Light Chain 2 + Puro resistance gene.
- Co-transfection: Transfect host cells with both Vector A and Vector B at a balanced ratio (e.g., 1:1).
- Dual Selection: Apply both BSD and Puro antibiotics at the predetermined concentrations 24-48 hours after transfection.
- Pool Evaluation: Maintain selection pressure for 14-21 days. Monitor titer and product quality (e.g., correct chain assembly) to confirm improved fidelity and yield.
Signaling Pathways and Workflows
The Scientist's Toolkit: Essential Research Reagents and Materials
Table 3: Key Reagents for Advanced Host Cell Engineering and CLD
| Item | Function | Example / Note |
|---|---|---|
| CHOplus Engineered Host | Host cell line with enhanced ER and secretory capacity for higher productivity and faster recovery. | Clone #1 showed 3.5x titer increase in case study [9]. |
| Transposase System | Enables efficient, site-specific gene integration for generating highly stable pools. | e.g., Leap-In transposase technology [9]. |
| InstiGRO CHO PLUS | Cell culture supplement formulated to enhance clonal outgrowth and average colony size after single-cell seeding. | Improved formulation increases cloning efficiency [26]. |
| Dual-Antibiotic Selection | Uses two antibiotics (e.g., Blasticidin, Puromycin) to ensure high-fidelity production of multi-chain proteins like bispecific antibodies. | Critical for preventing production drift [9]. |
| Automated Bioreactor Systems | High-throughput, small-scale bioreactors for clone screening and process optimization. | e.g., Ambr 15 and Ambr 250 systems [12]. |
| Automated Cell Imager & Sorter | Instrument for imaging clonal colonies and reliably selecting high-producing monoclonal cell lines. | e.g., CellCelector platform [12]. |
CRISPR-Cas9 Ribonucleoprotein (RNP) Delivery for Rapid and Precise Host Cell Line Engineering
Frequently Asked Questions (FAQs)
Q1: What are the main advantages of using RNP over plasmid DNA (pDNA) for CRISPR delivery? Direct delivery of pre-assembled Cas9 protein and guide RNA as a Ribonucleoprotein (RNP) complex offers several critical advantages for generating stable cell pools:
- Reduced Off-Target Effects & High Fidelity: The RNP complex is active immediately upon delivery but has a short intracellular lifetime, minimizing prolonged Cas9 activity that can lead to unwanted mutations at off-target sites. Sequencing studies have shown this approach results in editing with high fidelity and no detected off-target activity [27].
- Transient Activity & No DNA Integration: Unlike plasmid DNA, the RNP complex does not require transcription or translation and degrades quickly. This eliminates the risk of foreign DNA integrating into the host genome, a key safety concern for therapeutic applications [28] [29] [30].
- High Editing Efficiency: RNP delivery often results in higher editing efficiency, especially in hard-to-transfect cells like primary cells, stem cells, and iPSCs, as it bypasses cellular processes required for nucleic acid-based systems [29] [31].
- Lower Cytotoxicity: RNP delivery typically induces less cellular toxicity and triggers weaker immune responses compared to plasmid DNA or viral vectors [28] [32].
Q2: My knock-in efficiency for generating a stable pool is low. How can I improve homology-directed repair (HDR)? HDR is inherently less efficient than error-prone non-homologous end joining (NHEJ). To enhance HDR rates for precise gene insertion:
- Synchronize the Cell Cycle: Time your RNP delivery to coincide with the S and G2 phases of the cell cycle, when HDR is most active. Using chemicals like nocodazole for synchronization has been shown to increase HDR efficiency by more than sixfold in some cell types [27].
- Optimize Donor Template Design: Use linearized double-stranded DNA (dsDNA) donors with long homology arms (up to 1000 bp). The TILD-CRISPR method, which uses linearized dsDNA, has been shown to achieve knock-in efficiencies as high as 50% in CHO-K1 cells [28].
- Use a High-Efficiency Delivery System: Employ advanced non-viral delivery systems, such as cationic polymers or lipid nanoparticles, which can significantly boost RNP delivery and subsequent HDR efficiency compared to standard reagents [28].
- Modulate DNA Repair Pathways: Consider using small molecule inhibitors that temporarily suppress key proteins in the NHEJ pathway, thereby shifting the balance toward HDR. However, this requires careful optimization to avoid cytotoxicity [32].
Q3: What delivery method should I use for my specific cell type? The choice of delivery method depends on your cell type and experimental goal. The table below summarizes the primary options.
Table 1: Comparison of CRISPR-Cas9 RNP Delivery Methods
| Delivery Method | Mechanism | Best For | Advantages | Disadvantages |
|---|---|---|---|---|
| Electroporation | Electrical pulses create temporary pores in the cell membrane [29]. | A wide range of cell lines, including immune cells and stem cells; high-efficiency editing for stable pool generation. | High efficiency, applicable to many cell types. | Can cause significant cell death; requires optimization of voltage and pulse parameters. |
| Lipid Nanoparticles (LNPs) | Synthetic lipids encapsulate RNP and fuse with the cell membrane [29] [30]. | In vivo delivery and in vitro applications for difficult-to-transfect cells. | Low immunogenicity, potential for organ targeting. | Must escape endosomes to avoid degradation; formulation can be complex. |
| Cationic Polymers | Positively charged polymers (e.g., cyclodextrin-based) complex with negatively charged RNP [28]. | In vitro and ex vivo editing; can offer high efficiency with low cytotoxicity. | High encapsulation efficiency (>90%), low toxicity (e.g., >80% cell viability) [28]. | Requires careful polymer synthesis and characterization. |
| Microinjection | Physical injection using a fine glass needle [29] [32]. | Single-cell systems like zygotes and embryos for creating transgenic models. | Quantitative control over the delivered dose. | Low throughput, technically demanding, and equipment-intensive. |
Q4: I am concerned about off-target activity. How can I minimize it? To enhance the specificity of your CRISPR editing:
- Use RNP Complexes: The transient nature of RNP complexes is the most effective strategy to reduce off-target effects [27] [30].
- Titrate RNP Amount: Use the lowest effective concentration of RNP. High concentrations increase the risk of off-target cleavage [33].
- Utilize High-Fidelity Cas9 Variants: Engineered Cas9 nickases can be used. These enzymes create single-strand breaks instead of double-strand breaks. Using two adjacent guide RNAs with a nickase raises specificity, as off-target single-strand breaks are less error-prone during repair [33].
- Employ Careful gRNA Design: Select guide RNA sequences with optimal specificity. Tools for design should minimize off-target potential by ensuring maximal mismatches, especially in the PAM-proximal "seed" region, and avoid target sites with significant homology to other genomic regions [33] [31].
Troubleshooting Guides
Potential Causes and Solutions:
- Cause: Inefficient RNP Delivery.
- Cause: Poor gRNA Design or Activity.
- Cause: Low Cell Viability Post-Transfection.
- Solution: Titrate down the amount of RNP complex or transfection reagent. Ensure cells are healthy and in an optimal growth phase before transfection. Using delivery systems with low inherent cytotoxicity, such as certain cationic polymers, can maintain cell viability above 80% [28].
Problem 2: High Off-Target Editing
Potential Causes and Solutions:
- Cause: Prolonged Cas9 Activity.
- Cause: High RNP Concentration.
- Solution: Perform a dose-response experiment to find the minimum RNP concentration that yields satisfactory on-target editing. This optimizes the on-target to off-target cleavage ratio [33].
- Cause: gRNA with High Off-Target Potential.
- Solution: Re-design your gRNA. Select a guide where identified potential off-target sites in the genome contain at least two mismatches, preferably consecutive or spaced less than four bases apart, within the PAM-proximal region [33].
Problem 3: Poor HDR Efficiency Despite Good Cutting
Potential Causes and Solutions:
- Cause: RNP Delivery at a Suboptimal Cell Cycle Phase.
- Solution: Synchronize your cells. Treat cells with a cell cycle-arresting agent like nocodazole (M-phase) or aphidicolin (S-phase) before RNP delivery. Releasing the arrest just before nucleofection dramatically increases the proportion of cells in S/G2 phase, where HDR is active. This controlled timing has been shown to increase HDR rates from single digits to over 30% in some cell lines [27]. *Solution: Use a modified cationic hyper-branched cyclodextrin-based polymer (Ppoly) system to deliver an integrating GFP gene using the TILD-CRISPR method, which couples donor DNA linearization with RNP complexes. This method achieved 50% integration efficiency in CHO-K1 cells [28].
- Cause: Suboptimal Donor Template.
- Solution: Linearize your donor DNA template. Using PCR-amplified or enzyme-linearized dsDNA donors with long homology arms (e.g., 800-1000 bp) is much more effective for HDR than circular plasmids [28]. For single-stranded oligonucleotide (ssODN) donors, test both "sense" and "antisense" orientations, as one may be more efficient [27].
The following workflow diagram illustrates a proven protocol for enhancing HDR efficiency through cell cycle synchronization and RNP delivery.
Diagram 1: HDR Enhancement Workflow
Problem 4: Low Cell Viability After RNP Delivery
Potential Causes and Solutions:
- Cause: Cytotoxicity from the Delivery Method.
- Solution: For electroporation, systematically optimize program parameters. For chemical transfection, switch to a gentler reagent. Cationic hyper-branched cyclodextrin-based polymers (Ppoly) have demonstrated high encapsulation efficiency with over 80% cell viability post-transfection [28].
- Cause: Excessive RNP or Reagent Amount.
- Solution: Reduce the concentration of the RNP complex and/or the transfection reagent. A high amount of Cas9 can induce a severe DNA damage response, leading to apoptosis.
- Cause: Cellular Stress from Handling.
- Solution: Ensure cells are passaged at an optimal density and are in the log phase of growth. After transfection, plate cells at a lower density in fresh, pre-warmed medium to aid recovery.
Experimental Protocols
This protocol is highly effective for improving precise gene knock-in in human cell lines like HEK293T.
Key Research Reagent Solutions:
- Cas9 Nuclease: Purified S. pyogenes Cas9 protein.
- Synchronization Agent: Nocodazole, a reversible M-phase blocker.
- HDR Template: Single-stranded oligonucleotide (ssODN) or linearized dsDNA with homology arms.
- Nucleofector System: Such as the Lonza 4D-Nucleofector.
Table 2: Reagents for Synchronized HDR Protocol
| Item | Function | Example/Note |
|---|---|---|
| Cas9 Protein | The core nuclease enzyme that creates the DNA double-strand break. | High-purity, recombinant protein. |
| sgRNA | Synthetic single-guide RNA that directs Cas9 to the specific genomic target. | Designed with a specific 20-nt spacer sequence. |
| Nocodazole | A chemical that arrests cells in the M phase of the cell cycle by disrupting microtubules. | Allows for timed delivery of RNP after release. |
| ssODN Donor | A single-stranded DNA template containing the desired edit, flanked by homology arms. | Typically 90-200 nucleotides in length. |
| Nucleofection Kit | A cell-type specific kit containing optimized buffer for electroporation. | e.g., Lonza SE Cell Line Kit. |
Step-by-Step Methodology:
- Cell Culture: Grow HEK293T cells to approximately 70-80% confluence.
- Synchronization: Treat cells with 100 ng/μL nocodazole for 16-18 hours. This will arrest most cells in M phase.
- Release: Gently wash the cells to remove nocodazole and add fresh pre-warmed medium. This allows the synchronized cells to re-enter the cell cycle.
- RNP Complex Assembly: Pre-complex purified Cas9 protein with sgRNA at a molar ratio of 1:1.2 (e.g., 30 pmol Cas9: 36 pmol sgRNA) in a suitable buffer. Incubate at room temperature for 10-20 minutes to form the RNP.
- Nucleofection: Immediately after release from nocodazole arrest, trypsinize and count the cells. Resuspend 2x10^5 cells in 30 μL of nucleofection solution. Mix the cell suspension with the pre-assembled RNP complex and 50-200 pmol of HDR donor template. Transfer to a nucleofection cuvette and electroporate using the recommended program (e.g., CM-130 for HEK293T).
- Recovery and Analysis: Quickly transfer the electroporated cells to pre-warmed culture medium. Analyze editing efficiency 48-72 hours post-nucleofection via sequencing or functional assays.
This protocol uses a synthetic polymer for highly efficient RNP delivery with low cytotoxicity.
Step-by-Step Methodology:
- RNP Complex Preparation: Assemble the Cas9 RNP complex as described in Protocol 1.
- Polymer Complexation: Mix the RNP complex with a cationic hyper-branched cyclodextrin-based polymer (Ppoly) at a defined weight ratio. Incubate for 30 minutes at room temperature to allow the formation of stable RNP/Ppoly nanoparticles.
- Characterization (Optional): Verify the particle size (e.g., ~107 nm for Ppoly alone, increasing upon RNP loading) and surface charge using dynamic light scattering (DLS). Encapsulation efficiency can be over 90% [28].
- Cell Transfection: Add the RNP/Ppoly nanoparticles to cells in a standard culture plate. Incubate for 48-72 hours. No specialized equipment is needed.
- Analysis: Assess knock-in efficiency via junction PCR, flow cytometry for reporter genes (e.g., GFP), or next-generation sequencing.
The Scientist's Toolkit: Essential Research Reagents
Table 3: Key Reagents for CRISPR-Cas9 RNP Workflows
| Reagent / Solution | Critical Function | Technical Notes |
|---|---|---|
| Purified Cas9 Protein | The engineered nuclease that executes the DNA cut. | Available as wild-type or high-fidelity (e.g., SpyFi Cas9) variants to reduce off-target effects. |
| Synthetic sgRNA | Provides the targeting specificity for the Cas9 nuclease. | Chemically modified sgRNAs can enhance stability and editing efficiency. |
| HDR Donor Template | Serves as the repair template for precise gene insertion or correction. | Can be ssODN for small edits or linear dsDNA with long homology arms (≥800 bp) for larger insertions. |
| Electroporation System | Enables high-efficiency physical delivery of RNP into a wide range of cell types. | Systems like the Lonza 4D-Nucleofector are standard. Cell-type specific kits are essential. |
| Cationic Polymer/LNP | Synthetic nanocarrier for chemical-based RNP delivery; can offer high efficiency and low toxicity. | e.g., Cyclodextrin-based polymers (Ppoly) or commercial lipid nanoparticles (LNPs). |
| Cell Synchronization Agents | Chemicals used to arrest cells at a specific phase of the cell cycle to boost HDR efficiency. | Nocodazole (M-phase) and Aphidicolin (S-phase) are commonly used. |
| Selection Antibiotics | Allows for the enrichment of successfully transfected cells in a stable pool. | e.g., Puromycin, Blasticidin, G418. Requires a co-delivered or integrated resistance marker. |
The following diagram outlines the core decision-making process for selecting an RNP delivery method based on key experimental goals.
Diagram 2: RNP Delivery Selection Guide
Overcoming Technical Hurdles in Selection and Expression
Frequently Asked Questions (FAQs)
Q1: What makes certain cell lines "difficult-to-transfect," and which cell types are most commonly affected? Certain cell lines are classified as "difficult-to-transfect" due to their inherent biological characteristics that create barriers to the uptake and expression of exogenous nucleic acids. The primary challenges include:
- Strong Physical Barriers: Cells like primary cells often have dense, stable membrane structures that hinder the attachment and internalization of transfection complexes [34].
- Sensitivity to In Vitro Conditions: Primary cells and stem cells are highly sensitive to the physical and chemical stress induced by transfection, which can trigger stress responses or apoptosis [34].
- Unique Growth Properties: Suspension cells lack an adhesion substrate, reducing contact time with transfection complexes, while stem cells have compact chromatin structures that limit foreign DNA integration [34]. Commonly affected cell types include primary cells, pluripotent stem cells (e.g., embryonic stem cells, induced pluripotent stem cells), and various suspension cell lines (e.g., immune cells) [34].
Q2: For stable cell pool generation, what are the key advantages of using CRISPR Ribonucleoprotein (RNP) complexes over plasmid DNA? Using CRISPR RNP complexes for stable cell pool generation offers several critical advantages for timeline compression and editing quality:
- Rapid Activity and Reduced Off-Target Effects: RNP complexes are active immediately upon delivery and are quickly degraded by the cell. This transient activity results in higher precision and a lower risk of off-target edits compared to plasmid DNA, which can lead to prolonged Cas9 expression and increased cytotoxicity [30] [1].
- Elimination of Unnecessary Steps: Unlike plasmid delivery, RNPs do not require nuclear entry and transcription, simplifying the process and accelerating the onset of editing [30].
- High Efficiency in Pooled Formats: Transfection with pre-assembled RNPs has been shown to achieve high knockout efficiencies at the pool stage, enabling phenotypic screening without the immediate need for single-cell cloning, thus significantly compressing development timelines [1].
Q3: What optimization strategies can improve transfection efficiency in sensitive cell lines? Several proven strategies can enhance transfection efficiency while maintaining cell viability:
- Use Serum-Compatible Reagents: Select reagents that work in standard culture medium (e.g., with 10% serum) to avoid the stress of serum-starvation and maintain cell health [34].
- Optimize Reagent: Nucleic Acid Ratio: Systematically test different mass or charge (N/P) ratios to find the optimal formulation that generates stable, non-toxic complexes for your specific cell line [34] [35].
- Shorten Exposure Time: Reduce the incubation time of cells with the transfection complex (e.g., to 1-4 hours) to minimize cytotoxicity, then replace with fresh medium [34].
- Employ Electroporation: For cells refractory to chemical methods, electroporation can be highly effective. It uses electrical pulses to create transient pores in the cell membrane, allowing direct entry of molecules into the cytoplasm [36] [34] [1].
Q4: How can I improve the endosomal escape of delivered cargo to increase transfection success? A major bottleneck in non-viral transfection is the entrapment and degradation of cargo in endosomes. Using endosomal escape enhancers can significantly boost efficiency:
- Classic Reagents: Chloroquine, a weak base, can neutralize the acidic endosomal environment and disrupt the endosomal membrane [34].
- Advanced Formulations: Modern transfection reagents often incorporate novel ionizable lipids (e.g., DLin-MC3-DMA) or cationic polymers (e.g., PEI derivatives). These materials create a "proton sponge" effect in the low pH of the endosome, causing it to swell and rupture, thereby releasing the cargo into the cytoplasm [34].
Troubleshooting Guides
Table 1: Common Transfection Problems and Solutions
| Problem | Possible Causes | Recommended Solutions |
|---|---|---|
| Low Transfection Efficiency | - Suboptimal cell health or confluency- Incorrect reagent:DNA/RNP ratio- Inefficient cellular uptake or endosomal escape | - Use cells in logarithmic growth phase at 70-90% confluency [35].- Perform a gradient screen of reagent: cargo ratios [34] [35].- Switch to a different reagent or use an endosomal escape enhancer [34]. |
| High Cell Toxicity | - Cytotoxic transfection reagent- Prolonged exposure to complexes- Overly aggressive physical parameters | - Shorten the incubation time with complexes to 1-6 hours [37] [34].- Switch to a gentler reagent or method (e.g., Lipofectamine 3000 showed lower toxicity than jetOPTIMUS) [37].- For electroporation, optimize voltage and pulse duration [36]. |
| Inconsistent Results Between Experiments | - Variable cell passage number or state- Inconsistent preparation of complexes- Fluctuations in reagent quality | - Use low-passage cells and ensure consistent culture conditions [35].- Standardize complex preparation steps (incubation time, temperature, volumes) [35].- Use high-quality, endotoxin-free nucleic acids [35]. |
Table 2: Optimized Electroporation Parameters for RNP Delivery
The following table summarizes published parameters for delivering CRISPR RNP complexes via electroporation into different cell types, demonstrating how conditions must be tailored.
| Cell Type | Electroporation System | Key Parameters (Voltage, Pulse) | Reported Outcome | Citation |
|---|---|---|---|---|
| CHO DG44 (Suspension) | Neon Transfection System | 1700 V, 20 ms, 1 pulse | High knockout efficiency in stable pool workflow [1]. | - |
| Bovine Zygotes | Neon Transfection System | 700 V, 20 ms, 1 pulse | 65.2% editing efficiency; but reduced blastocyst development rate [36]. | - |
| Bovine Zygotes | NEPA21 | Multiple poring & transfer pulses | 50% editing efficiency; good embryo development [36]. | - |
Experimental Protocols
Protocol 1: High-Throughput RNP Transfection for Stable CHO Pool Generation
This protocol is adapted for transfecting suspension CHO cells using electroporation to create knockout pools for accelerated screening [1].
Key Reagents:
- CHO cells adapted to serum-free suspension culture.
- Synthetic sgRNA and Cas9 protein (e.g., TrueCut Cas9 Protein v2).
- Electroporation system with appropriate kits (e.g., Neon Transfection System).
- Cell culture medium and plates.
Methodology:
- Cell Preparation: Culture CHO cells to maintain log-phase growth. On the day of transfection, collect 2.0 x 10⁵ cells per reaction.
- RNP Complex Assembly: Pre-complex the synthetic sgRNA and Cas9 protein at a 1:1 molar ratio (e.g., 7.5 pmol each) and incubate at room temperature for 10-20 minutes.
- Electroporation: Wash the cell pellet and resuspend it in the provided electroporation buffer. Combine the cells with the pre-assembled RNP complexes and electroporate using the optimized parameters: 1700 V, 20 ms, and 1 pulse [1].
- Post-Transfection Recovery: Immediately transfer the electroporated cells to pre-warmed culture medium in a multi-well plate (e.g., 24-well plate).
- Pool Expansion and Analysis: Expand the transfected pool without antibiotic selection. Analyze editing efficiency 48-72 hours post-transfection via genomic DNA extraction, PCR, and sequencing (e.g., TIDE or ICE analysis) [1].
Protocol 2: Lipofection of Airway Epithelial Cells with Plasmid DNA
This protocol outlines chemical transfection of adherent, difficult-to-transfect airway epithelial cells, highlighting key optimization steps [37].
Key Reagents:
- Airway epithelial cell lines (e.g., 16HBE14o-, 1HAEo-).
- Plasmid DNA (e.g., EX-EGFP-Lv105, an EGFP-expressing plasmid).
- Transfection reagent (e.g., Lipofectamine 3000).
- Opti-MEM reduced-serum medium.
- Trypsin-EDTA (0.25%).
Methodology:
- Cell Seeding: Seed cells at 2.5 x 10⁴ cells per well in a 48-well plate 18-24 hours before transfection. Aim for ~40% confluency at the time of transfection.
- Pre-Transfection Treatment (Optional): To improve efficiency, briefly pre-treat cultures with two rinses of 0.25% trypsin-EDTA before seeding. This has been shown to significantly boost transfection in 1HAEo- and 16HBE14o- cells [37].
- Complex Formation: For Lipofectamine 3000, dilute 2.5 µg plasmid DNA and the reagent in separate tubes containing Opti-MEM. Then, combine the diluted DNA with the diluted reagent and incubate for 10-15 minutes at room temperature to form complexes.
- Transfection: Add the complex drop-wise to the cells in complete medium.
- Incubation and Analysis: Incubate cells for 24-48 hours. Replace medium 6 hours post-transfection if cytotoxicity is a concern. Analyze transfection efficiency (e.g., via EGFP fluorescence) and viability (e.g., using alamarBlue assay) [37].
Performance Data
Table 3: Transfection Reagent Performance in Airway Epithelial Cell Lines
This table compares the efficiency and cytotoxicity of common transfection reagents in three airway epithelial cell lines, illustrating that optimal reagent choice is cell line-specific [37].
| Transfection Reagent | Cell Line | Transfection Efficiency (%) | Cell Viability (% Reduction vs. Control) |
|---|---|---|---|
| Lipofectamine 3000 (L3000) | 1HAEo- | 76.1 ± 3.2 | 11.3 ± 0.16% |
| 16HBE14o- | 35.5 ± 1.2 | 16.3 ± 0.08% | |
| NCI-H292 | 28.9 ± 2.23 | 17.5 ± 0.09% | |
| jetOPTIMUS | 1HAEo- | 90.7 ± 4.2 | 37.4 ± 0.11% |
| 16HBE14o- | 64.6 ± 3.2 | 33.4 ± 0.09% | |
| NCI-H292 | 22.6 ± 1.2 | 28.3 ± 0.9% |
Workflow and Pathway Visualizations
Diagram 1: RNP Delivery and Genome Editing Workflow
This diagram illustrates the key steps and decision points in a high-throughput workflow for generating stable knockout pools using RNP transfection.
Diagram 2: Transfection Optimization Strategy Map
This map outlines a systematic, four-step approach to troubleshoot and optimize transfection conditions for difficult cell lines.
The Scientist's Toolkit
Table 4: Essential Reagents for Transfection and RNP Delivery
| Research Reagent | Function/Application |
|---|---|
| Lipofectamine 3000 | A lipid-based reagent shown to provide a good balance of high transfection efficiency and low cytotoxicity in various adherent cell lines [37]. |
| Lipofectamine CRISPRMAX | A reagent specifically formulated for the delivery of CRISPR RNP complexes, enabling gene editing without electroporation [36]. |
| TrueCut Cas9 Protein v2 | A high-quality, recombinant Cas9 nuclease used for pre-assembling RNP complexes with synthetic sgRNAs for highly precise editing [1]. |
| Neon Transfection System | An electroporation device used for high-efficiency transfection of difficult cells, including suspension CHO cells and primary cells, with RNPs [1]. |
| Endosomal Escape Enhancers | Compounds (e.g., chloroquine) or specialized lipids that promote the release of transfection complexes from endosomes into the cytoplasm, boosting efficiency [34]. |
| Serum-Compatible Formulations | Transfection reagents engineered to maintain stability and performance in standard cell culture media containing serum, reducing stress on sensitive cells [34]. |
For researchers focused on optimizing selection timelines for stable cell pools, achieving high fidelity in bispecific antibody (bsAb) production is a significant challenge. The inherent complexity of bsAbs, which are composed of more than two component chains, often leads to issues like production drift, where non-productive clones dominate during selection, reducing yield and product quality [9] [38]. This technical support article details how dual-antibiotic selection strategies serve as a powerful tool to counteract these issues, compress development timelines, and ensure the generation of high-quality, stable cell pools.
FAQs & Troubleshooting Guides
Frequently Asked Questions
Q1: What is the primary benefit of using a dual-antibiotic selection strategy for bispecific antibodies? The primary benefit is the significant improvement in product fidelity and titer. By using two different antibiotic resistance markers, each linked to a different heavy chain of the bsAb, the selection pressure ensures that only cells expressing all necessary components survive. This minimizes the outgrowth of non-productive clones and dramatically increases the yield of correctly assembled bsAb. One case study reported a threefold increase in titer (from 0.9 g/L to 2.7 g/L) compared to single selection systems [9].
Q2: How does dual-antibiotic selection compress the stable cell pool development timeline? This approach eliminates the need for separate transient expression campaigns. High-throughput, automated platforms can transfect over 1,000 stable pools in parallel. Using dual selection, small-scale material for primary screening can be available as early as seven days post-transfection, and recovered stable pools can be ready in about 14 days. This can shorten the overall timeline from DNA to large-scale fed-batch production by approximately one to two months [9].
Q3: Which antibiotics are most effective in a dual-selection system? Based on killing curve assessments in CHO cells, blasticidin (BSD) and puromycin (Puro) have been shown to provide faster clone recovery compared to alternatives like hygromycin or neomycin. The choice and concentration of antibiotics should be optimized through a killing curve assay for your specific host cell line [9].
Q4: What are common reasons for low bsAb yield even after employing dual-antibiotic selection? Low yields can persist due to several factors:
- Suboptimal Vector Ratios: Even with dual selection, the plasmid ratio of the different component chains during transfection is critical. An imbalance can lead to incorrect assembly and fragmental impurities [38].
- Inefficient Host Cell Line: The host cell line itself may lack the cellular machinery (e.g., sufficient endoplasmic reticulum capacity) to handle the high metabolic load and correct folding of complex bsAbs [9].
- Aggregation and Instability: The complex structure of bsAbs makes them inherently prone to aggregation during production, which can reduce the yield of functional molecules [39].
Troubleshooting Guide
| Problem | Possible Cause | Suggested Solution |
|---|---|---|
| Low bsAb Titer | Incorrect chain pairing; non-productive cells dominating | Implement a dual-antibiotic selection system with BSD and Puro [9]. |
| High Proportion of Fragmental Impurities | Imbalanced transfection with component chain-encoding plasmids | Optimize plasmid DNA ratios during transfection (e.g., a 1:3:3 molar ratio for a three-chain FIT-Ig) [38]. |
| Slow Cell Pool Recovery | Overly harsh antibiotic selection pressure | Perform a killing curve assay for each antibiotic and host cell line combination to determine the optimal selection concentration [9]. |
| Poor Product Fidelity in Scale-Up | Genetic instability of the stable cell pool | Conduct a stability study by passaging cells for >60 days and monitor titer and critical quality attributes to select stable clones [38]. |
| BsAb Aggregation | Inherent molecular instability or stress during processing | Optimize the formulation buffer using high-throughput screening of excipients and buffer conditions to improve stability [39]. |
Key Experimental Protocols & Data
Protocol: Implementing a Dual-Antibiotic Selection Strategy
This protocol outlines the key steps for setting up a dual-antibiotic selection system for a bsAb with two different heavy chains (HC1 and HC2).
Principle: Two expression vectors are designed, one containing HC1 flanked by a blasticidin resistance marker, and the other containing HC2 flanked by a puromycin resistance marker. Co-transfection followed by selection with both antibiotics ensures that only cells that have incorporated and expressed both vectors will survive, thereby favoring the production of the complete, correctly assembled bsAb [9].
Materials:
- Vectors: pC1 (containing HC1 and BSD resistance), pC2 (containing HC2 and Puro resistance).
- Host Cells: CHOZN or similar CHO host cell line.
- Antibiotics: Blasticidin and Puromycin.
- Equipment: Automated workstation (e.g., Lynx), imaging system (e.g., NyOne), titer analysis instrument (e.g., Octet).
Method:
- Killing Curve Assay: Prior to transfection, determine the minimum antibiotic concentration that kills untransfected CHO cells in 10-14 days for both blasticidin and puromycin.
- Vector Co-transfection: Co-transfect the pC1 and pC2 vectors into the host CHO cells at a 1:1 mass ratio using a high-throughput method (e.g., transposase-mediated transfection).
- Dual-Antibiotic Selection: At 24 hours post-transfection, add culture medium containing both blasticidin and puromycin at the predetermined concentrations.
- Monitor Recovery: Monitor cell growth and viability. Recovering stable pools can typically be observed within 14 days.
- Screening and Expansion: Screen minipools for titer and product quality. Expand high-producing pools for further analysis and cryopreservation.
Performance Data: Dual Selection vs. Single Selection
The table below summarizes quantitative data from a case study comparing dual-antibiotic selection to a standard single-selection system [9].
Table 1: Performance comparison of selection systems for a bispecific antibody.
| Selection System | Average Titer (g/L) | Key Observations |
|---|---|---|
| GS (Single Selection) | 0.9 | High proportion of non-productive clones; low yield. |
| GS + BSD/Puro (Low) | 1.8 | Improved titer and fidelity. |
| GS + BSD/Puro (High) | 2.7 | Highest titer; maintained consistent yield and product quality. |
Protocol: Optimizing Plasmid Ratios for Transfection
For bsAbs with three or more component chains, the ratio of plasmids used during transfection is critical for correct assembly.
Principle: Transfecting component chain-encoding plasmids at an optimized ratio can promote complete antibody assembly and reduce fragmental impurities. For a Fab-in-tandem immunoglobin (FIT-Ig), a 1:3:3 molar ratio (Chain #1 : Chain #2 : Chain #3) has been shown to be effective [38].
Method:
- Vector Design: Clone the coding sequences for each component chain into separate expression vectors with identical backbone elements (e.g., promoters, selection markers).
- Ratio Screening: Perform multiple transfections while varying the molar ratios of the three plasmids.
- Minipool Evaluation: Generate minipools for each ratio condition and evaluate them for expression titer (via ELISA or BLI) and product quality (e.g., percentage of correct assembly via HPLC-SEC).
- Identification of Optimal Ratio: Select the plasmid ratio that produces the highest titer and purity for large-scale stable cell pool generation.
The Scientist's Toolkit: Essential Research Reagents
Table 2: Key reagents and technologies for dual-antibiotic selection and bsAb development.
| Reagent / Technology | Function in Development | Example Use Case |
|---|---|---|
| Blasticidin & Puromycin | Paired antibiotics for dual-selection systems. | Selecting for CHO cells that have co-expressed both heavy chains of a bsAb [9]. |
| bYlok Bispecific Pairing Technology | An engineered Fc heterodimer platform that promotes correct heavy/light chain pairing. | Generating IgG-like bsAbs with >95% correct pairing, minimizing impurities [40] [41]. |
| Leap-In Transposase Technology | Enables high-throughput, site-specific integration of transgenes into the host cell genome. | Creating >1,000 stable pool transfections in parallel for rapid screening [9]. |
| CHOplus Engineered Host | A CHO host cell line with enhanced endoplasmic reticulum (ER) capacity. | Boosting titers and accelerating recovery for difficult-to-express complex biologics [9]. |
| DuoBody / CrossMab Technology | Platforms for controlled Fab-arm exchange and correct light chain association. | Facilitating the production of bsAbs with native IgG structures and minimal byproducts [40] [41]. |
Workflow & Mechanism Diagrams
Dual-Antibiotic Selection Workflow
Mechanism of Fidelity Control
FAQ: Our current cell line development timeline is too long. How can we accelerate the generation of high-titer stable cell pools?
Answer: Conventional CHO cell line development workflows are often slow and low-throughput, taking over three months from DNA to large-scale material. This creates significant bottlenecks for rapid discovery and development timelines [9].
A high-throughput (HTP), automated stable CHO platform can compress this timeline substantially. By leveraging technologies like Leap-In transposase for site-specific integration and integrating automation, it is possible to move from DNA to large-scale fed-batch production in just seven to 10 weeks, cutting about a month off the standard process [9].
Key features of such an accelerated platform include [9]:
- Handling >1,000 stable pool transfections in parallel.
- Using dual-antibiotic selection to improve bispecific antibody yield and fidelity.
- Incorporating engineered host cells (e.g., CHOplus) to boost titers.
- Enabling early material supply directly from recovering stable pools, eliminating the need for separate transient expression campaigns.
FAQ: We are struggling with low yields for a bispecific antibody. What vector strategy can improve productivity and fidelity?
Answer: Bispecific antibodies often suffer from production drift, where non-productive clones dominate during selection. A dual-antibiotic selection strategy can effectively address this [9].
Experimental Protocol: Dual-Antibiotic Selection for Bispecifics [9]
- Vector Design: Design your vectors with each heavy chain (HC1 and HC2) flanked by different antibiotic resistance markers, such as blasticidin (BSD) and puromycin (Puro).
- Killing Curve Assessment: Perform killing curve assessments in your host cell line (e.g., CHOZN) to determine the appropriate antibiotic concentrations for selection.
- Stable Transfection: Perform stable transfections testing different selection conditions (e.g., GS only, GS + BSD/Puro low, GS + BSD/Puro high).
- Evaluation: Screen pools for titer and product fidelity. Case studies have shown that high-concentration dual selection can yield pools with titers over 2.7 g/L—more than three times higher than a GS-only selection control [9].
FAQ: Our promoter choice seems to be limiting expression levels. How can we systematically identify a stronger or more specific promoter?
Answer: Relying solely on native promoters can limit expression levels and specificity. A data-driven approach using synthetic promoter libraries can identify optimized sequences.
Experimental Protocol: High-Throughput Synthetic Promoter Screening [42]
- Library Construction: Create a library of synthetic promoters. Each construct can consist of tandem repeats of a single transcription factor-binding site (TF-BS) upstream of a minimal promoter (e.g., from adenovirus) controlling a reporter gene like mKate2.
- Lentiviral Delivery: Package the library into lentiviral particles and infect your target cell line(s).
- FACS Sorting: Use Fluorescence-Activated Cell Sorting (FACS) to sort the transduced cell population into multiple bins based on the fluorescence intensity (reporter expression level).
- Next-Generation Sequencing (NGS): Isolate DNA from each sorted population and use NGS to count the abundance of each promoter construct in each bin.
- Machine Learning Analysis: Use regression models to predict the activity of all promoters in the library based on their count distribution across fluorescence bins. This allows for the identification of Synthetic Promoters with Enhanced Cell-State Specificity (SPECS) [42].
FAQ: When expressing multiple genes from a single vector, how does gene order affect expression, and how can we optimize it?
Answer: In polycistronic vectors (where multiple genes are expressed from a single promoter using linkers like 2A peptides), the relative position of a gene has a major impact on its expression level [43].
Key Data on Positional Effects [43]:
- The highest expression levels are consistently observed when an open reading frame (ORF) is placed closest to the promoter.
- Expression consistently drops for genes placed further from the promoter. The lowest expression is typically found in the third position, with a reduction of at least 80% compared to the first position.
- The identity of the upstream genes can also influence the expression of a downstream gene. Studies have shown that expression levels of a specific gene can be influenced not only by its own position but also by the sequential order of the other two genes [43].
Optimization Workflow:
- If near-equivalent expression of multiple genes is required, use 2A peptides (e.g., P2A, T2A) as linkers instead of IRES, especially for more than two ORFs [43].
- Place the gene requiring the highest level of expression in the position closest to the promoter.
- If expression levels are not satisfactory, empirically test different arrangements of the gene order.
FAQ: We have a challenging molecule with low expression. What is a systematic method for vector optimization?
Answer: A comprehensive, data-driven screen of vector components can lead to significant productivity gains for difficult-to-express molecules.
Experimental Protocol: Multi-Parameter Vector Optimization [9]
- Design of Experiment (DoE): Create a matrix screening multiple vector components simultaneously. A published case study screened:
- 10 different backbone vectors.
- 2 different promoters.
- 2 different signal peptides.
- 6 different selection conditions (e.g., GS, GS+Puro, GS+BSD, etc.) [9].
- High-Throughput Execution: Use an automated platform to perform the 60+ stable transfections in parallel.
- Fed-Batch Production & Titer Analysis: Scale the resulting pools to small-scale bioreactors (e.g., Ambr15) and measure the titer.
- Data Analysis: Identify the best-performing combination. This approach has led to the identification of constructs with titers >6 g/L, a nearly sevenfold improvement over the baseline [9].
The table below summarizes the experimental parameters and outcomes from a successful case study.
| Parameter Screened | Number of Variants Tested | Outcome (Best Performer) |
|---|---|---|
| Backbone Vectors | 10 | Backbone Vector #1 |
| Promoters | 2 | Promoter #1 |
| Signal Peptides | 2 | Signal Peptide #2 |
| Selection Conditions | 6 | GS + BSD |
| Final Titer Achieved | >6 g/L [9] |
FAQ: Beyond the vector itself, what host cell engineering strategies can boost titers?
Answer: Engineering the host cell line to enhance its production capacity is a powerful strategy. Focusing on the Endoplasmic Reticulum (ER) capacity, a key bottleneck in protein secretion, has proven effective [9].
Case Study: CHOplus Engineered Host [9]
- Objective: Engineer a CHOZN host with enhanced ER capacity to alleviate secretion bottlenecks.
- Method: The CHOplus host was developed through multiple rounds of genome engineering and cloning.
- Result: In a bispecific program, stable pools using the CHOplus #1 host recovered one week faster and showed a three and a half-fold productivity increase (1.14–1.18 g/L) compared to pools in the standard CHOZN host (330 mg/L), while maintaining comparable product quality [9].
The Scientist's Toolkit: Research Reagent Solutions
The table below lists key reagents and technologies referenced in the optimization strategies above.
| Research Reagent / Technology | Function in Optimization |
|---|---|
| Leap-In Transposase Technology | Enables site-specific integration for highly stable pool generation, compressing timelines [9]. |
| CHOplus Engineered Host Cell Line | An engineered CHO host with enhanced ER capacity to boost protein production and speed up pool recovery [9]. |
| 2A Peptides (P2A, T2A, E2A, F2A) | Self-cleaving peptide linkers for co-expressing multiple genes from a single polycistronic vector with near-equivalent levels [43]. |
| Dual-Antibiotic Selection (e.g., BSD/Puro) | Selection strategy to maintain yield and fidelity for multi-chain proteins like bispecific antibodies [9]. |
| Synthetic Promoter Library (e.g., SPECS library) | A library of synthetic promoters for high-throughput screening to identify cell-state-specific or high-strength promoters [42]. |
This Technical Support Center provides troubleshooting guides and FAQs for researchers utilizing stable knockout (KO) pools to overcome the challenges of clonal heterogeneity in cell line engineering, directly supporting thesis research on optimizing selection timelines.
Frequently Asked Questions (FAQs)
What is the fundamental difference between a stable knockout pool and a clonal cell line? A stable knockout pool is a heterogeneous population of cells that have undergone CRISPR/Cas9 editing and antibiotic selection without subsequent single-cell cloning. In contrast, a clonal cell line originates from a single, isolated progenitor cell. The KO pool better represents the overall population phenotype and significantly reduces variability caused by the inherent genomic and epigenetic differences between individual clones [1] [44].
What are the key advantages of using KO pools for functional gene studies? KO pools offer several major advantages over traditional clonal approaches [1] [45]:
- Dramatically Reduced Timelines: Screening timelines can be compressed from approximately 9 weeks to just 5 weeks.
- Increased Throughput: Screening throughput is increased by about 2.5-fold.
- Bypass of Clonal Heterogeneity: Data reflects the population-level effect of the knockout, minimizing bias from individual clone anomalies.
- Cost-Effectiveness: Eliminates the labor-intensive and resource-heavy process of single-cell cloning and the expansion of numerous clones.
- Stability: Genotypic and phenotypic stability of KO pools has been demonstrated for over 6 weeks in culture, even in multiplexed formats.
My KO pool shows high editing efficiency, but my functional assay results are inconsistent. What could be the issue? High editing efficiency at the DNA level does not always guarantee complete protein knockout due to potential mechanisms like truncated protein isoforms or exon skipping. It is critical to validate the knockout at the protein level using techniques like western blot or mass spectrometry to confirm the absence of the target protein [45]. Furthermore, ensure your cell pools are maintained under appropriate antibiotic pressure to maintain the edited population, as recommended by most service providers [44].
What is a typical delivery and specification for a purchased KO pool? Service providers typically deliver at least two vials of edited cell pools, with each vial containing a minimum of 1-2 million cells. The pools are guaranteed to have a high editing efficiency (often >80-90%), and come with a comprehensive quality control report including mycoplasma testing, viability data, and sequencing analysis [44] [46].
Troubleshooting Guides
Issue 1: Low Editing Efficiency in the KO Pool
Potential Causes and Solutions:
- Cause: Suboptimal gRNA design or efficacy.
- Solution: Utilize proprietary algorithms and dual-guide RNA strategies (targeting sites 40–300 bp apart) to synergistically enhance editing efficiency and increase the likelihood of large deletions or complete knockouts. Always screen multiple gRNAs per target and select the highest efficiency one [1] [45].
- Cause: Inefficient delivery of CRISPR components into your specific cell type.
- Solution: Perform thorough transfection optimization. This may involve testing different methods (e.g., electroporation, lipofection) and conditions. Many service providers perform "kill curve" assays to determine the ideal antibiotic concentration for selection and optimize transfection protocols for hard-to-transfect cells [44] [47].
- Cause: Inadequate antibiotic selection pressure.
- Solution: Perform an antibiotic kill curve experiment to determine the minimum concentration required to kill 100% of non-transfected cells in 7-10 days. Use this optimized concentration for selection and maintenance of the pool [44].
Issue 2: Loss of Phenotype or Genetic Stability Over Long-Term Culture
Potential Causes and Solutions:
- Cause: Insufficient maintenance of selection pressure, allowing non-edited cells to overtake the culture.
- Solution: Continuously maintain the validated antibiotic selection in the culture medium to preserve the edited population. Avoid passaging cells without selection [44].
- Cause: Cellular stress or genetic drift from extended culture.
- Solution: Always use early-passage cells for critical experiments. Expand the initial KO pool upon receipt and create a large, low-passage master cell bank. Avoid culturing cells beyond 10-20 passages for reproducible results [44].
- Cause: The phenotypic effect of the knockout itself may confer a growth disadvantage.
- Solution: If a specific phenotype (e.g., improved viability) is expected to diminish over time, plan experiments using freshly thawed, low-passage cells from the banked pool. The stability of the KO pool phenotype should be validated over the intended duration of your experiments, as demonstrated in fed-batch processes [1].
Issue 3: High Variability in Experimental Replicates Using a KO Pool
Potential Causes and Solutions:
- Cause: Inconsistent culture conditions or cell handling.
- Solution: Standardize cell culture protocols, including passage methods, seeding densities, and the quality of media components. Lot-to-lot variation in serum can noticeably influence cell growth [44].
- Cause: The KO pool itself is not a pure population but a mixture of cells with different edit outcomes.
- Solution: This is a inherent characteristic of pools. A key study demonstrated that KO pools can exhibit lower variability in proteomic data across replicates compared to individual clonal lines [45]. Ensure your experimental sample size (n) is sufficient to account for the remaining population heterogeneity. For ultimate uniformity, a clonal line may be necessary, but this re-introduces the risk of clonal bias.
Quantitative Data for Project Planning
The table below summarizes key performance metrics from published studies and service providers to help you plan and benchmark your own experiments.
Table 1: Key Performance Metrics of Stable Knockout Pools
| Metric | Traditional Clonal Approach | Knockout Pool Approach | Notes & Context |
|---|---|---|---|
| Project Timeline | ~9 weeks [1] | ~5 weeks [1] | From transfection to validated pool. Clonal isolation adds ~4 weeks. |
| Screening Throughput | Baseline (1x) [1] | 2.5x increase [1] | Due to parallel processing of populations vs. serial cloning. |
| Genetic Stability | Varies by clone | >6 weeks (42+ days) [1] | Demonstrated in CHO cells in fed-batch culture. |
| Editing Efficiency | Typically >90% (per clone) | >80-90% (pool average) [46] | Efficiency guaranteed by some service providers for primary T-cells. |
| Viability Post-Thaw | N/A | >90% [46] | Data from edited CD4+ T cell pools after 14 days in culture. |
Experimental Protocols & Workflows
Detailed Protocol: Generating a Stable Knockout Pool using CRISPR/Cas9 RNP Electroporation
This protocol is adapted from a study demonstrating stable KO pools in CHO cells [1].
Key Research Reagent Solutions:
- Cells: CHO DG44 cells or your cell line of choice.
- CRISPR Components: TrueCut Cas9 Protein v2 and TrueGuide Synthetic gRNAs (Thermo Fisher Scientific) [1].
- Transfection System: NEON Transfection System with a 10 µL Kit (Thermo Fisher Scientific) [1].
- Culture Vessels: 24-well plates, 6-well plates, and shake flasks.
- Media: Chemically defined, serum-free media appropriate for your cell line.
Methodology:
- gRNA Design and Screening: Design 3 sgRNAs per target gene using software like Geneious Prime or Benchling. Select guides targeting an early exon present in all transcript variants to induce early frameshifts. Prioritize high on-target and low off-target scores [1].
- RNP Complex Assembly: Pre-assemble ribonucleoprotein (RNP) complexes by combining synthetic gRNA and Cas9 protein at a 1:1 molar ratio (e.g., 7.5 pmol each) and incubate at room temperature for 10-20 minutes [1].
- Cell Preparation and Transfection: Harvest suspension cells in log-phase growth. For the NEON system, resuspend 2x10^5 cells in the provided R buffer mixed with the pre-assembled RNP complexes. Electroporate using optimized parameters (e.g., 1700 V, 20 ms pulse width, 1 pulse) [1].
- Cell Recovery and Expansion: Immediately after transfection, transfer cells to pre-warmed medium in a 24-well plate. Expand cells to a 6-well plate and then to shake flasks as density increases.
- Validation of Editing (Genotyping): 48 hours post-transfection, extract genomic DNA from a sample of the pool. Perform PCR amplification of the target region and analyze editing efficiency via Sanger sequencing and ICE analysis or Next-Generation Sequencing (NGS) [1] [47].
- Phenotypic Validation: Use the validated pool in your downstream assays, such as fed-batch culture to assess impact on viability and titer, as demonstrated with FN1 knockout [1].
Workflow Visualization: KO Pools vs. Clonal Screening
The diagram below illustrates the streamlined workflow for creating knockout pools compared to the traditional clonal approach, highlighting the significant reduction in time and effort.
Homology-Directed Repair (HDR) is a precise genome editing mechanism that uses a DNA template to repair double-strand breaks (DSBs), enabling precise mutations, gene knock-ins, or reporter insertions [48]. However, HDR competes with the more dominant and error-prone non-homologous end joining (NHEJ) pathway, which operates throughout the cell cycle, while HDR is largely restricted to the S and G2/M phases [49] [50] [51]. This competition results in low baseline HDR efficiency, presenting a significant challenge for applications requiring precise genome modifications, such as generating stable cell pools for research and drug development.
Strategies to enhance HDR efficiency primarily focus on two complementary approaches: using small molecule compounds to modulate DNA repair pathways and synchronizing the cell cycle to the HDR-preferred phases. This guide provides detailed troubleshooting and protocols for implementing these strategies to optimize your selection timeline for stable cell pools.
Small Molecule Enhancers: Mechanisms and Protocols
Small molecule compounds can enhance HDR efficiency by either inhibiting the competing NHEJ pathway or directly stimulating the HDR machinery.
Key Small Molecule Enhancers and Their Functions
Table 1: Small Molecule Enhancers for HDR
| Small Molecule | Primary Target/Function | Reported HDR Enhancement | Common Working Concentration |
|---|---|---|---|
| Nocodazole [52] [27] | Microtubule polymerization inhibitor; enriches G2/M cell cycle phase. | 3- to 6-fold increase in hPSCs [52] | 0.1 - 2.5 µM [49] [50] [27] |
| ABT-751 [52] | Microtubule polymerization inhibitor; enriches G2/M cell cycle phase. | ~3-fold increase in hPSCs [52] | Optimized for 16-hour treatment [52] |
| Alt-R HDR Enhancer V2 [53] | Diverts repair pathway towards HDR (specific mechanism not fully detailed). | Outperformed 14 other molecules in screening [53] | 1 µM [53] |
| Nedisertib (M3814) [54] | DNA-PK inhibitor; suppresses NHEJ pathway. | 21-24% increase in precise editing [54] | 0.25 - 2 µM [54] |
| NU7441 [54] | DNA-PK inhibitor; suppresses NHEJ pathway. | 11% increase in precise editing [54] | 2.5 µM [54] |
| Docetaxel [49] [50] | Microtubule stabilizer; arrests cell cycle at G2/M phase. | 1.2-1.5 fold increase in KI rate [49] [50] | 0.5 - 5 µM [49] [50] |
| Irinotecan [49] [50] | Topoisomerase I inhibitor; DNA-damaging agent causing G2/M arrest. | 1.2-1.5 fold increase in KI rate [49] [50] | 1 - 10 µM [49] [50] |
| SCR7 [52] [55] | DNA Ligase IV inhibitor; suppresses classical NHEJ. | Inconsistent, cell-type dependent results [52] [54] [55] | 5 µM [53] |
Experimental Protocol for Small Molecule Treatment
The following workflow diagram illustrates a generalized protocol for using small molecules in a CRISPR-HDR experiment:
Detailed Steps:
- Preparation: Seed your cells at an appropriate density. Pre-assemble the Cas9 ribonucleoprotein (RNP) complex with your guide RNA. Prepare your HDR donor template (ssODN or dsDNA).
- Transfection: Deliver the Cas9 RNP complex and HDR donor template into the cells using your preferred method (e.g., nucleofection, lipofection). For the BEL-A cell line, optimal parameters were determined to be 3 µg Cas9, a gRNA:Cas9 ratio of 1:2.5, and 100 pmol of ssODN template for 5x10⁴ cells [54].
- Small Molecule Treatment: Add the chosen small molecule enhancer to the culture media immediately after transfection. Use the concentrations indicated in Table 1 as a starting point. Note that the optimal concentration may vary by cell type.
- Incubation and Analysis: Culture the cells for 48-72 hours to allow for genome editing and repair. Then, extract genomic DNA and analyze editing efficiency via next-generation sequencing, restriction fragment length polymorphism (RFLP), or other suitable methods.
Cell Cycle Synchronization Strategies
Synchronizing cells in the S and G2/M phases creates a cellular environment that is more favorable to the HDR mechanism, thereby increasing the relative frequency of precise edits.
Mechanism of Cell Cycle-Dependent DNA Repair
The following diagram illustrates why cell cycle synchronization can enhance HDR efficiency:
Protocol for Cell Cycle Synchronization with Nocodazole
This protocol, adapted from multiple studies [52] [27], is effective for various human cell lines, including pluripotent stem cells (hPSCs).
Detailed Steps:
- Seed Cells: Plate your cells at a density that will reach ~70% confluence at the time of transfection.
- Synchronize: Add Nocodazole (typically at 1 µg/mL) to the culture medium. Incubate the cells for approximately 16 hours. This step inhibits microtubule polymerization, arresting the cells at the G2/M boundary [52].
- Verify Synchronization (Optional but Recommended): Analyze a sample of cells by flow cytometry (e.g., using FUCCI reporters or DNA staining with Hoechst dye) to confirm successful enrichment in the G2/M phase. Effective treatment can enrich up to 80-88% of cells in G2/M [52].
- Release and Transfect: Gently wash the cells to remove the Nocodazole-containing medium. Then, immediately proceed with the transfection of Cas9 RNP and HDR donor template in fresh, drug-free medium. Releasing the cells from arrest allows them to progress through the HDR-favorable phase.
Research Reagent Toolkit
Table 2: Essential Reagents for HDR Enhancement Experiments
| Reagent Category | Specific Examples | Key Function in HDR Experiment |
|---|---|---|
| Cell Cycle Inhibitors (G2/M Arrest) | Nocodazole, ABT-751, Docetaxel [52] [49] [50] | Synchronize cell population in HDR-preferred phase to boost precise repair. |
| NHEJ Pathway Inhibitors | Nedisertib (M3814), NU7441, NU7026 [54] | Suppress the error-prone NHEJ pathway to reduce indels and favor HDR. |
| Commercial HDR Enhancers | Alt-R HDR Enhancer V2 [53] | Ready-to-use solutions that divert DNA repair towards HDR; optimized for ease of use. |
| HDR Donor Templates | ssODN (for <120 nt edits), dsDNA Donor Blocks (for longer edits) [48] | Provides the homologous template for precise incorporation of the desired edit. |
| CRISPR-Cas9 Components | Cas9 protein, guide RNA (gRNA) [48] [54] | Creates a targeted double-strand break at the genomic locus of interest. |
Frequently Asked Questions (FAQs)
Q1: Why did my HDR efficiency not improve with a small molecule, and cell viability dropped? This is often due to compound-specific toxicity or an incorrect concentration. Some molecules, like Docetaxel and Mitomycin C, are known to severely reduce blastocyst rates and viability in primary cells and embryos [49] [50]. Troubleshooting steps:
- Titrate the compound: Test a range of concentrations to find the optimal balance between HDR enhancement and cell health. Start with the lower end of the ranges provided in Table 1.
- Check cell type compatibility: The effect of small molecules is highly cell-type specific. For instance, Irinotecan and Mitomycin C are more active in 293T cells, while Docetaxel and Nocodazole show better results in BHK-21 and primary pig fetal fibroblasts (PFFs) [49] [50]. Consult literature for your specific cell type.
- Consider timing: Ensure the compound is added immediately after transfection for maximum effect [53].
Q2: Is it better to use a single enhancer or a combination of molecules? Combinations can be more effective but often at the cost of higher toxicity. Research shows that a combination of three or four small molecules can achieve the highest knock-in rates in some cell types [49] [50]. However, a study on pig embryos found that while combinations like IRI+MITO or DOC+NOC increased knock-in frequency, they also resulted in more severe embryo toxicity without a significant improvement over single molecules [50]. Recommendation: Start with a single, well-characterized molecule like Nocodazole for synchronization or Nedisertib for NHEJ inhibition. Progress to combinations only if necessary and with careful viability monitoring.
Q3: What is the most crucial factor for successful HDR besides using enhancers? The design and delivery of the CRISPR components and donor template are fundamental. Even with enhancers, HDR will be inefficient with poor reagents. Key considerations:
- gRNA activity: Use a highly active guide RNA [48].
- Cut-to-insert distance: The Cas9 cut site must be as close as possible to the intended insertion site—HDR efficiency decreases dramatically with just a few bases of distance [48].
- Donor template design: Use optimized homology arm lengths (30-60 nt for ssODN, 200-300 bp for dsDNA) and consider incorporating silent mutations in the protospacer or PAM to prevent re-cutting of the edited locus [48].
- Delivery method: Using pre-assembled Cas9 RNP complexes via nucleofection is a highly efficient strategy that minimizes off-target effects and allows for timed delivery [27].
Q4: We are working with primary cells, which are more sensitive. What is the safest enhancement strategy? For vulnerable primary cells, use lower concentrations of less toxic compounds. Research on primary cells like pig fetal fibroblasts (PFFs) used a lower dose range of small molecules and found a dose-dependent promoting effect [49] [50]. Recommended strategy:
- Prioritize Nocodazole at a low concentration (e.g., 0.1-0.5 µM) for cell cycle synchronization.
- Alternatively, test Nedisertib at a low concentration (e.g., 0.25 µM), which provided a significant boost in precise editing with minimal impact on viability in a human erythroid cell line [54].
- Always perform a viability assay alongside your editing experiment to ensure the conditions are tolerable for your specific primary cell type.
Analytical Methods and Scalability Assessment for Clone Success
Frequently Asked Questions (FAQs)
FAQ 1: What constitutes definitive proof of monoclonality for regulatory submissions? Regulatory agencies require image-based evidence documenting that a cell line originates from a single progenitor cell. This proof typically involves a time-stamped image series tracking a single cell's growth into a colony [56]. The documentation must show a single cell at Day 0 and subsequent growth, providing a verifiable growth history for regulatory filings [56]. Statistical confidence from methods like limiting dilution is insufficient without this direct visual evidence [56].
FAQ 2: How do modern methods improve cell viability during single-cell isolation? Advanced technologies use gentler physical mechanisms than traditional FACS. Impedance-based single-cell dispensing detects cell passage via electrical signature without stressing cells with sheer forces [56]. Acoustic focusing systems use controlled ultrasonic waves for label-free separation, preserving viability by avoiding labels, electrical fields, or high pressures [57]. Nanowell architectures maintain chemical crosstalk through shared medium while physically isolating single cells, supporting natural growth factors [58].
FAQ 3: What are the limitations of limiting dilution cloning? Limiting dilution is labor-intensive, requires processing many plates, and often fails to produce viable monoclonal colonies [58]. This method relies on statistical probability rather than direct visual confirmation, making it difficult to provide the image-based evidence now required for regulatory compliance [56] [58]. Well artifacts and cellular debris can also be mistaken for cells, compromising accuracy [56].
FAQ 4: Which technologies provide the highest assurance of monoclonality? High-throughput nanowell-based image-verified cloning (HT-NIC) combines automated single-cell isolation with imaging to verify monoclonality before and after colony selection [58]. Integrated systems like the CloneSelect Imager with single-cell dispensers provide both impedance-based proof of single-cell dispensing and image-based tracking of colony growth [56]. These systems generate unique electrical signatures for each dispensed cell and time-stamped images for complete documentation [56].
Troubleshooting Guides
Issue 1: Poor Cell Viability After Single-Cell Sorting
Problem: Low viability and weak clonal outgrowth following single-cell isolation.
Solutions:
- Utilize Gentler Dispensing Technologies: Implement impedance-based dispensing (e.g., DispenCell) which detects cell passage via electrical signal without damaging shear forces [56]. This method preserves viability and integrity for optimal outgrowth [56].
- Apply Acoustic Sorting for Delicate Cells: Use acoustic focusing systems for label-free separation, especially for sensitive primary cells, stem cells, or delicate immune cells. This method avoids labels, electrical fields, and high pressures that cause cellular stress [57].
- Optimize Nanowell Culture Conditions: Use nanowell plates that enable physical single-cell isolation while maintaining chemical crosstalk through shared medium. This architecture supports access to natural growth factors, improving health and outgrowth rates for difficult-to-grow cell types [58].
Verification Method: Monitor recovery rates post-sorting using automated imaging systems. Capture images immediately after sorting (Day 0) and track cell division over 3-5 days. Healthy cells should show first division within 24-48 hours [56].
Issue 2: Inadequate Proof of Clonality for Regulatory Compliance
Problem: Insufficient documentation to demonstrate single-cell origin for regulatory submissions.
Solutions:
- Implement Image-Based Verification Workflows: Use automated imaging systems (e.g., CloneSelect Imager) to capture high-resolution images at Day 0 and multiple time points. This provides visual evidence of single-cell origin and tracks colony development [56].
- Combine Multiple Verification Methods: Utilize technologies that provide both electrical signature proof (from impedance-based dispensing) and image-based documentation. The electrical trace from single-cell dispensers immediately records proof of clonality as unique peaks when single cells pass through the dispenser aperture [56].
- Generate Comprehensive Monoclonality Reports: Use automated reporting features that organize supporting image evidence into easily shareable reports. These reports should include Day 0 single-cell images, growth progression series, and documentation of well absence of additional cells [56].
Verification Method: Establish a standardized imaging protocol capturing: (1) Initial single-cell status (Day 0), (2) First division (24-48 hours), (3) Colony formation (5-7 days). Use reference beads in semi-solid media to confirm imaging of the same colony over time [56].
Issue 3: Low Throughput in Monoclonal Cell Line Development
Problem: Slow processes requiring extensive manual effort to isolate and verify monoclonal lines.
Solutions:
- Adopt High-Throughput Nanowell Technology: Implement nanowell plates containing 100,000-130,000 nanowells per plate, enabling thousands of clones to be processed simultaneously in a much smaller footprint than traditional methods [58].
- Automate Colony Selection and Imaging: Use integrated systems (e.g., CellCelector) that automatically identify, track, and verify monoclonal status through unique cell IDs and automated scanning. This reduces manual labor and increases throughput [58].
- Utilize Automated Single-Cell Dispensers: Implement systems that combine rapid single-cell dispensing with immediate proof of clonality via electrical signatures, streamlining the workflow from isolation to verification [56].
Verification Method: Compare throughput metrics: A single 24-well nanowell plate can yield up to 500 target clones, equivalent to more than two dozen 96-well plates required by limiting dilution methods [58].
Monoclonality Verification Technologies: Comparison Table
| Technology | Throughput Capacity | Viability Preservation | Proof of Clonality | Regulatory Compliance Support |
|---|---|---|---|---|
| Limiting Dilution | Low (requires many plates) | Variable | Statistical confidence only | Limited without image evidence |
| FACS | Medium to High | Reduced (sheer force stress) | Statistical with optional imaging | Possible with imaging add-ons |
| Impedance-Based Dispensing | Medium | High (gentle electrical sensing) | Electrical signature + imaging | Comprehensive (dual evidence) |
| HT-NIC (Nanowell) | Very High (100,000+ nanowels/plate) | High (chemical crosstalk maintained) | Image-based verification | Full (automated documentation) |
| Acoustic Focusing | Medium | Very High (label-free, gentle) | Image-based verification | Full with imaging systems |
Experimental Protocols
Protocol 1: Image-Verified Monoclonality Assessment
Objective: Provide documented proof of single-cell origin through automated imaging.
Materials:
- CloneSelect Imager or similar automated imaging system [56]
- 96-well or 384-well cell culture plates
- Appropriate cell culture media
- Single-cell suspension
Methodology:
- Single-Cell Dispensing: Dispense single cells into plate wells using impedance-based technology or FACS with image verification [56].
- Day 0 Imaging: Scan entire plate using transmitted white light immediately after dispensing. Capture high-resolution images of each well [56].
- Time-Series Imaging: Continue daily imaging for 5-7 days to monitor cell growth and division.
- Image Analysis: Use software to track growth rates, confluence measurements, and colony formation.
- Monoclonality Confirmation: Review image series to verify colony origin from a single cell. Confirm absence of additional cells in well through comprehensive well imaging [56].
- Report Generation: Export organized evidence with Day 0 single-cell image and growth progression for regulatory submissions [56].
Protocol 2: High-Throughput Nanowell-Based Image-Verified Cloning
Objective: Efficiently generate verified monoclonal colonies with high throughput and viability.
Materials:
- Nanowell plates (4,300-22,000 nanowells per well) [58]
- Automated cell selection system (e.g., CellCelector)
- Appropriate cell culture reagents
Methodology:
- Cell Seeding: Seed single cells into nanowell plates. Nanowell architecture physically isolates individual cells while allowing chemical communication through shared medium [58].
- Automated Imaging and Identification: Scan plates to identify viable, monoclonal clones. System assigns unique ID to each cell for tracking [58].
- Clone Assessment: Software ranks clones based on viability and monoclonal status after 3-5 days of growth.
- Colony Picking: Automatically transfer verified monoclonal clones to multiwell plates for expansion.
- Documentation: System captures images before and after colony selection, providing proof of monoclonality and supporting regulatory compliance [58].
Monoclonality Verification Workflow
Research Reagent Solutions
| Reagent/Technology | Primary Function | Application Context |
|---|---|---|
| CloneSelect Imager | Automated cell imaging and monoclonality verification | Documentation of single-cell origin through time-series imaging [56] |
| GS piggyBac System | High-efficiency gene integration | Cell line development with improved productivity and stability [59] |
| bYlok Technology | Correct HC-LC pairing in bispecific antibodies | Enhanced yield of complex therapeutic proteins [59] |
| Beacon Optofluidic System | Single-cell screening and analysis | Identification of high-producing clones early in development [59] |
| Nanowell Plates | High-throughput single-cell isolation | Image-verified cloning with maintained cell viability [58] |
| Impedance-Based Dispensers | Gentle single-cell dispensing | Viability-preserving isolation with electrical proof of clonality [56] |
Core Concepts and Workflow
Multi-parameter clone screening is an advanced methodology that simultaneously evaluates multiple critical performance indicators during cell line development. This approach integrates data on cell growth, productivity (titer), and product quality attributes (PQAs) to select optimal clones with the greatest potential for successful scale-up and manufacturing. Unlike traditional methods that often prioritize titer alone, this comprehensive strategy enables earlier detection of suboptimal clones, reduces risks in later development stages, and significantly compresses timelines from DNA to research cell bank [60] [12].
The fundamental workflow integrates previously sequential evaluation steps into a parallel assessment model. As demonstrated in successful implementations, this involves high-throughput automated systems for clone cultivation, multivariate data analysis tools for pattern recognition, and scale-down models that accurately predict manufacturing performance [60] [12]. The resulting data-rich environment enables researchers to make more informed selection decisions based on a holistic understanding of clone behavior rather than isolated parameters.
Figure 1: Multi-Parameter Clone Screening Workflow - This integrated approach enables parallel assessment of critical parameters rather than sequential evaluation.
Frequently Asked Questions
What are the most critical parameters to include in a multi-parameter screening panel?
The most effective screening panels balance comprehensiveness with practicality. Essential parameters include:
- Growth Parameters: Viable cell density (VCD), viability, population doubling time, and specific growth rate [60]
- Productivity Metrics: Volumetric titer, specific productivity (Qp), and titer stability over generations [61] [60]
- Product Quality Attributes: Glycosylation patterns, charge variants, aggregation levels, and potency [60] [12]
- Metabolic Markers: Glucose consumption, lactate production, and ammonia accumulation [62]
- Genetic Stability: Consistent transgene copy number and expression over generations [60]
How can we effectively manage the increased data volume from multi-parameter screening?
Managing multi-parameter data requires integrated computational strategies:
- Implement multivariate data analysis (MVDA) tools that apply principal component analysis (PCA) and machine learning algorithms to identify patterns across parameters [12] [63]
- Utilize automated data integration platforms like the CellCelector system, which combines imaging data with productivity metrics [12]
- Apply similarity analysis algorithms such as compaRe, which uses mass-aware gridding to compare samples across multiple dimensions [63]
- Establish structured database systems with visualization interfaces that enable intuitive data exploration and decision-making [64] [63]
What timeline reductions are realistically achievable with multi-parameter screening?
Substantial timeline compressions are demonstrable through case studies:
Table 1: Timeline Comparison: Traditional vs. Multi-Parameter Screening
| Development Phase | Traditional Approach | Multi-Parameter Approach | Time Saved |
|---|---|---|---|
| Clone Selection & Feed Strategy Optimization | 8-12 weeks [60] | 4 weeks [60] | 4-8 weeks |
| DNA to Research Cell Bank | ~36 weeks [9] | 28 weeks [12] | 8 weeks |
| High-Throughput mAb Screening (575 mAbs) | ~4 months [9] | ~2 months [9] | ~2 months |
How does multi-parameter screening improve clone stability prediction?
Multi-parameter screening enhances stability prediction through:
- Early generation profiling that identifies metabolic patterns correlated with long-term stability [62]
- Extended culture evaluation tracking titer and critical quality attributes over 40+ generations [60]
- Multivariate stability indices that combine growth, productivity, and PQA consistency metrics [60] [12]
- Stress response profiling that evaluates clone performance under simulated production conditions [62]
Case study data demonstrates clones selected through multi-parameter screening maintain consistent titers and product quality profiles through 70 population doublings, confirming superior stability prediction [12].
Troubleshooting Common Experimental Issues
Problem: Poor Correlation Between Screening and Scale-Up Performance
Symptoms: Clones performing well in microscale systems show significantly reduced titer or altered product quality in bioreactor scale-up.
Solutions:
- Implement advanced scale-down models like ambr systems that better mimic bioreactor conditions through impeller stirring, sparging, and pH/DO control [60]
- Include hydrodynamic stress assessment during screening to identify clones robust to shear forces encountered at larger scales
- Apply multivariate comparability analysis using tools like compaRe to quantify similarity between scale-down and full-scale processes [63]
- Case study data demonstrates strong correlation (R² > 0.9) for growth and titer profiles between ambr15 and 5L/250L bioreactors when using proper scale-down principles [60]
Problem: Inconsistent Product Quality Attributes Across Clones
Symptoms: Unacceptable heterogeneity in glycosylation patterns, charge variants, or aggregation levels among top-producing clones.
Solutions:
- Integrate high-throughput PQA analytics during early screening, including capillary electrophoresis and LC-MS for glycosylation [12]
- Implement feed strategy parallelization during clone selection to identify clone-feed combinations that optimize both titer and quality [60]
- Apply multivariate pattern recognition to identify metabolic signatures correlated with desirable product quality profiles [62]
- Experimental data shows feed strategy optimization during clone selection can double titers while maintaining target quality attributes [60]
Problem: Data Integration Challenges from Multiple Analytical Platforms
Symptoms: Inefficient data consolidation from cell counters, metabolite analyzers, HPLC systems, and product quality instruments delaying decision-making.
Solutions:
- Deploy integrated data management platforms with standardized data templates and automated data ingestion capabilities
- Implement multivariate analysis tools like SIMCA that use principal component analysis to reduce data dimensionality and identify patterns [61]
- Utilize visualization dashboards that enable simultaneous viewing of growth, titer, and PQA trajectories for individual clones
- Research shows automated multivariate analysis can successfully predict high-producing clones from image-based data alone, demonstrating the power of integrated data analysis [61]
Experimental Protocols
Protocol 1: Integrated Clone Screening in Microscale Bioreactors
Purpose: Simultaneous evaluation of clone performance and feed strategy optimization using ambr15 system [60].
Materials:
- ambr15 workstation with 24 or 48 independent bioreactors
- Recombinant CHO-S cell lines
- Three different proprietary feed strategies
- Analytical instruments: Cedex cell counter, YSI metabolite analyzer, HPLC with Protein A column [60]
Procedure:
- Inoculate eight different clones in triplicate with three different feed strategies (total 24 bioreactors)
- Maintain cultures with controlled pH (7.0-7.2), DO (30-50%), and temperature (36.5°C)
- Sample daily for VCD, viability, metabolites (glucose, lactate, ammonia)
- Harvest on day 12 for titer analysis by Protein A HPLC
- Analyze day 12 samples for product quality attributes (IEC-HPLC for charge variants)
- Culture top-performing clones to 40 generations, repeating fed-batch at generations 0, 20, and 40
- Rank clones using multiparametric scoring matrix incorporating titer, stability, and PQA metrics
Table 2: Multi-Parameter Clone Ranking Matrix
| Clone ID | Titer (g/L) | Titer Stability (Gen 40/Gen 0) | Desired Glycoforms (%) | Charge Variant Profile | Aggregate Levels (%) | Overall Score |
|---|---|---|---|---|---|---|
| Clone 4 | 1.6 | 95% | 92% | Within spec | <1% | 94 |
| Clone 6 | 1.5 | 87% | 89% | Within spec | <1% | 88 |
| Clone 2 | 1.3 | 92% | 85% | Slight acidic shift | 1.5% | 82 |
| Clone 7 | 1.7 | 72% | 91% | Within spec | <1% | 80 |
Protocol 2: High-Throughput Clone Selection Using Automated Imaging and Multivariate Analysis
Purpose: Rapid identification of high-producing clones through image-based prediction modeling [61].
Materials:
- Cell-Metric Imager or similar automated imaging system
- CHO host cell lines
- Quantitative image analysis software
- SIMCA modeling software [61]
Procedure:
- Perform single-cell cloning in 96-well plates using limiting dilution
- Scan plates at 0, 24, 48, and 96 hours using automated imager
- Extract quantitative morphological features (cell size, circularity, solidity) from images
- Culture proliferated clones in TubeSpin bioreactors for fed-batch evaluation
- Measure antibody titers using Protein A HPLC
- Develop relative titer (RT) prediction model using SIMCA methodology
- Validate model with independent clone sets
- Apply model to prioritize clones for expanded evaluation
Key Considerations: This image-based prediction approach has demonstrated success in identifying high producers from the same host cell line, though cross-host application requires additional model refinement [61].
The Scientist's Toolkit: Essential Research Reagents and Solutions
Table 3: Key Research Reagent Solutions for Multi-Parameter Screening
| Reagent/Solution | Function | Application Notes |
|---|---|---|
| CD04 Media [61] | Serum-free growth medium | Base medium for CHO cell culture; supports robust cell growth and productivity |
| Electroporation Solution [61] | Facilitates DNA delivery into cells | Used for transfection with expression vectors containing genes of interest |
| Feed02 Supplement [61] | Nutrient concentrate for fed-batch cultures | Bolus feeding at days 3, 6, and 9 enhances volumetric productivity |
| Protein A HPLC Columns [61] | Affinity purification for titer analysis | Poros A/20 columns with glycine elution for accurate titer quantification |
| CHOplus Engineered Host [9] | Enhanced ER capacity host line | Boosts titers 3.5-fold through improved protein processing capability |
| Leap-In Transposase System [9] | Site-specific integration technology | Enables stable pool generation with consistent, high-level expression |
| Dual-Antibiotic Selection Markers [9] | Bispecific antibody fidelity maintenance | BSD/Puro combination maintains chain ratio integrity in multispecific formats |
The Ambr 15 and Ambr 250 automated bioreactor systems are high-throughput, scaled-down models designed to accelerate upstream process development. These systems enable researchers to screen clones, media, and process parameters with exceptional efficiency while maintaining excellent predictability for larger manufacturing scales [65] [66].
The table below summarizes the core specifications and primary applications of each system:
| Feature | Ambr 15 Cell Culture | Ambr 250 High Throughput |
|---|---|---|
| Working Volume | 10 – 15 mL [66] | 100 – 250 mL [65] |
| Parallel Cultivations | 24 or 48 [66] | 12 or 24 [65] |
| Primary Application | Cell line selection, early process development [66] | Process optimization, clone screening [65] |
| Key Strengths | Maximizing throughput for clone screening [66] | Generating sufficient material for downstream analytics [67] |
| Cell Therapy Support | T-cell, CAR-T expansion processes [66] | Cultures requiring microcarriers or activating beads [67] |
The Ambr 15 system is predominantly used for high-throughput cell line selection, allowing researchers to screen hundreds of clones under reproducible, bioreactor-relevant conditions. This modernizes workflows by replacing less predictive shake flasks and shaking plates [66].
The Ambr 250 system serves as a crucial bridge to pilot and manufacturing scales. Its larger working volume is key for generating sufficient product for analyzing Critical Quality Attributes (CQAs), and it is especially valuable for optimizing processes for sensitive cell and gene therapies, which may require the suspension of microcarriers or activating beads [67].
Frequently Asked Questions (FAQs)
Q1: How do I choose between the Ambr 15 and Ambr 250 for my stable cell pool project? Your choice depends on the project phase. Use the Ambr 15 for the initial high-throughput screening of hundreds of stable cell pools to identify top performers quickly. Transition to the Ambr 250 for in-depth characterization of a shortlist of the best clones, where you need more material for analytical assays or to model a fed-batch process more accurately [65] [66].
Q2: My T-cell culture with activating beads in the standard Ambr 250 vessel is showing poor growth. What could be wrong? The original Ambr 250 vessel with baffles and dual pitched-blade impellers is suboptimal for suspending particles like activating Dynabeads. A newly designed, unbaffled vessel with a single, larger elephant ear impeller has been developed specifically for this purpose. This configuration provides superior bead suspension at a lower specific power input, significantly improving T-cell culture performance [67].
Q3: Can I directly scale a process from Ambr 15/250 to a 2000L manufacturing bioreactor? Yes, the systems are engineered for excellent scalability. Data generated at these small scales translates well to larger Sartorius bioreactors, including the 2L Univessel SU and larger Biostat STR systems up to 2000L. Using tools like BioPAT Process Insights software can further de-risk scale-up by providing a multi-dimensional approach to predict scalability [65].
Q4: How can I accelerate the optimization of feeding strategies in the Ambr 250? The system's integrated liquid handler and pumps enable complex feeding strategies. You can use the Design of Experiments (DoE) functionality embedded in the control software to efficiently test different feeding rates and timings simultaneously. For example, one study optimized monoclonal antibody production by using a Central Composite Design to investigate the impact of initial seeding density and feeding rate, leading to a titer of up to 5 g/L [68] [69].
Troubleshooting Common Experimental Issues
Poor Cell Growth or Viability
| Possible Cause | Solution |
|---|---|
| Suboptimal mixing for sensitive cells (e.g., stem cells, T-cells). | For cell therapy applications, verify you are using the correct vessel. The unbaffled vessel with an elephant ear impeller is designed for gentler, more effective mixing of bead- and microcarrier-based cultures [67]. |
| Incorrect gassing strategy leading to pH or dissolved oxygen (DO) stress. | The systems allow individual control of O2, CO2, and N2 for each bioreactor. Calibrate pH and DO sensors as recommended and adjust gas mixing ratios to maintain setpoints. The Ambr 15 Gen 2 offers an extended low-speed stirring range down to 150 rpm for better control of sensitive cells [66]. |
| High variability between parallel runs. | Leverage the automated liquid handling for all additions and sampling to minimize human error. Ensure single-use vessels are properly seated and that all fluidic pathways are primed correctly [66]. |
Data and Analytics Integration Problems
| Possible Cause | Solution |
|---|---|
| Manual data transfer from external analyzers is prone to error. | Connect compatible analyzers (e.g., Nova BioProfile FLEX2, Beckman Vi-CELL XR) for at-line measurement. Data is automatically transferred back to the Ambr software, ensuring integrity and enabling real-time process control [66]. |
| Difficulty in ranking clones based on multiple performance criteria. | Utilize the integrated Ambr Clone Selection software (included with Ambr 15). It uses multivariate analysis to simplify the ranking of clones, media, and feeds, helping you select the best performers based on a comprehensive dataset [65] [66]. |
Process Control and Scalability Concerns
| Possible Cause | Solution |
|---|---|
| Uncertainty in scaling the process to manufacturing. | Use the BioPAT Process Insights software. This tool uses characterized bioreactor data to predict scalability risks across the development workflow, from 15 mL up to 2000 L, replacing error-prone spreadsheet calculations [65]. |
| Inefficient experimental design leading to wasted resources. | Before starting, use the MODDE DoE software integrated into the Ambr systems. It provides built-in guidance to design effective, multi-factorial experiments that maximize information gain while minimizing the number of runs [66] [69]. |
Essential Research Reagent Solutions
The table below lists key materials and their functions for successful experiments in Ambr systems.
| Reagent/Material | Function |
|---|---|
| Single-Use Microbioreactors | Pre-sterilized vessels with integrated sensors for pH and DO; the foundation for parallel, aseptic operation [66]. |
| Serum-Free Media | Chemically defined media supports consistent cell growth and product quality, reduces contamination risk, and is essential for regulatory compliance [70]. |
| Feed Solutions | Concentrated nutrients added to fed-batch cultures to extend viability and increase product titer; strategies can be optimized via DoE [68] [69]. |
| Calibration Solutions | Essential for the accurate calibration of in-line pH and DO sensors before each experiment to ensure data reliability [66]. |
| Selective Agents (e.g., Antibiotics) | For maintaining selection pressure on stable cell pools during the initial screening and expansion phases. |
Experimental Workflow for Stable Cell Pool Selection
The following diagram illustrates a streamlined workflow for selecting and optimizing stable cell pools using the integrated Ambr platform. This process is designed to reduce timelines and improve the robustness of cell line development.
Detailed Protocol: Media and Feed Optimization using DoE
This protocol outlines how to use the Ambr 250 system to optimize feeding strategies for a Chinese Hamster Ovary (CHO) stable cell pool to maximize monoclonal antibody (mAb) titer.
Objective: To determine the optimal initial Seeding Density (SD) and Feeding Rate (FR) for a fed-batch process.
Materials:
- Ambr 250 High Throughput system [65]
- CHO stable cell pool
- Proprietary basal and feed media
- BioProfile FLEX2 or similar analyzer for metabolite analysis [66]
Methodology:
- Experimental Design: In the Ambr 250 software, create a Central Composite Design (CCD) using the integrated MODDE package. Define SD and FR as your independent variables, with mAb titer as the primary response [68] [69].
- Bioreactor Setup: Inoculate the Ambr 250 bioreactors according to your experimental design, varying the SD across a range (e.g., 0.5 to 1.5 x 10^6 cells/mL).
- Process Operation: Run the bioreactors in fed-batch mode. Use the system's automated liquid handling capability to administer feeds based on the predefined FR percentages of working volume per day (e.g., 1% to 4% Vc/day) [68].
- Process Monitoring:
- The system automatically controls and records pH, DO, and temperature.
- Schedule automated daily sampling for integrated at-line analysis of viable cell density (VCD) and metabolite concentrations (e.g., glucose, lactate) [66].
- Product Titer Analysis: Take samples for offline product titer analysis (e.g., HPLC). Manually transfer these results to the Ambr software or use a data-connected analyzer.
- Data Analysis and Optimization:
- Use the MODDE software to fit a response surface model to the data.
- The model will identify the significance of SD and FR and their interaction.
- Identify the optimal operating region that maximizes mAb titer. One study found the optimal conditions to be an SD of 1.1 x 10^6 cells/mL and an FR of 2.68% Vc/day, achieving a titer of up to 5 g/L [68].
By implementing these workflows and troubleshooting guides, scientists can effectively leverage Ambr scale-down models to de-risk scale-up and accelerate the development of robust manufacturing processes for biologics and advanced therapies.
Frequently Asked Questions (FAQs)
1. What are the most critical factors to ensure a successful scale-up to a 50 L bioreactor? Successful scale-up depends on several interconnected factors. Key among them is ensuring your scale-down model (SDM) is properly qualified to accurately mimic the 50 L environment [71]. Furthermore, maintaining control over both scale-independent parameters (like pH, temperature, and dissolved oxygen) and properly scaling the scale-dependent parameters (like power per unit volume (P/V) and impeller tip speed) is crucial to avoid gradients and ensure consistent cell performance [72]. Finally, cell line stability is foundational; genetic drift in high-passage cells can alter growth and productivity, compromising scale-up success [73] [74].
2. How can we accelerate the cell line development and process characterization timeline? Timelines can be significantly compressed by adopting modern, high-throughput tools and strategic approaches. Using automated micro-bioreactor systems (like ambr 15 and 250) for clone selection and process optimization can reduce development time from many months to just several weeks [75] [76]. For late-stage development, strategies such as initiating process characterization with a Research Cell Bank (RCB) instead of waiting for the Master Cell Bank (MCB), and leveraging platform processes can reduce the timeline from a standard 12 months to as little as 4 months [71].
3. We often see changes in product quality attributes during scale-up. How can this be mitigated? Changes in critical quality attributes (CQAs) often arise from environmental heterogeneities in larger bioreactors, such as pH or nutrient gradients [75] [72]. To mitigate this:
- Employ a Quality-by-Design (QbD) approach during early process development to understand the impact of process parameters on CQAs [71].
- Use advanced data analytics. One methodology (CLD 4) uses machine learning on data generated during cell line development to identify process conditions that lead to product quality issues, allowing for preemptive correction [76].
- Ensure your scaling strategy maintains a consistent biochemical environment. Using commercial or in-house scaling tools that consider multiple parameters (P/V, kLa, tip speed) can help achieve this [75].
4. What is a modern seed-train process, and how can it improve efficiency? A conventional seed train involves multiple manual steps from vial thaw to production bioreactor, which is time-consuming and increases contamination risk [77]. A modern approach integrates:
- High-Density Cell Banking: Freezing cells at very high densities (e.g., 50-100 million cells/mL) to eliminate several intermediate expansion steps [77].
- Single-Use Bioreactors: Using disposable Wave-type bioreactors to reduce setup time and contamination risk [77].
- N-1 Perfusion: Operating the final seed bioreactor (the N-1 stage) in perfusion mode to achieve very high cell densities (≥50 x 10^6 cells/mL). This allows for a high inoculation density in the production bioreactor, reducing the growth phase by 4-5 days and increasing overall productivity [77].
5. Our viable cell concentration drops during process transfer. What should we investigate? A drop in VCC is often one of the first signs of a scale-up issue [75]. Focus your investigation on:
- Shear Stress and Agitation: Review your scaling parameters for agitation. While mammalian cells are sensitive to high shear, too low of an agitation rate can lead to poor mixing and nutrient distribution. Use scaling principles like constant power per unit volume (P/V) or tip speed to find the "sweet spot" [75] [72].
- Dissolved Oxygen (DO) and Gas Sparging: Ensure the mass transfer coefficient (kLa) for oxygen is consistent across scales. The sparging strategy (flow rate, bubble size) at the 50 L scale can create localized zones of high shear or osmolality, damaging cells [75].
- Feed Strategy: Confirm that nutrient delivery and mixing times in the 50 L bioreactor prevent the formation of zones where cells are starved of key nutrients [72].
Troubleshooting Guide
| Observable Problem | Potential Root Cause | Recommended Investigation & Solution |
|---|---|---|
| Low Viable Cell Density & Viability | • Inoculation density too low.• High shear from agitation/sparging.• Nutrient depletion or metabolite (e.g., lactate/ammonia) buildup.• Inconsistency with seed train process. | • Confirm seeding density is optimal (e.g., 0.2-0.5 x 10^6 cells/mL for many lines) [77].• Review scale-up parameters (P/V, tip speed); consider using a scaling tool [75].• Analyze metabolic profiles (glucose, lactate) and adjust feed strategy accordingly. |
| Altered Critical Quality Attributes (CQAs) | • pH or dissolved CO2 gradients in large tank [72].• Differences in trace element or feed exposure.• Cell line instability over long culture duration [73]. | • Qualify scale-down model for its ability to predict product quality [71].• Use a QbD approach to identify CPPs impacting CQAs and establish a control strategy [71].• Ensure use of a low-passage, well-characterized cell bank [73]. |
| Long Lag Phase Post-Inoculation | • Low inoculation viability.• Sub-optimal culture environment in production bioreactor (pH, DO, temperature).• Extended seed train leading to cellular senescence. | • Optimize cryopreservation and thaw protocols [78].• Pre-equilibrate the production bioreactor to setpoints before inoculation.• Implement a high-density perfusion N-1 process to reduce the seed train timeline and inoculate at high density [77]. |
| Poor Comparability to Bench-Scale Data | • Non-qualified scale-down model (SDM).• Differences in bioreactor geometry (H/T, D/T ratios) or impeller type [75] [72].• Inconsistent process control strategy. | • Rigorously qualify the SDM by demonstrating comparable performance (growth, titer, CQAs) to the intended commercial scale [71].• During development, use mini-bioreactors with geometric similarity to larger scales [75]. |
Experimental Protocols for Key Activities
Protocol 1: Qualification of a Scale-Down Model for a 50 L Bioreactor
Objective: To demonstrate that a small-scale (e.g., 2 L) bioreactor system accurately reproduces the performance and product quality profile of the 50 L production bioreactor.
Materials:
- Working Cell Bank (WCB) vial.
- Chemically defined, serum-free media and feeds.
- Qualified 2 L bench-top bioreactor and 50 L pilot-scale bioreactor.
- Analytics for cell count, viability, metabolites, titer, and CQAs.
Methodology:
- Process Risk Assessment: Conduct a Failure Mode and Effects Analysis (FMEA) to identify parameters most likely to cause scale-up differences [71].
- Define Scale-Down Parameters: Based on the 50 L bioreactor's characteristics, calculate the target parameters for the 2 L model. This typically involves maintaining constant:
- Parallel Bioreactor Runs: Run the same cell line and process in triplicate in both the qualified 2 L SDM and the 50 L bioreactor.
- Data Collection & Analysis: Monitor online parameters (pH, DO, temperature) and take frequent samples for off-line analysis (VCC, viability, metabolites, titer, and key CQAs).
- Statistical Comparison: Compare the time-course data and end-point results for all key performance indicators (KPIs) and CQAs. The SDM is considered qualified if the data from the 2 L and 50 L systems show no statistically significant differences or trends that would impact process decision-making [71].
Protocol 2: Implementing a High-Density N-1 Perfusion Seed Train
Objective: To reduce the growth phase in a 50 L production bioreactor by achieving a high inoculation density (e.g., 5 x 10^6 cells/mL) using a perfusion N-1 seed bioreactor.
Materials:
- High-density cell bank vial [77].
- Single-use Wave bioreactors (2 L and 20 L).
- N-1 Bioreactor (e.g., 10 L) equipped with an Alternating Tangential Flow (ATF) or similar perfusion device [77].
- Perfusion media.
Methodology:
- Thaw and Initial Expansion: Thaw a high-density vial directly into a 2 L Wave bioreactor. Expand cells into a 20 L Wave bioreactor until a sufficient cell mass is achieved.
- Inoculate N-1 Bioreactor: Seed the N-1 bioreactor at a standard density (e.g., 0.5 x 10^6 cells/mL) and operate in batch mode for the first ~2 days.
- Initiate Perfusion: Start perfusion once the cell density reaches ~2-3 x 10^6 cells/mL. Begin with a cell-specific perfusion rate (CSPR) of 0.2 nL/cell/day.
- Control Perfusion Rate: As the cell density increases, ramp up the perfusion rate to maintain the CSPR. The perfusion rate can be capped at 4 reactor volumes per day once a high cell density (e.g., 20 x 10^6 cells/mL) is reached.
- Harvest and Inoculate: When the N-1 bioreactor reaches the target density (e.g., 50 x 10^6 cells/mL), harvest the cells and use them to inoculate the 50 L production bioreactor at the desired high seeding density. This can reduce the production bioreactor growth phase by 4-5 days [77].
Quantitative Data for Process Planning
Table 1: Key Scaling Parameters for Transfer from 2 L to 50 L Bioreactor (Example)
| Scaling Criterion | 2 L Bioreactor | 50 L Bioreactor | Impact & Consideration |
|---|---|---|---|
| Power/Volume (P/V) | 50 W/m³ | 50 W/m³ | Maintains similar shear environment. A common scaling target [72]. |
| Impeller Tip Speed | 1.5 m/s | 1.5 m/s | Prevents damage from excessive shear at the impeller tip [75]. |
| Volumetric Flow Rate (vvm) | 0.05 vvm | 0.05 vvm | Keals constant volumetric gas flow. Can cause issues if used alone across vastly different scales [75]. |
| kLa (Oxygen Mass Transfer) | 20 h⁻¹ | 20 h⁻¹ | Ensures consistent oxygen supply to cells. Can be a primary scaling factor [72]. |
| Mixing Time | ~20 s | ~60 s | Mixing is slower at large scale, leading to potential gradients. Must be evaluated [72]. |
Table 2: Accelerated Timeline for Cell Line Development and Process Characterization
| Development Stage | Standard Timeline | Accelerated Timeline (e.g., Pandemic Speed) | Key Accelerating Strategies [71] |
|---|---|---|---|
| Early-Stage (DNA to IND) | 12-16 months | ~6 months | Targeted integration, use of non-clonal pools for Tox studies, platform processes. |
| Late-Stage (Process Lock to PPQ) | ~12 months | ~4 months | Using RCB for early PC, parallel activities, leveraging GMP campaign materials. |
Workflow and Strategy Visualization
Diagram 1: Integrated Workflow from Cell Bank to GMP Campaign. This diagram outlines the critical path from cell bank creation to successful Process Performance Qualification (PPQ), highlighting key stages and acceleration strategies (yellow nodes) that compress the overall timeline.
Diagram 2: Core Strategy for Bioreactor Scale-Up. This diagram illustrates the fundamental principle of managing both scale-independent and scale-dependent parameters, using an integrated scaling tool to find a balanced "sweet spot" for successful transfer.
The Scientist's Toolkit: Essential Research Reagent Solutions
Table 3: Key Materials and Reagents for a Successful Campaign
| Item | Function & Importance in the Context of this Case Study |
|---|---|
| Chemically Defined, Serum-Free Media | Provides a consistent, animal-component-free nutrient base. Essential for regulatory compliance and reducing variability during scale-up [78] [3]. |
| High-Density Cell Bank | A cryopreserved bank with high cell density per vial (e.g., 50-100 x 10^6 cells/mL). Used to eliminate several seed train steps, significantly accelerating the timeline to production [77]. |
| Automated Micro-Bioreactor System (e.g., ambr) | High-throughput, controlled mini-bioreactors. Critical for rapid clone screening, process optimization, and generating high-quality data for predictive scale-up in weeks instead of months [75] [76]. |
| Perfusion Device (e.g., ATF/TFF) | Technology for cell retention in perfusion culture. Enables the high-density N-1 seed train process, leading to reduced production bioreactor growth phases [77]. |
| CRISPR/Cas9 System | Gene-editing tool. Can be used for cell line engineering to knock out genes (e.g., apoptosis gene Apaf1) to improve culture longevity and recombinant protein yield [3]. |
| Vector Regulatory Elements (Kozak/Leader) | Genetic sequences added to the expression vector upstream of the target gene. Demonstrated to significantly increase the translation efficiency and expression level of recombinant proteins [3]. |
| Scale-Down Model (SDM) Bioreactor | A lab-scale bioreactor (e.g., 2 L) rigorously qualified to mimic the performance of the commercial-scale vessel. Essential for representative process characterization and troubleshooting [71]. |
Core Concepts and Definitions
What is the primary goal of a long-term stability study? The primary goal is to ensure that a cell line maintains its genetic and phenotypic characteristics over extended periods and numerous population doublings. This ensures consistent results in applications like recombinant protein production and drug screening, safeguarding data reliability and reproducibility. [73]
Why is assessing stability over 70 population doublings particularly important? Evaluating stability over a high number of doublings, such as 70, is crucial to validate that the cell line can withstand the demands of large-scale biomanufacturing without suffering from genetic drift, loss of productivity, or phenotypic instability. This is especially vital for industrial processes where consistent performance over 60 to 100 generations may be required. [73] [79]
Troubleshooting Guides
Problem: Observed Genetic Drift or Instability
Q: My cell line is showing unexpected genetic variations after approximately 50 doublings. What could be the cause and how can I address it?
Potential Causes:
- Accumulation of spontaneous mutations: Genetic drift occurs as mutations build up over many divisions. [73]
- Selective pressure from suboptimal culture conditions: Subtle changes in media composition, pH fluctuations, or oxygen levels can favor the growth of certain subpopulations. [73]
- High passage frequency: Minimizing passage number is a recommended best practice to reduce the risk of drift. [73]
Solutions:
- Return to Early-Passage Stocks: Always return to your characterized master or working cell bank to reset the genetic clock. [73]
- Standardize Culture Protocols: Use consistent reagents, media formulations, and standardized protocols to minimize selective pressures. [73]
- Implement Routine Monitoring: Establish a schedule for cell authentication (e.g., STR profiling) and karyotyping to detect chromosomal abnormalities early. [73]
Problem: Decline in Recombinant Protein Productivity
Q: The productivity of my stable cell pool is decreasing significantly over long-term culture. How can I troubleshoot this?
Potential Causes:
- Loss of transgene expression: The genetic construct for the recombinant protein may be silenced or lost over time. [80]
- Onset of cellular senescence: Cells may enter a senescent state, characterized by reduced proliferation and function, at higher doublings. [79]
- Metabolic stress or nutrient depletion: Media formulations optimized for short-term growth may not support long-term consistent function. [73]
Solutions:
- Use Targeted Integration Methods: Employ engineered cell lines with targeted integration sites (e.g., landing pads) to generate more homogenous and stable cell pools, ensuring consistent productivity. [80]
- Monitor Senescence Markers: Assess markers like β-galactosidase activity and expression of cell cycle inhibitors p16 and p21 to identify the onset of senescence. [79]
- Optimize Culture Media: Use advanced optimization methods, such as Bayesian Optimization, to develop chemically defined, serum-free media that support long-term health and productivity, reducing batch-to-batch variability. [73] [81]
Problem: Phenotypic Destabilization in Primary or Specialized Cells
Q: I am working with embryonic tendon cells and observe a loss of phenotypic markers (e.g., scleraxis, tenomodulin) during in vitro expansion. How can I maintain phenotype?
Potential Causes:
Solutions:
- Establish a Maximum Doubling Level: Based on research, it is recommended to use chick embryo tendon cells before a maximum cumulative doubling level of 12 (passage 4) to avoid phenotype destabilization and senescence. [79]
- Characterize Stage-Specific Behavior: Understand that the stability of the phenotype can be specific to the developmental stage of the isolated cells. [79]
Quantitative Stability Metrics and Data Interpretation
The following table summarizes key quantitative findings from relevant long-term stability research, which can serve as a benchmark for your experiments.
Table 1: Experimental Observations on Phenotypic Stability and Senescence
| Cell Type | Cumulative Population Doublings (CPD) | Key Observations | Recommended Action |
|---|---|---|---|
| Chick Embryo Tendon Cells (HH40) [79] | ~12 (Passage 4) | Significant downregulation of tendon markers (scleraxis, tenomodulin); onset of senescence based on p16/p21 expression & β-galactosidase activity. | Use cells before CPD 12 to avoid phenotype loss. [79] |
| Chick Embryo Tendon Cells (HH42) [79] | ~12 (Passage 4) | Earlier downregulation of phenotype markers and susceptibility to senescence compared to HH40 cells. | Use earlier-stage cells if longer expansion is required. [79] |
| Stable Cell Pools (General Bioprocessing) [73] | 60-100 generations | Consistent performance over this range may be required for validation in biomanufacturing. | Implement rigorous monitoring and bank management. [73] |
Essential Experimental Protocols
Protocol 1: Monitoring Senescence and Phenotype Stability
Objective: To assess the onset of cellular senescence and the stability of phenotypic markers over multiple population doublings. [79]
- Cell Culture and Passaging: Seed cells at a standardized density (e.g., 20,000 cells/cm²). Culture until ~90% confluency, then trypsinize and harvest.
- Calculate Cumulative Population Doublings (CPD):
- Use the formula:
CPD = 3.32 × (log(N1) - log(N0)) + CPD₀ - Where
N0andN1are cell numbers at the beginning and end of the passage, andCPD₀is the CPD of the previous passage. [79]
- Use the formula:
- Senescence-Associated β-Galactosidase Staining:
- At each passage, re-plate a portion of harvested cells at a low density and culture for 24 hours.
- Fix and stain cells using a commercial β-galactosidase staining kit according to manufacturer instructions.
- Quantify the percentage of β-galactosidase-positive cells using image analysis software (e.g., ImageJ). [79]
- Gene Expression Analysis (RT-PCR):
- Harvest cells at each passage for RNA isolation.
- Perform reverse-transcription polymerase chain reaction (RT-PCR) to measure expression levels of phenotype-specific markers (e.g., scleraxis, tenomodulin for tendon cells) and senescence markers (e.g., p16, p21). [79]
Protocol 2: Ensuring Genetic Stability
Objective: To verify cell line identity and detect genetic abnormalities that may arise during long-term culture. [73]
- Cell Authentication via STR Profiling:
- Extract genomic DNA from cell samples at regular intervals (e.g., every 15-20 doublings).
- Perform Short Tandem Repeat (STR) profiling and compare the results to a reference profile from the master cell bank to confirm identity. [73]
- Karyotyping:
- At key time points (e.g., beginning, middle, and end of the study), prepare metaphase chromosomes from cells.
- Analyze the chromosomes for number and structural abnormalities to detect gross genomic changes. [73]
Experimental Workflow and Stability Assessment
The following diagram illustrates the logical workflow for conducting a long-term stability study.
The Scientist's Toolkit: Research Reagent Solutions
Table 2: Essential Materials for Long-Term Stability Studies
| Reagent / Material | Function in Stability Studies | Key Considerations |
|---|---|---|
| Master and Working Cell Banks [73] | Provides a genetically defined starting point and backup; essential for resetting cultures and confirming stability. | Cryopreserve early-passage cells. Characterize fully (STR, karyotype) before creating banks. |
| Chemically Defined, Serum-Free Media [73] [81] | Supports consistent cell growth and function; reduces variability and risk of contamination from serum. | Optimize for long-term health, not just short-term growth. Consider advanced optimization methods. |
| Senescence Detection Kits (e.g., β-Galactosidase) [79] | Histochemical detection of senescent cells in culture. | Quantitative analysis requires careful counting and image analysis. |
| qRT-PCR Assays for Phenotype & Senescence Markers [79] | Quantifies expression of key genes to monitor phenotypic stability and onset of senescence. | Assays for markers like SCX, TNMD, p16, and p21 are crucial. |
| STR Profiling Kits [73] | Authenticates cell line identity and detects cross-contamination over time. | Perform at regular intervals and compare to the master bank profile. |
| Karyotyping Kits/Services [73] | Detects gross chromosomal abnormalities and aneuploidy that can accumulate over many doublings. | A key tool for assessing genomic stability at a macroscopic level. |
Conclusion
The strategic optimization of stable cell pool selection is no longer a bottleneck but a powerful enabler for accelerated biologics development. By integrating high-throughput automation, advanced genetic tools like transposase and CRISPR-Cas9, and engineered host cells, timelines can be compressed from over three months to as little as seven weeks without sacrificing product quality or titer. The move towards stable pool-based screening and intensified processes further derisks development and provides early, material for critical downstream activities. Future directions will likely see increased adoption of AI-driven clone selection and a greater focus on designing cell lines specifically for intensified and continuous perfusion manufacturing, solidifying this optimized approach as the new standard for efficient and scalable therapeutic development.
References
- 1. Utilizing Stable Gene‐Edited Knockout Pools for Genetic ... [https://pmc.ncbi.nlm.nih.gov/articles/PMC12082383/]
- 2. Biologic Manufacturing: Process, Steps, and Challenges [https://www.susupport.com/blogs/knowledge/biologics-manufacturing-process-steps-challenges]
- 3. Optimization of a novel expression system for recombinant ... [https://www.nature.com/articles/s41598-024-76995-6]
- 4. Streamlining Cell Line Development for Faster Biologics ... [https://finance.yahoo.com/news/streamlining-cell-line-development-faster-133000902.html]
- 5. Cell Line Engineering & Development - 2025 Archive [https://www.bioprocessingsummit.com/25/cell-line-development]
- 6. What's Killing My Cell Cultures? Troubleshooting ... [https://www.corning.com/worldwide/en/products/life-sciences/resources/stories/at-the-bench/what-is-killing-my-cell-cultures-troubleshooting-cell-growth-issues.html]
- 7. Cell Culture Troubleshooting [https://www.sigmaaldrich.com/US/en/applications/cell-culture-and-cell-culture-analysis/cell-culture-troubleshooting?srsltid=AfmBOorf4IuGW8mqw6J_8rlrm7V2xslvtrcL9l2MxFCVAaJRjhqgzYYT]
- 8. Stable Cell Line Generation: Methods & Protocol [https://lifesciences.danaher.com/us/en/library/stable-cell-line-generation.html]
- 9. BMS HTP Cell Line Platform Compresses The Scale-Up ... [https://www.bioprocessonline.com/doc/bms-htp-cell-line-platform-compresses-the-scale-up-timeline-0001]
- 10. Genetic Stability Testing Using NGS and MAM [https://www.genedata.com/resources/learn/details/blog/cho-cell-lines-characterization-with-ngs]
- 11. Generating Cell Pools and Cell Lines [https://www.bioprocessintl.com/sponsored-content/shortening-clinical-development-timelines-using-novel-technology-for-generating-stable-high-producing-cell-pools-and-cell-lines]
- 12. Customized CHO Cell Line Development Solutions for ... [https://www.sartorius.com/en/knowledge/science-snippets/success-in-cho-cell-line-development-1740240]
- 13. Machine learning-driven optimization of culture conditions ... [https://pmc.ncbi.nlm.nih.gov/articles/PMC12355708/]
- 14. CRISPR-Cas9 Genome Editing and Rapid Selection of ... [https://pmc.ncbi.nlm.nih.gov/articles/PMC9793982/]
- 15. Rapid Development and Optimization of Cell Culture Media [https://www.biopharminternational.com/view/rapid-development-and-optimization-cell-culture-media]
- 16. Cell Culture Troubleshooting [https://www.sigmaaldrich.com/US/en/applications/cell-culture-and-cell-culture-analysis/cell-culture-troubleshooting?srsltid=AfmBOorhJgroMYf3UphAloH6g22Sjwg8c4Sa3aBtJjetzEtCQZswSxK6]
- 17. CRISPR Screen Analysis: Expert Troubleshooting Q&A [https://www.ubigene.us/application/crispr-screening-data-analytics-faq.html]
- 18. Cell Line Development with Leap-In Transposase [https://atum.bio/cell-line-development/]
- 19. Leveraging Innovative Transposase Technology for a ... [https://wheelerbio.com/leveraging-innovative-transposase-technology-for-a-highly-reliable-and-productive-cmc-platform/]
- 20. Warp Speed Biomanufacturing: A New Era for Antibody ... [https://www.ailurus.bio/post/warp-speed-biomanufacturing-a-new-era-for-antibody-development]
- 21. Cell Line Development: Accelerating Process Optimization ... [https://www.sartorius.com/en/products/biolayer-interferometry/bli-resources/cell-line-development-accelerating-process-optimization-by-combining-ambr-15-cell-culture-with-octet-titer-measurements]
- 22. High-Throughput Cell-Line Development [https://www.genengnews.com/topics/bioprocessing/high-throughput-cell-line-development/]
- 23. Analytical Tools for Cell Line Development Improvement [https://www.bioprocessintl.com/sponsored-content/ask-the-expert-analytical-tools-to-accelerate-cell-line-development-workflows]
- 24. Cell-Line Development: Next Generation Platforms [https://www.bioprocessintl.com/sponsored-content/building-the-next-generation-of-cell-line-development-platforms]
- 25. Cell Engineering for Increasing Production of Recombinant ... [https://link.springer.com/article/10.1007/s40259-025-00753-x]
- 26. New InstiGRO™ CHO PLUS [https://www.aicompanies.com/new-instigro-cho-plus/]
- 27. Enhanced homology-directed human genome engineering ... [https://elifesciences.org/articles/04766]
- 28. Efficient Delivery of CRISPR-Cas9 RNP Complexes with ... [https://pmc.ncbi.nlm.nih.gov/articles/PMC12608112/]
- 29. Strategies in the delivery of Cas9 ribonucleoprotein for ... [https://pmc.ncbi.nlm.nih.gov/articles/PMC7738854/]
- 30. CRISPR Delivery Methods: Cargo, Vehicles, and Challenges [https://www.synthego.com/blog/delivery-crispr-cas9/]
- 31. Stable Knockout Cell Line Generation [https://www.creative-biogene.com/Services/Stable-cell-line-generation/Custom-Genome-Editing-Cell-Lines.html]
- 32. Delivering CRISPR: a review of the challenges and approaches [https://pmc.ncbi.nlm.nih.gov/articles/PMC6058482/]
- 33. CRISPR-Cas9 Troubleshooting | Blog [https://go.zageno.com/blog/crispr-cas9-troubleshooting]
- 34. Improve Transfection in Difficult Cell Lines [https://www.bocsci.com/resources/proven-strategies-to-improve-transfection-efficiency-in-difficult-cell-lines.html?srsltid=AfmBOoqs6WTfBOa-DF4neVS4XR66eAHjL2e6xT3JTi1WrP_Xnkf-Q5x2]
- 35. Optimizing Cell Transfection Conditions in "Four Steps" [https://www.linkedin.com/pulse/optimizing-cell-transfection-conditions-four-steps-say-goodbye-07mqc]
- 36. Optimizing the delivery of CRISPR/Cas9 ... [https://www.sciencedirect.com/science/article/abs/pii/S0378111925005049]
- 37. Optimization of chemical transfection in airway epithelial cell ... [https://bmcbiotechnol.biomedcentral.com/articles/10.1186/s12896-025-00945-x]
- 38. Efficient production of bispecific antibodies—optimization ... [https://pmc.ncbi.nlm.nih.gov/articles/PMC10365153/]
- 39. Optimizing Bispecific Antibody Stability in Manufacturing [https://www.leukocare.com/blog/optimizing-manufacturing-process-for-bispecific-stability]
- 40. Bispecific antibody development: Effective solutions explored [https://www.evitria.com/journal/bispecific-antibodies/development-of-bispecific-antibodies-challenges-solutions/]
- 41. How to select the optimal bispecific antibody format for ... [https://www.drugtargetreview.com/article/181940/how-to-select-the-optimal-bispecific-antibody-format-for-therapeutic-success-2/]
- 42. A high-throughput screening and computation platform for ... [https://pmc.ncbi.nlm.nih.gov/articles/PMC6599391/]
- 43. Me First! How Do I Optimize a Vector with Multiple Genes? [https://en.vectorbuilder.com/resources/vector-academy/troubleshooting/lentivirus-polycistron-position.html]
- 44. Cell Line FAQs [https://bpsbioscience.com/cell-line-faq]
- 45. CRISPR Knockout (KO) Cell Pools: Approach to Study ... [https://www.ubigene.us/application/knockout-cell-pool-gene-function-study.html]
- 46. CRISPR-edited T Cell Lines [https://www.editco.bio/knockout-tcells]
- 47. Cell Line Engineering Services [https://www.thermofisher.com/us/en/home/life-science/genome-editing/genome-engineering-services/cell-line-engineering-services.html]
- 48. What is homology-directed repair (HDR)? | IDT [https://www.idtdna.com/page/support-and-education/decoded-plus/hdr-what-is-it-and-how-can-yours-improve/]
- 49. Modulation of cell cycle increases CRISPR-mediated ... [https://pmc.ncbi.nlm.nih.gov/articles/PMC10676593/]
- 50. Modulation of cell cycle increases CRISPR-mediated homology-directed DNA repair | Cell & Bioscience | Full Text [https://cellandbioscience.biomedcentral.com/articles/10.1186/s13578-023-01159-4]
- 51. Methodologies for Improving HDR Efficiency [https://www.frontiersin.org/journals/genetics/articles/10.3389/fgene.2018.00691/full]
- 52. Enrichment of G2/M cell cycle phase in human pluripotent stem cells enhances HDR-mediated gene repair with customizable endonucleases | Scientific Reports [https://www.nature.com/articles/srep21264]
- 53. Improving HDR efficiency with Alt-R HDR Enhancer V2 | IDT [https://www.idtdna.com/page/support-and-education/decoded-plus/improving-efficiency-of-homology-directed-repair-hdr-with-alt-r-hdr-enhancer-v2/]
- 54. Optimizing CRISPR methodology for precise gene editing ... [https://pmc.ncbi.nlm.nih.gov/articles/PMC12580712/]
- 55. Small Molecule CRISPR Enhancers [https://www.sigmaaldrich.com/US/en/technical-documents/technical-article/genomics/advanced-gene-editing/small-molecule-crispr-enhancers]
- 56. Monoclonality, Monoclonal Cell Lines, Antibodies [https://www.moleculardevices.com/applications/monoclonality]
- 57. Cell Isolation Methods 2025: Single-Cell Technologies Guide [https://semionics.com/cell-isolation-methods-2025-guide/]
- 58. Finding the Holy Grail of Cell Line Development: Viable ... [https://www.sartorius.com/en/knowledge/science-snippets/finding-the-holy-grail-of-cell-line-development-1386574]
- 59. Q&A: How to Maximise Cell Line Productivity and Efficiency [https://www.lonza.com/knowledge-center/biologics/i/lic-maximize-cell-line-productivity]
- 60. Multiparametric Clone-Selection and Feed-Optimization ... [https://www.bioprocessintl.com/cell-culture-media/reducing-timelines-in-early-process-development-using-a-multiparametric-clone-selection-and-feed-optimization-strategy]
- 61. Selection of high-producing clones by a relative titer ... [https://pmc.ncbi.nlm.nih.gov/articles/PMC8350677/]
- 62. Cell Culture Trends To Watch In 2025 [https://www.bioprocessonline.com/doc/cell-culture-trends-to-watch-in-0001]
- 63. Comprehensive and unbiased multiparameter high ... [https://elifesciences.org/articles/73760]
- 64. Multiparametric analysis of flow cytometry data [https://www.cytognos.com/academy/software/multiparametric-analysis-of-flow-cytometry-data/]
- 65. Multi-Parallel Bioreactors [https://www.sartorius.com/en/products/fermentation-bioreactors/ambr-multi-parallel-bioreactors]
- 66. Ambr® 15 Cell Culture Bioreactor System [https://www.sartorius.com/en/products/fermentation-bioreactors/ambr-multi-parallel-bioreactors/ambr-15-cell-culture]
- 67. Design and development of a new ambr250® bioreactor ... [https://pmc.ncbi.nlm.nih.gov/articles/PMC8043889/]
- 68. Process mapping and optimization study of CHO cell ... [https://pubmed.ncbi.nlm.nih.gov/40884591/]
- 69. Design of Experiments with Small-Scale Bioreactor Systems [https://www.bioprocessintl.com/process-development/design-of-experiments-with-small-scale-bioreactor-systems-efficient-bioprocess-development-and-optimization]
- 70. Cell Line Development Market Outlook Report 2025-2034 [https://finance.yahoo.com/news/cell-line-development-market-outlook-163000931.html]
- 71. Upstream cell culture process characterization and in ... [https://pmc.ncbi.nlm.nih.gov/articles/PMC8986202/]
- 72. Exploring Principles of Bioreactor Scale-Up [https://www.bioprocessintl.com/bioreactors/lessons-in-bioreactor-scale-up-part-1-mdash-exploring-introductory-principles]
- 73. Optimizing Cell Line Stability for Long-Term Research [https://cellculturecompany.com/optimizing-cell-line-stability-for-long-term-research/]
- 74. Cell Culture FAQs [https://lifescience.invitro.com.au/l/cell-culture-faqs]
- 75. Current Challenges with Cell Culture Scale-up for ... [https://www.biopharminternational.com/view/current-challenges-with-cell-culture-scale-up-for-biologics-production]
- 76. Next-generation cell line selection methodology leveraging ... [https://pmc.ncbi.nlm.nih.gov/articles/PMC10277482/]
- 77. A Novel Seed-Train Process: Using High-Density Cell ... [https://www.bioprocessintl.com/single-use/a-novel-seed-train-process-using-high-density-cell-banking-a-disposable-bioreactor-and-perfusion-technologies]
- 78. FAQ: How to Enhance The Success of Your Cell Culture [https://www.lifelinecelltech.com/faq-how-to-enhance-the-success-of-your-cell-culture/?srsltid=AfmBOorZjO1ry9iXwhuiNhAJ8QdaH9m9-Z0ehrYfDrKrm5egIVoH4Kye]
- 79. Phenotype stability, expansion potential, and senescence ... [https://pmc.ncbi.nlm.nih.gov/articles/PMC11471017/]
- 80. Optimizing Cell Line Development for High-Quality Biologics [https://www.bioprocessintl.com/cell-line-development/optimizing-cell-line-development-for-high-quality-biologics]
- 81. Accelerating cell culture media development using ... [https://www.nature.com/articles/s41467-025-61113-5]