Beyond the Monolayer: How 3D Cell Culture Reshapes Gene Expression for More Predictive Disease Models
This article provides a comprehensive comparison of gene expression profiles in 2D versus 3D cell culture models, tailored for researchers and drug development professionals.
Beyond the Monolayer: How 3D Cell Culture Reshapes Gene Expression for More Predictive Disease Models
Abstract
This article provides a comprehensive comparison of gene expression profiles in 2D versus 3D cell culture models, tailored for researchers and drug development professionals. It explores the foundational principles of how spatial architecture influences genomic regulation, details methodological approaches for establishing 3D cultures, addresses common troubleshooting and optimization challenges, and validates the superior physiological relevance of 3D models through comparative analysis with in vivo data. The synthesis of current evidence underscores that 3D cultures more accurately recapitulate in vivo-like gene expression, offering transformative potential for drug discovery, personalized medicine, and reducing preclinical attrition rates.
The Genomic Shift: Uncovering the Fundamental Impact of 3D Architecture on Gene Expression
The cellular microenvironment encompasses all the physical, chemical, and biological cues that surround a cell, fundamentally governing its behavior and function. This includes interactions with neighboring cells, signaling molecules, mechanical forces, and the three-dimensional extracellular matrix (ECM) [1] [2]. In vitro modeling of this complex milieu is crucial for advancing our understanding of cell biology, particularly in cancer research and drug development. For decades, traditional two-dimensional (2D) cell culture has been the standard workhorse in biological research due to its simplicity and cost-effectiveness [3] [4]. However, the scientific community increasingly recognizes that cells grown in flat, rigid monolayers exhibit altered morphology, polarity, and gene expression, limiting their physiological relevance [2].
This recognition has driven the shift toward three-dimensional (3D) cell culture models, which aim to bridge the gap between conventional 2D cultures and in vivo conditions [1] [5]. By allowing cells to grow and interact in all three dimensions, these models better recapitulate the architectural and functional complexities of living tissues [4]. The transition from 2D to 3D is not merely a technical improvement but a paradigm shift that more accurately mimics the dynamic cell-cell and cell-matrix interactions within the native tumor microenvironment (TME), thereby offering more predictive insights for clinical translation [5]. This guide provides a comprehensive, data-driven comparison of these two systems, with a particular focus on their implications for gene expression research.
Fundamental Differences Between 2D and 3D Culture Systems
The core distinction between these models lies in their spatial geometry, which fundamentally shapes the cellular experience. In 2D cultures, cells are forced to adopt unnatural, flattened morphologies as they adhere to a rigid plastic or glass surface [4]. This disrupts normal cell polarity and creates uniform, often unlimited, access to nutrients, oxygen, and therapeutic agents [6] [2]. In contrast, 3D cultures enable cells to assemble into tissue-like structures, such as spheroids or organoids, restoring natural cell-ECM interactions and establishing physiochemical gradients (e.g., of oxygen, nutrients, and pH) that are characteristic of real tissues [3] [6].
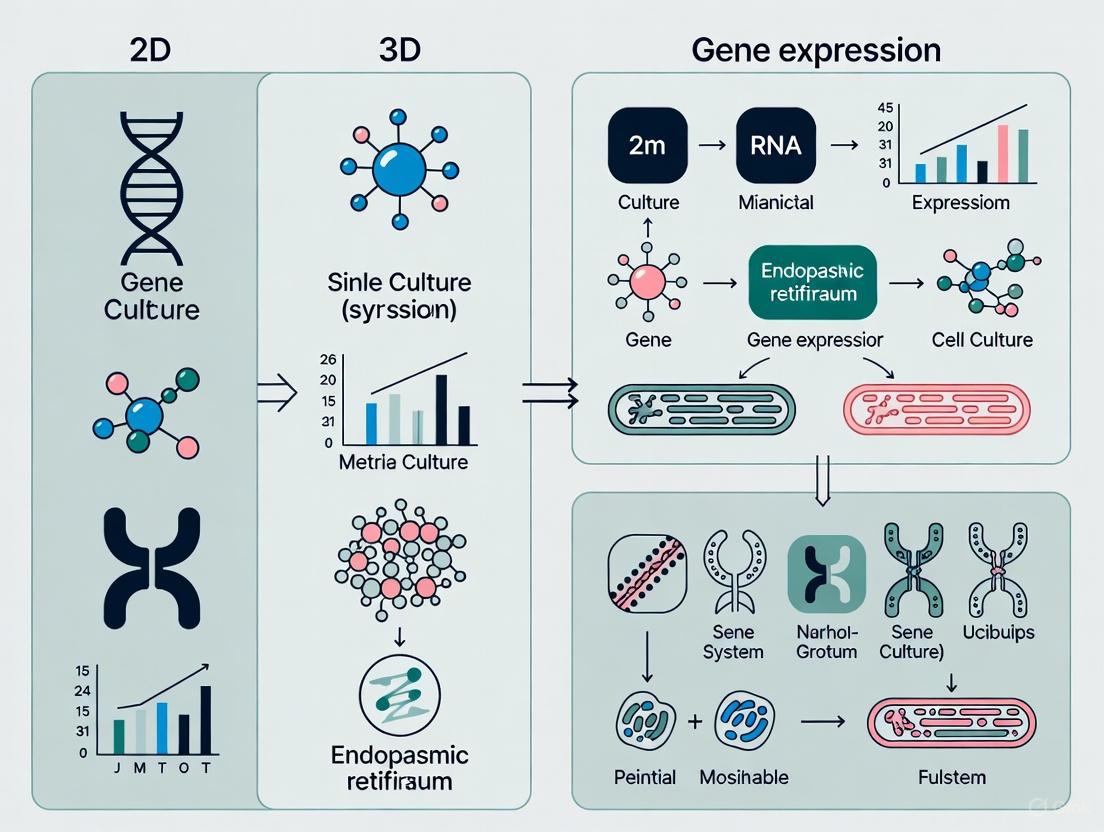
The following diagram illustrates the key architectural and microenvironmental differences that arise from these fundamental design principles.
Architectural and Microenvironmental Differences Between 2D and 3D Cultures
These structural differences have profound functional consequences. The table below summarizes the core characteristics that distinguish these two models.
| Parameter | 2D Cell Culture | 3D Cell Culture |
|---|---|---|
| Spatial Architecture | Flat monolayer on a rigid surface [2] [4] | Three-dimensional, tissue-like structures (e.g., spheroids, organoids) [5] [4] |
| Cell Morphology & Polarity | Altered, spread-out morphology; loss of natural polarity [2] [4] | Preserved native morphology and polarity [2] |
| Cell-Cell & Cell-ECM Interactions | Limited and unnatural interactions [2] [4] | Complex, physiologically relevant interactions [1] [5] |
| Access to Nutrients/Oxygen | Uniform and unlimited access [6] [2] | Creates physiological gradients (e.g., hypoxic cores) [3] [6] |
| Proliferation | Rapid, uniform proliferation [1] | Heterogeneous proliferation with quiescent zones [1] [6] |
| Gene Expression Profile | Altered, does not reflect in vivo conditions well [1] [4] | Closer mimicry of in vivo gene expression [1] [4] |
| Drug Penetration & Response | Direct exposure, often overestimating efficacy [3] [7] | Mimics in vivo drug penetration barriers, more predictive response [1] [7] |
Experimental Data: A Quantitative Comparison
Empirical evidence consistently demonstrates that the choice of culture model significantly impacts experimental outcomes, from basic cell growth to responses to chemotherapeutic agents.
Cell Growth and Viability
A 2023 study on colorectal cancer (CRC) cell lines reported that cells grown in 3D cultures displayed a significant (p < 0.01) difference in their pattern of cell proliferation over time compared to 2D cultures [1]. Furthermore, the cell death phase profile was also markedly different [1]. Research using glioblastoma (U251-MG) and lung adenocarcinoma (A549) cell lines has quantified this, showing that while 2D cultures exhibit rapid, exponential growth, proliferation rates in 3D models are significantly reduced. This is likely due to the limited diffusion of nutrients and oxygen within the 3D structure, which more closely mimics the growth constraints of a solid tumor [6].
Drug Response and Resistance
Perhaps one of the most critical comparisons lies in drug sensitivity. In the CRC study, cells in 3D cultures showed a different responsiveness to standard chemotherapeutics like 5-fluorouracil, cisplatin, and doxorubicin compared to their 2D counterparts [1]. This finding is supported by earlier research on B16 F10 murine melanoma and 4T1 murine breast cancer cells, which demonstrated that cells grown in all tested 3D models showed an increased resistance to dacarbazine and cisplatin compared to the 2D system [7]. This increased resistance in 3D models is a critical finding, as it more accurately reflects the challenging reality of treating solid tumors in patients, where drug penetration and microenvironment-mediated resistance are major hurdles.
Metabolic Differences
Metabolic profiling reveals further key distinctions. A 2025 tumor-on-chip study found that 3D cultures have distinct metabolic profiles, including elevated glutamine consumption under glucose restriction and higher lactate production, indicating an enhanced Warburg effect [6]. The same study highlighted increased per-cell glucose consumption in 3D models, suggesting the presence of fewer but more metabolically active cells than in 2D cultures [6]. This metabolic rewiring is a hallmark of cancer that is poorly captured in 2D systems.
The table below consolidates these key quantitative findings from recent studies.
| Experimental Measure | Key Findings in 2D vs. 3D | Significance / Implication |
|---|---|---|
| Cell Proliferation | Significant (p < 0.01) difference in proliferation patterns over time; reduced proliferation rates in 3D [1] [6]. | 3D models better mimic the constrained growth of in vivo tumors, including quiescent cell populations. |
| Response to Chemotherapy | Altered responsiveness in 3D to 5-FU, cisplatin, doxorubicin [1]; Increased resistance to dacarbazine, cisplatin in 3D [7]. | 3D models predict clinical drug resistance more accurately, preventing overestimation of drug efficacy. |
| Metabolic Activity (Lactate Production) | Higher lactate production in 3D cultures, indicating an enhanced Warburg effect [6]. | 3D models more faithfully replicate the altered metabolic phenotype of cancer cells. |
| Glucose Consumption | Increased per-cell glucose consumption in 3D models [6]. | Suggests 3D cultures contain a population of highly metabolically active cells, reflecting tumor heterogeneity. |
| Gene Expression (Transcriptomics) | Significant (p-adj < 0.05) dissimilarity involving thousands of up/down-regulated genes in multiple pathways [1]. | 3D cultures provide a more physiologically relevant gene expression profile for studying molecular mechanisms. |
Methodologies for Comparative Studies
To generate the robust data shown above, specific and reliable experimental protocols are required. Below is a detailed workflow for a standard comparative study, from culture establishment to downstream analysis. The accompanying diagram visualizes this multi-stage process.
General Workflow for Comparative 2D vs. 3D Studies
Establishing 2D and 3D Cultures
- Cell Lines: Studies typically use established cancer cell lines (e.g., HCT-116, Caco-2, MCF-7, MDA-MB-231) or patient-derived cells [1] [5]. These are routinely maintained in standard culture flasks with appropriate media (e.g., DMEM supplemented with 10% FBS) in a humidified 5% CO2 atmosphere at 37°C [1] [5].
- 2D Culture Protocol: For experiments, cells are harvested using trypsin-EDTA and seeded into standard multi-well plates or Petri dishes at a desired density (e.g., 5 × 10³ cells/well in a 96-well plate) and allowed to adhere as a monolayer [1].
- 3D Spheroid Culture Protocol (Scaffold-Free): A common method involves using U-bottom, ultra-low attachment (ULA) 96-well microplates [1] [5]. After harvesting, an aliquot of cell suspension (e.g., 200 µL containing 5 × 10³ cells) is added into individual wells. The ULA coating and U-bottom geometry prevent cell adhesion and force self-assembly through gravity. Spheroids are maintained in a complete medium (37°C, 5% CO2) with periodic medium changes. Spheroid formation and growth are typically monitored over 72 hours [1] or longer using phase-contrast microscopy.
Key Assays for Comparison
- Proliferation Assay: The CellTiter 96 AQueous Non-Radioactive Cell Proliferation Assay (MTS assay) is widely used [1]. At designated time points, the MTS/PMS mixture is added to the wells and incubated for several hours. Metabolically active cells bio-reduce MTS into a soluble formazan product, which is quantified by measuring absorbance at 490 nm using a plate reader [1].
- Apoptosis Analysis: Apoptotic status is frequently assessed using the FITC Annexin V/Propidium Iodide (PI) staining kit and flow cytometry [1]. Cells are harvested, stained with FITC-Annexin V and PI, and analyzed. This distinguishes live (Annexin-/PI-), early apoptotic (Annexin+/PI-), late apoptotic (Annexin+/PI+), and dead (PI+) cell populations [1].
- Gene Expression Analysis (RNA sequencing): Total RNA is extracted from both 2D and 3D samples [1]. Following quality control, RNA sequencing (RNA-seq) is performed. The resulting data undergoes thorough bioinformatic analysis for differential gene expression, pathway analysis (e.g., KEGG, GO enrichment), and other transcriptomic variations [1].
The Impact on Gene Expression: A Core Focus
Transcriptomic analyses provide the most compelling evidence for the superior biological relevance of 3D models. A comprehensive 2023 study on colorectal cancer cell lines employed RNA sequencing and bioinformatic analyses to reveal significant (p-adj < 0.05) dissimilarity in the gene expression profile between 2D and 3D cultures [1]. This dissimilarity involved thousands of up- and down-regulated genes affecting multiple pathways for each cell line tested [1].
Research in breast cancer models reinforces this. Studies on MCF-7 and MDA-MB-231 spheroids showed notable differences in the expression of epithelial-to-mesenchymal transition (EMT) markers, key receptors (ERs, EGFR, IGF1R), and critical extracellular matrix molecules (syndecans, matrix metalloproteinases) compared to 2D cultures [5]. These molecular changes underpin the observed functional differences in drug response and metabolism. Epigenetically, 3D cultures also more closely resemble in vivo conditions. The CRC study found that 3D cultures and patient-derived Formalin-Fixed Paraffin-Embedded (FFPE) samples shared similar methylation patterns and microRNA expression, whereas 2D cells showed an elevated methylation rate and altered microRNA expression [1].
The Scientist's Toolkit: Essential Reagents and Materials
Successful execution of 2D versus 3D comparative studies relies on a suite of specialized reagents and tools. The following table details key solutions and their applications.
| Research Reagent / Material | Function and Application in 2D/3D Studies |
|---|---|
| Ultra-Low Attachment (ULA) Plates | U-bottom, ULA 96-well plates are essential for scaffold-free spheroid formation. Their coating prevents cell attachment, forcing cells to self-assemble into 3D spheroids [1] [5]. |
| CellTiter 96 AQueous MTS Assay | A colorimetric assay used to quantify cell proliferation and viability in both 2D and 3D formats by measuring the metabolic activity of cells [1]. |
| FITC Annexin V Apoptosis Kit | Used in conjunction with flow cytometry to distinguish and quantify live, early/late apoptotic, and necrotic cell populations following experimental treatments [1]. |
| Matrigel / ECM Hydrogels | A reconstituted basement membrane extract used for scaffold-based 3D cultures. It provides a biologically active matrix that supports complex 3D tissue morphogenesis [5]. |
| Polyhydroxybutyrate (PHB) Scaffolds | Fully synthetic, biodegradable scaffolds (e.g., electrospun membranes) that offer a reproducible and cost-effective alternative for 3D cell growth in drug screening [7]. |
| RNA Extraction Kits | Essential for obtaining high-quality RNA from 2D monolayers and 3D spheroids for subsequent transcriptomic analysis via RNA-seq or qPCR [1]. |
| Dulbecco's Modified Eagle Medium (DMEM) | A standard basal cell culture medium, typically supplemented with Fetal Bovine Serum (FBS), used for routine maintenance and experiments of many cell lines [1] [5]. |
| Trypsin-EDTA Solution | A proteolytic enzyme solution used to detach adherent cells from the culture surface for subculturing and preparing cell suspensions for assays [1] [5]. |
The collective evidence from morphological, functional, and deep molecular profiling unequivocally demonstrates that 3D cell culture models offer a more physiologically relevant platform than traditional 2D monolayers. While 2D cultures remain valuable for high-throughput screening and basic mechanistic studies due to their simplicity and low cost [3], their limitations in predicting in vivo responses are clear. The enhanced complexity of 3D models—recapitulating critical aspects of the tumor microenvironment like gradients, cell-ECM interactions, and spatial organization—leads to more accurate data on gene expression, drug resistance, and cellular metabolism [1] [5] [6].
The future of biomedical research lies not in a binary choice between 2D and 3D, but in strategic, tiered workflows that leverage the strengths of each. A common approach is to use 2D for initial high-volume screening and 3D for predictive validation and deep mechanistic investigation [3]. As 3D technologies continue to advance and integrate with other innovations like microfluidics, bioreactors, and AI-driven analytics, they are poised to dramatically improve the efficiency and success rate of drug development and the fidelity of our basic understanding of cell biology within a tissue context.
The transition from traditional two-dimensional (2D) to three-dimensional (3D) cell culture represents more than a technical advancement—it constitutes a fundamental shift in how cells perceive their microenvironment. This dimensional shift profoundly influences cellular identity, function, and metabolic programming. While 2D cultures have served as workhorses for decades due to their simplicity, cost-effectiveness, and compatibility with high-throughput screening [3], they impose artificial physical constraints that disrupt natural cell-ECM interactions, polarity, and spatial organization [2]. The growing recognition that 3D models self-assemble into structures that mimic natural tissues with proper cell-cell and cell-extracellular matrix interactions has positioned them as essential tools for understanding the intricate relationships between dimensionality, gene expression, and metabolic function [2].
This guide objectively compares how dimensional context alters fundamental biological processes, with particular emphasis on metabolic pathways and genes governing cell identity. We present supporting experimental data and methodologies to help researchers select appropriate models for specific research applications, especially in drug development and disease modeling where dimensional accuracy significantly impacts translational relevance [3] [8].
Comparative Analysis: 2D vs. 3D Culture Systems
Fundamental Differences in Microenvironment and Cellular Responses
Table 1: Core Characteristics of 2D and 3D Cell Culture Systems
| Feature | 2D Culture | 3D Culture | Biological Significance |
|---|---|---|---|
| Growth Pattern | Monolayer; flat, adherent growth [2] | Multi-layered; expands in all directions [3] | 3D architecture mimics natural tissue organization [2] |
| Cell-ECM Interactions | Limited; disrupted by artificial substrate [2] | Physiologically relevant; dynamic ECM engagement [3] | ECM interactions regulate signaling, differentiation, and survival [2] |
| Spatial Gradients | Uniform nutrient and oxygen access [2] | Natural oxygen, nutrient, and pH gradients form [3] | Gradients create microenvironments similar to in vivo conditions [3] |
| Gene Expression Profiles | Altered; does not mimic in vivo patterns [2] | More accurate; resembles in vivo expression [3] | Better predicts drug responses and disease mechanisms [3] |
| Drug Sensitivity Assessment | Often overestimates efficacy [3] | More predictive of clinical response [3] | Critical for preclinical drug development [3] |
| Cost & Technical Demand | Low cost, simple protocols [3] [2] | More expensive, technically challenging [2] | Infrastructure requirements higher for 3D systems [2] |
Experimental Evidence: Quantitative Impact of Dimensionality
Table 2: Experimentally Observed Differences Between 2D and 3D Cultures
| Parameter | 2D Culture Observations | 3D Culture Observations | Experimental Context |
|---|---|---|---|
| Proliferation Rate | Higher proliferation rates [8] | Reduced proliferation; more in vivo-like [8] | Ovarian cancer cell line (PEO4) [8] |
| Drug Response | Increased sensitivity to chemotherapeutics [3] [8] | Enhanced drug resistance; mimics tumor resistance [3] | Cisplatin and paclitaxel testing [8] |
| Gene Expression | 228 differentially expressed genes identified in metabolism [9] | More accurate gene expression fidelity [3] | Preterm birth placenta analysis [9] |
| Metabolic Pathway Activation | Altered arachidonic acid and glutathione metabolism [9] | Physiological pathway regulation [9] | Bioinformatics analysis of placental tissue [9] |
| Tumor Modeling | Homogeneous cancer cell growth [2] | Heterogeneous layers with hypoxic cores [3] | Multicellular tumor spheroids [3] |
Dimensionality-Induced Alterations in Metabolic Pathways
Key Metabolic Genes Regulated by Dimensional Context
Research comparing dimensional influences on gene expression has identified specific metabolic genes that show differential regulation between 2D and 3D environments. In a study investigating spontaneous preterm birth, which integrated bioinformatics analysis and machine learning algorithms, three key metabolism-related hub genes were identified: ANPEP, CKMT1B, and PLA2G4A [9] [10]. These genes demonstrated significant alterations in expression patterns when analyzed in a dimensional context relevant to tissue physiology.
The functional enrichment analyses of differentially expressed genes in dimensional comparisons have repeatedly highlighted disruptions in arachidonic acid metabolism and glutathione metabolism pathways [9]. These pathways play crucial roles in cellular signaling, inflammation, and oxidative stress response—processes known to be dimension-sensitive. The identification of these specific pathway alterations underscores how dimensional context can influence fundamental metabolic processes relevant to both development and disease pathogenesis.
Cancer Metabolism and Dimensionality
Comprehensive analyses of metabolic gene alterations across 32 human cancers have revealed that genes involved in lipid metabolism are the most frequently altered, followed by those involved in carbohydrate metabolism and amino acid metabolism [11]. This pattern of metabolic reprogramming is more accurately captured in 3D culture systems, which preserve the tissue architecture and microenvironmental gradients essential for proper metabolic function.
Notably, cancers with higher frequencies of metabolic gene alterations (HM supertype) demonstrate significantly worse clinical outcomes compared to those with lower alteration frequencies (LM supertype), with median overall survival of 68.9 months versus 116.2 months, respectively [11]. This clinical correlation highlights the critical importance of using physiologically relevant models that accurately capture metabolic heterogeneity when studying cancer biology and therapeutic responses.
Experimental Protocols for Dimensional Comparison Studies
3D Culture Techniques and Methodologies
Suspension Cultures on Non-Adherent Plates
Protocol: Single cells are seeded on non-adherent plates with medium; 3D structures typically form within 3 days of culture [2]. Applications: Simple, rapid formation of spheroids; suitable for high-throughput screening approaches. Technical Considerations: Some strongly adherent cell lines may require specialized plates coated with polystyrene or covalently bound hydrogel to prevent attachment [2].
Cultures in Gel-Like Substances
Protocol: Cells are embedded in Matrigel or agarose-based hydrogels. For agarose: dissolved low-melting agarose with cell medium is poured on a plate and incubated until solidified to create a base layer, followed by a top layer containing cells [2]. Applications: Ideal for studying tissue-like structure formation, invasion, and metastasis. Technical Considerations: Matrigel contains endogenous bioactive ingredients that may influence structure formation; recovery of cells for analysis can be challenging [2].
Scaffold-Based Cultures
Protocol: Cells migrate among and attach to biodegradable scaffolds made of materials such as silk, collagen, laminin, or alginate, filling the inter-fiber spaces [2]. Applications: Excellent for tissue engineering applications; compatible with standard molecular biology kits for DNA/RNA and protein isolation. Technical Considerations: Scaffold topography and material composition can significantly influence cell behavior and experimental outcomes [2].
Protocol for Comparative Proliferation Analysis in 2D vs. 3D Systems
Cell Line: PEO4 (high-grade serous ovarian cancer) [8] 2D Proliferation Assessment:
- Seed 10,000 cells/well in 96-well plates
- After 24 hours, administer treatment (e.g., cisplatin: 50-0.4 μM; paclitaxel: 50-0.4 nM)
- Incubate for 72 hours
- Add MTT solution (2 mg/ml) and incubate for 3 hours
- Solubilize formazan crystals in DMSO
- Measure absorbance at 570 nm [8]
3D Proliferation Assessment:
- Print 3,000 PEO4 cells/well as "Imaging model" using PEG-based hydrogels with RGD functionalization
- Allow 7 days for spheroid establishment
- Administer treatments identical to 2D system
- After 72 hours, measure viability using CellTiter-Glo 3D assay [8]
Data Normalization: Normalize all data to untreated controls; correct for background signal from matrix devoid of cells [8].
Visualization of Dimensionality Effects on Cellular Processes
Experimental Workflow for 2D-3D Comparative Studies
Experimental Workflow for Dimensional Comparison
Metabolic Pathways Sensitive to Dimensional Context
Metabolic Pathways Altered by Dimensionality
Essential Research Reagent Solutions
Table 3: Key Reagents for 2D and 3D Cell Culture Research
| Reagent/Category | Specific Examples | Function/Application | Dimensional Context |
|---|---|---|---|
| Extracellular Matrix | Matrigel, collagen I, agarose [2] | Provides 3D scaffolding for cell growth and organization | Essential for 3D culture; not used in 2D |
| Specialized Plates | Ultra-low attachment plates [3] | Prevents cell adhesion; promotes spheroid formation | Critical for scaffold-free 3D cultures |
| Bio-printing Systems | Rastrum 3D bioprinter [8] | Enables precise 3D structure fabrication | Advanced 3D model creation |
| Hydrogel Systems | PEG-based hydrogels with RGD [8] | Synthetic 3D microenvironment with controlled properties | Tunable 3D culture platforms |
| Viability Assays | CellTiter-Glo 3D [8], MTT [8] | Quantifies cell viability and proliferation | Assay optimization required for 3D penetration |
| Molecular Analysis Kits | RNA/DNA isolation kits compatible with 3D [2] | Nucleic acid extraction from complex 3D structures | Must accommodate ECM components |
The evidence presented demonstrates that dimensional context exerts profound influences on gene expression, metabolic pathway regulation, and ultimately cellular identity. The comparative data reveals that 3D culture systems provide superior pathophysiological relevance for studying metabolic processes, drug responses, and disease mechanisms, while 2D systems retain value for high-throughput screening and basic mechanistic studies [3].
The emergence of standardized protocols and specialized reagents for 3D culture has addressed earlier technical barriers, making these systems increasingly accessible for routine research [2]. The research community is moving toward integrated model systems that strategically employ both 2D and 3D approaches at different stages of the research pipeline [3]. This hybrid approach leverages the strengths of each system while acknowledging their limitations, ultimately accelerating the translation of basic research findings to clinical applications.
For researchers investigating metabolic pathways and cell identity, the selection of an appropriate dimensional context should be guided by the specific research question, with 3D models providing essential physiological relevance for studies requiring accurate tissue modeling, drug penetration assessment, and metabolic pathway analysis [3] [8].
The transition from traditional two-dimensional (2D) to three-dimensional (3D) cell culture represents a paradigm shift in biomedical research. This guide objectively compares the transcriptomic landscapes of cells cultured in these systems, synthesizing current experimental data to demonstrate that 3D cultures consistently restore gene expression profiles that more closely mimic in vivo conditions. We present quantitative evidence from multiple cancer types and stem cells, highlighting significant differences in pathway activation, drug response, and morphological characteristics. The compiled data underscore the superior physiological relevance of 3D models, providing researchers with a critical resource for selecting appropriate culture systems based on empirical molecular evidence.
For decades, two-dimensional (2D) cell culture has been a cornerstone of biological research, yet it presents significant limitations in mimicking the in vivo microenvironment. Cells cultured in 2D monolayers lack three-dimensional architecture, resulting in altered cell-cell and cell-extracellular matrix (ECM) interactions that fundamentally change their biological behavior [2]. These limitations manifest molecularly as distorted gene expression patterns, aberrant splicing events, and altered topology that diverge substantially from native tissue states [2]. Consequently, data generated from 2D models often poorly predict human physiological responses, contributing to high failure rates in drug development where approximately 90% of discovered drugs that reach clinical trials fail to obtain FDA approval [1].
Three-dimensional (3D) culture systems have emerged as a transformative approach that bridges the gap between conventional 2D cultures and in vivo models. By restoring spatial organization, gradient dynamics, and mechanical cues, 3D cultures re-establish tissue-relevant transcriptional programs that more accurately reflect human biology [12]. This guide provides a comprehensive comparison of 2D versus 3D culture systems through detailed experimental data and transcriptomic evidence, offering researchers a scientific foundation for model system selection.
Results: Comparative Transcriptomic and Functional Analyses
Multi-Cancer Transcriptomic Profiling Reveals Widespread Differences
Multiple studies across different cancer types have consistently demonstrated substantial transcriptomic differences between 2D and 3D culture systems through RNA sequencing analyses.
Table 1: Transcriptomic Differences Between 2D and 3D Cultures Across Cancer Types
| Cancer Type | Key Upregulated Pathways in 3D | Key Downregulated Pathways in 3D | Significant DEGs | Reference |
|---|---|---|---|---|
| Colorectal Cancer | Tumorgenicity-related genes, ECM organization | Cell cycle progression | Thousands of genes (up/down-regulated) | [1] |
| Cervical Cancer (SiHa cells) | Immune activation, inflammation, angiogenesis, tissue remodeling | Tissue development, cell differentiation | 79 significant DEGs independent of HPV effects | [13] [14] |
| Mesenchymal Stem Cells | Glycolysis, nutrient metabolism | Ribosome biogenesis, cell cycle progression | Distinct metabolic and transcriptional profiles | [15] |
In colorectal cancer research, a comprehensive comparative study found "significant (p-adj < 0.05) dissimilarity in gene expression profile between 2D and 3D cultures involving thousands of genes (up/down-regulated) of multiple pathways for each cell line" [1]. The study further demonstrated that compared to 2D cultures, cells in 3D formats displayed significant differences in the pattern of cell proliferation over time, cell death phase profile, and responsiveness to chemotherapeutic agents including 5-fluorouracil, cisplatin, and doxorubicin [1].
In cervical cancer models, transcriptomic analysis of SiHa cells revealed upregulation of genes associated with immune activation, inflammation, angiogenesis, and tissue remodeling in 3D cultures compared to their 2D counterparts [13]. Notably, HPV16 viral gene expression (E1, E2, E6, and E7) was significantly higher in 3D cultures, more closely mimicking the in vivo viral activity observed in actual tumors [14].
Drug Response and Resistance Profiles
The physiological differences between 2D and 3D cultures significantly impact drug response profiles, with 3D systems demonstrating enhanced predictive value for clinical outcomes.
Table 2: Comparative Drug Response in 2D vs. 3D Culture Systems
| Parameter | 2D Culture | 3D Culture | Physiological Relevance | |
|---|---|---|---|---|
| Drug sensitivity | Enhanced sensitivity to chemotherapeutics | Increased resistance mimicking in vivo tumors | 3D models more accurately predict clinical drug resistance | [1] [12] |
| Diffusion gradients | Uniform drug distribution | Heterogeneous distribution creating nutrient and oxygen gradients | Recapitulates avascular tumor nodules | [13] [12] |
| Proliferation status | Predominantly uniform proliferation | Mixed proliferating and quiescent cell populations | Mimics tumor heterogeneity | [1] [16] |
| Metabolic activity | Homogeneous metabolic profile | Distinct metabolic adaptations including increased glycolysis | Better reflects tumor metabolism | [15] |
3D cultures accommodate "surface-lying and deeply buried cells, proliferating and non-proliferating regions, oxygen-deprived hypoxic cells, and a well-oxygenated outer layer of cells" [1]. This architectural complexity creates diffusion barriers that lead to spatial heterogeneity in nutrient and oxygen levels, regions of quiescence and hypoxia, and metabolic heterogeneity - all of which better recapitulate the tumor microenvironment (TME) of solid tumors compared to conventional 2D monolayer cultures [13]. These attributes confer enhanced resistance to many anti-cancer drugs compared to 2D monolayer cultures, thus allowing for more clinically predictive studies of drug response [13].
Epigenetic and Chromosomal Architecture Differences
Beyond transcriptomic changes, 3D cultures also better replicate in vivo epigenetic patterns and higher-order genomic structures. In colorectal cancer models, researchers found that "epigenetically, 3D cultures and FFPE [Formalin-Fixed Paraffin-Embedded patient samples] shared the same methylation pattern and microRNA expression, while 2D cells showed elevation in methylation rate and altered microRNA expression" [1].
A study investigating the effects of spatial constraints on chromosome conformation in mouse hepatocytes revealed "significant differences in higher-order genomic interactions, notably in compartment identity and strength as well as in topologically associating domain (TAD)–TAD interactions" between 2D and 3D cultures [17]. These structural genomic differences were associated with up-regulated expression of genes involved in physiological hepatocyte functions in the 3D-cultured cells, suggesting that differences in genomic structure are critically important for transcriptional regulation [17].
Diagram 1: Fundamental architectural differences between 2D and 3D culture systems that drive transcriptomic variations.
Methods: Experimental Protocols for 2D/3D Comparative Studies
Establishing 3D Culture Models
The methodology for creating 3D cultures varies depending on the specific model system, but several well-established approaches are commonly used in comparative transcriptomic studies:
Spheroid Formation Using U-bottom Plates: For cervical cancer transcriptomic studies, researchers seeded "5,000 cells in each well of a 96-well Nunclon Sphera, U-bottom plate (ThermoFisher), then centrifuged at 70 × g for 5 min before placing in the incubator" [13]. Media replacement was performed every 2-3 days, with spheroid formation monitored for 7-9 days before analysis [13]. This method creates scaffold-free 3D structures through forced aggregation.
Hydrogel-Based 3D Cultures: For modeling tumor invasion, researchers culture "breast cancer cell-derived and patient-derived organoids in a 3D Matrigel/Hydrogel overlay system with calibrated elastic moduli ranging from 150-320Pa present in normal human breast tissues to 1100-5700Pa observed in some stiff breast tumors" [18]. This approach allows researchers to study how extracellular matrix stiffness controls tumor invasion.
Scaffold-Based Systems: Novel platforms like Bio-Blocks—a hydrogel-based culture system—are designed to "replicate in vivo-like environments while addressing the challenges of traditional culture systems" [19]. These systems feature unique micro-/macro-architecture that circumvents diffusional constraints and reduces cellular stress.
Transcriptomic Analysis Workflow
Diagram 2: Standard workflow for comparative transcriptomic analysis of 2D and 3D culture systems.
RNA Extraction and Quality Control: In comparative studies, total RNA is typically extracted using commercial kits such as the PureLink RNA Mini Kit (ThermoFisher) with on-column DNase treatment [13]. RNA purity and concentration are assessed using spectrophotometry (e.g., NanoDrop ND-1000), and quality verification is performed using methods such as the MycoStrip detection kit for mycoplasma contamination [13].
Library Preparation and Sequencing: For transcriptomic analysis, libraries are prepared from high-quality RNA and sequenced using platforms such as the Illumina NovaSeq 6000 with 150 bp paired-end reads [13]. This generates comprehensive data for subsequent bioinformatic analysis.
Bioinformatic Analysis Pipeline: A standard analytical workflow includes:
- Quality Control: Raw sequencing reads are evaluated using FastQC for adapter content, read length distribution, and per-base sequence quality scores [13].
- Alignment: Reads are aligned to appropriate reference genomes using aligners such as STAR v2.7.10b [13].
- Quantification: Transcript/gene-level expression abundance is quantified from aligned reads using tools like RSEM v1.3.3 [13].
- Differential Expression: Statistical analysis identifies differentially expressed genes (DEGs) with appropriate multiple testing corrections.
- Pathway Analysis: Enrichment analysis reveals biological pathways and processes differentially active between culture conditions.
The Scientist's Toolkit: Essential Research Reagents
Table 3: Essential Research Reagents for 2D/3D Comparative Transcriptomic Studies
| Reagent/Equipment | Function | Example Products | Application Notes |
|---|---|---|---|
| Ultra-Low Attachment Plates | Facilitate spheroid formation by preventing cell adhesion | Nunclon Sphera U-bottom 96-well plates | Enables scaffold-free 3D spheroid formation [1] [13] |
| Extracellular Matrix Substitutes | Provide biomimetic scaffold for 3D growth | Corning Matrigel matrix, hydrogels | Tunable mechanical properties to mimic different tissue types [18] [19] |
| RNA Extraction Kits | High-quality RNA isolation from 3D structures | PureLink RNA Mini Kit | Includes DNase treatment to remove genomic DNA contamination [13] |
| Cell Viability Assays | Assess metabolic activity in 3D structures | CellTiter 96 Aqueous Non-Radioactive Cell Proliferation Assay (MTS) | Adapted for 3D culture formats [1] |
| Apoptosis Detection Kits | Quantify cell death mechanisms | FITC Annexin V Apoptosis Detection Kit | Requires extraction of cells from 3D matrices [1] |
| Next-Generation Sequencers | Transcriptome profiling | Illumina NovaSeq 6000 | 150 bp paired-end reads recommended for comprehensive coverage [13] |
The comprehensive transcriptomic evidence presented in this guide demonstrates unequivocally that 3D cell culture systems restore in vivo-like expression profiles across multiple cell types and disease models. The data reveal substantial differences in pathway activation, chromosomal architecture, drug response, and cellular heterogeneity that favor 3D models as more physiologically relevant platforms for biomedical research. While 2D cultures remain valuable for specific applications, their documented transcriptomic limitations necessitate a strategic transition to 3D systems for studies requiring physiological predictive value. As the field advances, standardizing 3D culture protocols and analytical pipelines will be essential for maximizing the translational potential of these biologically superior models.
The Role of the Extracellular Matrix in Mechanotransduction and Genomic Regulation
The extracellular matrix (ECM) is far more than a passive structural scaffold for tissues; it is a dynamic, signaling-active entity that continuously provides cells with mechanical and biochemical cues. Through mechanotransduction—the process by which cells convert mechanical stimuli into biochemical signals—the ECM directly influences genomic regulation and cell fate decisions [20] [21]. This interplay is fundamental to physiological processes from embryonic development to tissue homeostasis, and its dysregulation is implicated in diseases ranging from fibrosis to cancer [22] [21]. The study of these mechanisms, however, is profoundly affected by the choice of experimental model. Traditional two-dimensional (2D) cell culture on rigid plastic surfaces presents an oversimplified mechanical environment that fails to recapitulate the complex three-dimensional (3D) context in which cells reside in vivo [20] [23]. This guide objectively compares 2D and 3D culture models, focusing on their performance in elucidating the role of the ECM in mechanotransduction and genomic regulation, to inform the experimental design of researchers and drug development professionals.
Fundamental Differences Between 2D and 3D Microenvironments
The microenvironment created by the culture system directly dictates the nature of cell-ECM interactions. The table below summarizes the core differences between these two models.
Table 1: Core Characteristics of 2D vs. 3D Cell Culture Models
| Feature | 2D Cell Culture | 3D Cell Culture |
|---|---|---|
| Growth Pattern | Single layer on a flat, rigid surface [3] | Multi-layered, expanding in all directions to form spheroids or organoids [3] |
| Cell-ECM Interaction | Primarily basal; unnatural, forced adhesion [23] | Natural, omnidirectional engagement with the ECM [20] [23] |
| Spatial Architecture | Lacks tissue-like organization [3] | Exhibits tissue-like structure with surface-lying and buried cells [1] |
| Mechanical Cues | Uniform stiffness (often very high); limited mechanical confinement [20] | Complex mechanics including stiffness, viscoelasticity, and confinement [20] |
| Microenvironment | Homogeneous distribution of oxygen, nutrients, and pH [3] | Creates natural gradients of oxygen (hypoxic cores), nutrients, and waste products [1] [3] |
The mechanical properties of the ECM—including its stiffness, viscoelasticity, and topography—are critical regulators of cell behavior. In a 3D context, the ECM exhibits complex mechanical properties such as non-linear elasticity (strain-stiffening) and stress relaxation, which are often absent or simplified in 2D models [20]. Furthermore, cells in 3D environments are mechanically confined by the surrounding matrix, which restricts changes in cell volume and shape, forcing cells to employ different strategies for migration and force generation compared to 2D [20]. This fundamental difference in mechanical engagement underlies the stark contrasts observed in cellular phenotypes and signaling outputs between the two models.
Impact on Cellular Phenotype and Experimental Outcomes
The choice of culture model has a profound impact on observable cellular behaviors, from basic morphology to responses relevant to drug discovery. The following table compares key phenotypic outcomes.
Table 2: Phenotypic and Functional Outcomes in 2D vs. 3D Cultures
| Outcome Measure | 2D Cell Culture Findings | 3D Cell Culture Findings |
|---|---|---|
| Cell Morphology | Artificial, flattened, and stretched morphology [7] [23] | In vivo-like morphology; formation of spheroids and organoids [7] [1] |
| Proliferation Rate | Typically high and uniform proliferation [1] | Heterogeneous proliferation; slower growth rates, mimicking in vivo tumors [1] |
| Gene Expression Profile | Does not closely match in vivo tumor profiles; altered epigenetic patterns [1] | Greater fidelity to in vivo tumors; more physiological expression and methylation patterns [1] |
| Drug Resistance | Often overestimates drug efficacy [7] [3] | Increased resistance to chemotherapeutics (e.g., 5-fluorouracil, cisplatin, doxorubicin) [7] [24] [1] |
| Apoptosis Profile | Higher baseline of apoptotic cells [1] | Lower levels of apoptosis, resembling in vivo tumors [1] |
These divergent outcomes highlight a critical limitation of 2D models: their poor predictive power for in vivo responses. For instance, cells in 3D cultures show increased resistance to chemotherapeutic agents like cisplatin and doxorubicin, a phenomenon attributed to factors like limited drug penetration, the presence of quiescent cells, and altered survival signaling [7] [24] [1]. This makes 3D models, such as multicellular tumor spheroids, indispensable for realistic pre-clinical drug screening.
Molecular Mechanisms of Mechanotransduction: A 3D Perspective
In 3D microenvironments, mechanotransduction occurs through distinct pathways that converge to regulate genomic output. The following diagram synthesizes the key mechanisms by which ECM-derived mechanical cues in a 3D setting influence nuclear activity and gene expression.
Diagram 1: 3D Mechanotransduction to Gene Expression
Key Molecular Players and Pathways
- Integrin-Mediated Sensing: In 3D, integrins such as α2β1 and α3β1 bind to ECM components like collagen I and fibrin, initiating the formation of focal adhesions [20]. The maturation of these adhesions is sensitive to 3D matrix stiffness and degradability, triggering intracellular signaling cascades involving kinases like Focal Adhesion Kinase (FAK) [20] [25].
- YAP/TAZ Translocation: The Hippo pathway effectors YAP and TAZ are central mechanotransducers. In stiff 2D environments or upon increased actomyosin contractility in 3D, they translocate to the nucleus and act as transcriptional co-regulators, driving the expression of proliferative and pro-fibrotic genes [25] [21]. Their regulation is a key point of divergence between 2D and 3D models.
- Ion Channel Activation: Mechanosensitive ion channels, such as Piezo1, are critical for sensing 3D confinement and hydrostatic pressure [20] [21]. Their activation leads to calcium influx, which in turn can modulate various signaling pathways, including those that regulate the actin-binding protein cofilin and the transcriptional regulator MRTF-A, impacting serum response factor (SRF)-mediated transcription [25].
- Nuclear Mechanotransduction: Forces are transmitted to the nucleus via the LINC complex, which connects the cytoskeleton to the nuclear lamina [25]. This can result in nuclear deformation, changes in chromatin architecture, and direct mechanical regulation of transcription, for instance through the action of nuclear actin and myosin [25].
Experimental Support: Comparative Data from Key Studies
Robust experimental evidence underscores the superior physiological relevance of 3D models. The following table quantifies performance differences between 2D and 3D cultures in published experiments.
Table 3: Experimental Data from Comparative 2D vs. 3D Studies
| Experimental Metric | Cell Line / Model | 2D Culture Results | 3D Culture Results | Citation |
|---|---|---|---|---|
| Drug Resistance (Cisplatin) | B16 F10 murine melanoma & 4T1 murine breast cancer | Higher sensitivity | Increased resistance observed across all 3D models | [7] [24] |
| Drug Resistance (5-Fluorouracil) | Colorectal cancer (CRC) cell lines (Caco-2, HCT-116, etc.) | Higher sensitivity | Increased resistance in 3D spheroid models | [1] |
| Gene Expression Fidelity | Colorectal cancer (CRC) cell lines vs. patient FFPE samples | Altered methylation & miRNA profiles; poor match to in vivo | Methylation & miRNA patterns more closely matched patient FFPE samples | [1] |
| Transcriptomic Profile | Colorectal cancer (CRC) cell lines (RNA-seq) | Significant dissimilarity to in vivo | Thousands of genes differentially expressed; profiles more physiological | [1] |
Detailed Experimental Protocol: Generating 3D Spheroids for Mechanotransduction Studies
The following is a standardized protocol for establishing 3D spheroid cultures, as utilized in the cited studies [7] [1]:
- Cell Seeding: Prepare a single-cell suspension. Seed an aliquot of 200 μL of cell suspension (at a density of 5 × 10³ cells) into individual wells of a Nunclon Sphera super-low attachment U-bottom 96-well microplate. This plate prevents cell adhesion to the plastic, forcing cells to aggregate and form spheroids.
- Spheroid Culture: Maintain the spheroids in a complete cell culture medium (e.g., DMEM supplemented with 10% FBS) under a standard humidified atmosphere of 5% CO₂ at 37°C.
- Medium Maintenance: Perform three consecutive 75% medium changes every 24 hours to ensure adequate nutrient supply and waste removal without disrupting the forming spheroids.
- Harvesting and Analysis: Spheroids are typically ready for experimentation after 72 hours of culture. They can be harvested for various downstream analyses, including:
- RNA Extraction for transcriptomic studies (e.g., RNA sequencing).
- Cell Viability and Apoptosis Assays using kits like FITC Annexin V.
- Immunofluorescence to visualize protein localization (e.g., YAP/TAZ nuclear/cytoplasmic ratio).
- Drug Treatment by adding chemotherapeutic agents directly to the culture medium.
The Scientist's Toolkit: Essential Reagents and Materials
Selecting the appropriate tools is critical for successfully modeling ECM-mediated mechanotransduction. The table below lists key solutions used in the featured experiments.
Table 4: Essential Research Reagent Solutions for 2D/3D Mechanotransduction Studies
| Item | Function / Application | Example Use Case |
|---|---|---|
| Nunclon Sphera U-bottom Plates | Scaffold-free 3D culture; promotes spheroid formation via ultra-low attachment surface | Generating uniform multicellular tumor spheroids (MCTS) for drug testing [1] |
| Reconstituted Basement Membrane (rBM) | Scaffold-based 3D culture; provides a biologically active, nanoporous ECM environment | Culturing epithelial cells to maintain polarized, organotypic structures [20] |
| Reconstituted Collagen-I Gels | Tunable 3D scaffold; allows control over stiffness and density to study matrix mechanics | Investigating fibroblast migration and cancer cell invasion in a defined 3D matrix [20] |
| CellTiter 96 AQueous Assay (MTS) | Colorimetric measurement of cell proliferation and metabolic activity | Quantifying cell growth and drug response in both 2D and 3D formats [1] |
| FITC Annexin V Apoptosis Kit | Flow cytometry-based detection of apoptotic and dead cell populations | Comparing apoptosis profiles between 2D monolayers and 3D spheroids [1] |
| Polyhydroxybutyrate (PHB) Scaffolds | Synthetic, reproducible scaffolds for 3D cell culture (e.g., electrospun membranes) | Providing a cost-effective and defined alternative to natural ECM scaffolds [7] |
The evidence demonstrates that 3D cell culture models provide a functionally superior system for studying the role of the ECM in mechanotransduction and genomic regulation. By more accurately replicating the mechanical constraints, architectural complexity, and biochemical gradients of native tissues, 3D models yield data on gene expression, drug resistance, and cellular phenotype that are more predictive of in vivo outcomes. While 2D cultures remain useful for high-throughput initial screening due to their simplicity and low cost, the future of mechanistic research and predictive drug development lies in the adoption of advanced 3D models. The field is moving towards integrated, multi-model workflows that combine the speed of 2D with the physiological depth of 3D systems and patient-derived organoids, all enhanced by AI-driven analysis of complex mechanobiological data [3]. For researchers aiming to translate in vitro findings into clinical success, embracing these sophisticated 3D microenvironments is no longer an option but a necessity.
From Theory to Bench: Implementing 3D Models for Gene Expression Studies
The transition from two-dimensional (2D) to three-dimensional (3D) cell culture represents a paradigm shift in biomedical research, particularly in studies investigating gene expression. Traditional 2D culture systems, where cells grow in a single layer on flat plastic surfaces, have been the standard for decades due to their simplicity, low cost, and protocol standardization [3]. However, these systems fail to accurately recapitulate the complex architecture and cellular interactions found in living tissues, leading to altered cell morphology, proliferation, and gene expression profiles that poorly translate to in vivo conditions [3] [16]. This limitation is especially critical in cancer research, where the tumor microenvironment significantly influences disease progression and treatment response.
Scaffold-based 3D culture techniques provide a solution by creating an artificial extracellular matrix (ECM) that allows cells to grow in all directions, mimicking their natural environment more closely [16]. These advanced systems facilitate proper cell-cell and cell-ECM interactions, generate natural gradients of oxygen, nutrients, and pH, and ultimately yield more physiologically relevant gene expression data [3] [26]. Among the various scaffold options available, hydrogels, Matrigel, and synthetic polymers have emerged as leading platforms, each offering distinct advantages and limitations for specific research applications. The growing importance of these technologies is reflected in the scientific literature, with publications on 3D cell cultures showing a marked increase over recent years [16].
This guide objectively compares the performance of these scaffold-based techniques within the context of gene expression studies, providing researchers with experimental data and methodologies to inform their model selection for more predictive and translationally relevant outcomes.
Technical Comparison of Scaffold-Based Techniques
Composition and Properties
Hydrogels: Three-dimensional (3D) polymer networks formed by chemical or physical crosslinking of polymers rich in hydrophilic groups, capable of absorbing large quantities of water while maintaining structural integrity [27] [28]. They can be derived from natural sources (e.g., collagen, chitosan, alginate, hyaluronic acid) or synthetic polymers (e.g., polyethylene glycol (PEG), polylactic acid (PLA), poly(vinyl acetate) (PVA)), or created as hybrid systems combining both approaches [27] [16]. Their key characteristics include high water content, tunable mechanical properties, and excellent biocompatibility, closely mimicking the native ECM [28].
Matrigel: A commercially available basement membrane matrix extracted from the Engelbreth-Holm-Swarm (EHS) mouse sarcoma tumor, composed of laminin, collagen IV, entactin, and various growth factors [16]. This complex, biologically active composition provides an environment that supports cell differentiation and tissue-specific organization, making it particularly valuable for organoid culture and angiogenesis studies.
Synthetic Polymers: Artificially engineered materials (including PEG, PLA, poly(lactic-co-glycolic) acid (PLGA), and PNIPAAm) that offer precise control over physical and chemical properties such as stiffness, degradation rate, and porosity [27] [16]. These scaffolds are characterized by their high reproducibility, mechanical strength, and customizable functionality, though they may lack inherent bioactivity without additional modification [27].
Comparative Performance in Gene Expression Studies
Table 1: Comparative analysis of scaffold-based 3D culture techniques
| Feature | Hydrogels | Matrigel | Synthetic Polymers |
|---|---|---|---|
| Biocompatibility | High [28] | High [16] | Variable (can be optimized) [27] |
| Biodegradability | Tunable [27] | High (enzyme-dependent) [16] | Controllable [27] |
| Mechanical Properties | Adjustable (soft to stiff) [27] | Limited adjustability (soft) [16] | Highly tunable [27] [16] |
| Bioactive Signals | Present in natural variants [27] | Rich and complex [16] | Limited (requires functionalization) [27] |
| Reproducibility | Moderate to high [27] | Low (batch variability) [28] | High [27] |
| Cost | Moderate [27] | High [16] | Low to moderate [27] |
| Key Advantages | Mimic native ECM; Tunable properties [27] [28] | Biologically active; Supports complex morphogenesis [16] | Highly reproducible; Customizable architecture [27] [16] |
| Key Limitations | Potential batch variability (natural); Complexity in synthesis [27] | Tumor-derived; Variable composition; Limited stiffness control [16] | May lack bioactivity; Potential cytotoxicity concerns [27] |
Table 2: Impact on gene expression profiles in 3D vs 2D culture systems
| Gene Category | 2D Culture Expression | 3D Culture Expression | Functional Significance |
|---|---|---|---|
| Stemness Markers (CD133, Nestin, Oct4, Sox2, Nanog) | Lower [26] | Upregulated [26] | Enhanced stem-like properties |
| Cell Cycle Regulators (CCNA, CCNB, CCND, CCNE) | Variable [26] | Upregulated [26] | Altered proliferation patterns |
| Apoptosis-related (p21, p27) | Higher [26] | Downregulated [26] | Enhanced survival signaling |
| EMT Markers | Lower [26] | Upregulated [26] | Increased invasive potential |
| Cytokine Secretion (IL-6) | Lower [29] | Significantly higher [29] | Enhanced pro-tumorigenic signaling |
Experimental evidence demonstrates that 3D scaffold environments significantly alter gene expression patterns compared to traditional 2D cultures. A comprehensive study investigating glioma cells (U87, U251, and HS683) cultured in 3D collagen scaffolds revealed upregulation of genes associated with stemness (CD133, Nestin, Oct4, Sox2, Nanog), cell cycle progression (CCNA, CCNB, CCND, CCNE), epithelial-mesenchymal transition (EMT), migration, and invasion compared to 2D cultured cells [26]. These expression changes corresponded with enhanced functional malignancy, suggesting that 3D environments better recapitulate the aggressive phenotype of in vivo tumors.
Similarly, research using patient-derived scaffolds (PDS) from breast tumor tissue demonstrated that breast cancer cells (MCF-7) cultured on tumor PDS showed significant overexpression of invasiveness hub genes (CAV1, CXCR4, CNN3, MYB, and TGFB1) and secreted higher levels of IL-6 (122.91 vs. 30.23 pg/10⁶ cells) compared to those cultured on normal PDS [29]. These findings underscore how tumor-specific ECM components drive more aggressive gene expression profiles, highlighting the critical importance of scaffold composition in disease modeling.
Experimental Protocols for Gene Expression Analysis
3D Culture in Collagen Scaffolds
Scaffold Preparation:
- Prepare collagen scaffolds using commercially available collagen solutions (e.g., rat tail collagen type I) according to manufacturer specifications [26].
- Adjust collagen concentration to achieve desired mechanical stiffness (typically 2-5 mg/mL).
- For pore size control, subdivide scaffolds into different categories (e.g., Scaffold A: 30-50 µm; Scaffold B: 70-100 µm) [26].
- Sterilize scaffolds using ethylene oxide gas or UV irradiation.
- Equilibrate scaffolds in cell culture medium for 24 hours at 37°C before cell seeding [26].
Cell Seeding and Culture:
- Prepare single-cell suspensions at appropriate density (e.g., 1×10⁵ cells in 20 µL medium per scaffold) [26].
- Slowly pipette cell suspension onto pre-hydrated scaffolds.
- Maintain scaffolds at 37°C for 4 hours to allow cell attachment.
- Transfer each scaffold to a well of a 12-well cell culture plate containing 2 mL complete medium.
- Replace culture medium every 2 days [26].
Cell Harvesting for Gene Expression Analysis:
- Wash scaffolds with phosphate buffer solution (PBS) three times.
- Submerge in 0.25% trypsin at 37°C for 10 minutes, gently pipetting 2-3 times during digestion to dissociate cells [26].
- Terminate digestion with complete medium containing serum.
- Repeat digestion process once to maximize cell yield.
- Collect combined digested fluid and centrifuge at 300 × g for 5 minutes at room temperature.
- Proceed with RNA extraction from cell pellet using standard methods (e.g., TRIzol reagent) [26].
Patient-Derived Scaffold (PDS) Technique
Tissue Decellularization:
- Obtain patient tumor and normal tissue samples through surgical resection with appropriate ethical approvals [29].
- Process tissues using an SDS-based decellularization protocol to remove cellular components while preserving ECM structure and composition.
- Validate complete decellularization through H&E staining (absence of cell nuclei), DNA quantification (<50 ng/mg tissue), and ECM composition analysis (collagen, glycosaminoglycans) [29].
Scaffold Characterization:
- Assess ECM preservation through histological staining (trichrome, PAS, Sirius red, alcian blue) [29].
- Quantify key ECM components: collagen content via hydroxyproline assay, glycosaminoglycans (GAGs) via dimethylmethylene blue assay [29].
- Evaluate mechanical properties through tensile testing to determine Young's modulus [29].
- Analyze microstructure and porosity using scanning electron microscopy (SEM) [29].
3D Cell Culture on PDS:
- Seed MCF-7 breast cancer cells (or other relevant cell lines) onto characterized PDS.
- Culture for 7-15 days, assessing cell viability and proliferation at designated time points using MTT assay [29].
- Quantify cytokine secretion (e.g., IL-6) in culture media using ELISA [29].
- Harvest cells for gene expression analysis of invasiveness markers (CAV1, CXCR4, CNN3, MYB, TGFB1) using RT-qPCR [29].
Signaling Pathways in 3D Microenvironments
The altered gene expression observed in 3D scaffold cultures is regulated through multiple signaling pathways that respond to biomechanical and biochemical cues from the extracellular microenvironment. Research indicates that apoptotic pathways, along with the Wnt, Sonic Hedgehog, and Notch signaling pathways, may be involved in mediating these transcriptional changes [26]. The following diagram illustrates the key signaling pathways implicated in the response of cancer cells to 3D microenvironments:
Signaling Pathways in 3D Microenvironments
These pathway activations result from the unique biomechanical properties, architectural constraints, and biochemical signaling present in 3D scaffold environments compared to traditional 2D cultures. The increased stiffness of tumor-derived ECM has been shown to activate mechanosensitive signaling pathways that promote invasive gene expression [29]. Additionally, the spatial organization in 3D cultures creates nutrient and oxygen gradients that mimic the in vivo tumor microenvironment, further influencing transcriptional programs through hypoxia-inducible factors and metabolic stress pathways [3].
The Scientist's Toolkit: Essential Research Reagents
Table 3: Essential research reagents for scaffold-based 3D culture experiments
| Reagent/Category | Specific Examples | Function/Application |
|---|---|---|
| Natural Hydrogels | Collagen (Type I), Fibrinogen, Hyaluronic acid, Chitosan, Alginate, Gelatin [16] | Mimic native ECM composition; Support cell adhesion and proliferation |
| Synthetic Polymers | Polyethylene glycol (PEG), Polylactic acid (PLA), Poly(vinyl acetate) (PVA), PNIPAAm [27] [16] | Provide tunable mechanical properties; High reproducibility |
| Basement Membrane Matrix | Matrigel, Geltrex [16] | Organoid culture; Angiogenesis studies; Differentiation assays |
| Decellularized Scaffolds | Patient-derived scaffolds (PDS) [29] | Patient-specific ECM modeling; Tumor microenvironment studies |
| Crosslinking Agents | Genipin, Glutaraldehyde, EDAC, NHS [27] | Modify hydrogel mechanical properties; Control degradation rate |
| Characterization Kits | MTT assay, DNA quantification, Hydroxyproline assay, GAG assay [26] [29] | Assess cell viability; Validate decellularization; Quantify ECM components |
| Gene Expression Analysis | TRIzol reagent, RT-qPCR kits, Primers for stemness/EMT/invasion markers [26] [29] | Quantify transcriptional changes; Validate functional phenotypes |
This toolkit represents essential materials required for implementing scaffold-based 3D culture techniques and analyzing resulting gene expression changes. Selection of specific reagents should be guided by research objectives, with natural hydrogels preferred for physiological relevance, synthetic polymers for controlled reductionist studies, and patient-derived scaffolds for translational cancer research [27] [16] [29].
Scaffold-based 3D culture techniques represent a significant advancement over traditional 2D systems for gene expression research, particularly in cancer biology and drug development. The experimental evidence clearly demonstrates that hydrogels, Matrigel, and synthetic polymers each provide unique microenvironments that profoundly influence cellular transcription patterns, yielding data more reflective of in vivo conditions. While each scaffold type has distinct advantages and limitations, their collective value lies in enabling researchers to ask more physiologically relevant questions about cellular behavior, drug responses, and disease mechanisms.
The future of scaffold-based research points toward increasingly sophisticated systems, including patient-derived scaffolds that capture individual-specific microenvironments [29], hybrid hydrogels combining the benefits of natural and synthetic materials [27], and advanced fabrication techniques such as 4D bioprinting that introduce dynamic, time-responsive elements into scaffold design [28]. As these technologies continue to evolve, they will further bridge the gap between in vitro models and in vivo physiology, accelerating the development of more effective therapeutics and personalized medicine approaches.
Cell culture systems are indispensable tools in basic and clinical in vitro research. For decades, the classically preferred model has been the static dish culture system, which generates adherent two-dimensional (2D) cell monolayers [30]. However, these 2D systems do not reflect the in vivo reality, where cells grow within a complex three-dimensional (3D) microenvironment within a vascular network [30]. This limitation has significant consequences for research outcomes, particularly in gene expression studies and drug development.
The transition to 3D cell culture represents a paradigm shift toward more physiologically relevant models. Among 3D approaches, scaffold-free methods have emerged as powerful techniques that allow cells to self-assemble into structures that closely mimic natural tissues. Unlike scaffold-based systems that use external matrices, scaffold-free techniques rely on the innate ability of cells to organize themselves, promoting direct cell-cell interactions and forming complex architectures that recapitulate key aspects of in vivo conditions [31] [32]. This article provides a comprehensive comparison of the primary scaffold-free methods—spheroids, organoids, and hanging drop cultures—within the context of their impact on gene expression and cellular behavior compared to traditional 2D systems.
Fundamental Concepts and Definitions
Distinguishing Scaffold-Free 3D Models
Scaffold-free 3D culture systems are defined by their reliance on cellular self-organization without synthetic or natural supporting matrices. The nomenclature in this field is sometimes misunderstood, and clear distinctions exist between the main model types [31]:
- Spheroids: Simple, spherical clusters of cells that form through self-aggregation in a scaffold-free environment. They typically contain one or multiple cell types and model basic cellular processes but lack the organizational complexity of specific organs [31].
- Organoids: More complex structures with the ability to self-differentiate and exhibit organ-specific characteristics and functions. They demonstrate higher-level organization that more closely mimics human organs, making them ideal for investigating disease mechanisms and developing personalized medicine approaches [31].
- Hanging Drop Cultures: A specific technical approach for generating spheroids and organoids by suspending cells in inverted droplets of medium, using gravity and surface tension to promote aggregation without external scaffolds [32].
The Formation Process of Scaffold-Free Structures
The formation of scaffold-free structures follows a defined sequence of phases [31]:
- Aggregation: Dispersed cells initially form loose aggregates through transmembrane receptors (integrins) that facilitate cell-cell adhesion.
- Compaction: The aggregates become more densely packed, assuming a spherical shape through continued cellular reorganization.
- Growth: The compacted structures continue to develop, potentially forming internal organization, nutrient gradients, and complex cytoarchitecture that more closely mimics the in vivo microenvironment.
This self-organization process fundamentally alters the cellular microenvironment compared to 2D culture, leading to the development of chemical gradients and distinct structural zones within the 3D structures [31].
Methodological Comparison of Scaffold-Free Techniques
Technical Approaches and Protocols
Scaffold-free methods encompass several established techniques, each with specific protocols and applications:
Hanging Drop Method
- Protocol: Cells are suspended in small droplets (typically 10-30 µL) of culture medium on the underside of a culture dish lid. The lid is then inverted over a reservoir containing PBS or medium to maintain humidity. Gravity causes cells to settle at the liquid-air interface, promoting aggregation into spheroids within 24-72 hours [32] [33].
- Experimental Considerations: The hanging drop method is straightforward and requires no specialized equipment beyond standard tissue culture materials. However, droplet volume limits spheroid size, and the method can be labor-intensive for large-scale studies due to the need for manual handling of individual droplets [31].
Ultra-Low Attachment (ULA) Plates
- Protocol: Specialized plates with covalently bonded hydrogel coatings that prevent cell attachment. Cells are seeded into these plates, where the inability to adhere to the surface forces them to aggregate and form spheroids [34] [33].
- Experimental Considerations: ULA plates are compatible with high-throughput screening and automated liquid handling systems. They provide excellent reproducibility and minimize handling compared to hanging drop methods but involve higher consumable costs [34].
Magnetic Levitation and Nanoparticle Assembly
- Protocol: Cells are incubated with magnetic nanoparticles and then exposed to magnetic fields using specialized devices that draw cells together to form spheroids [35]. This method enables consistent incorporation of multiple cell types from the initial formation stages.
- Experimental Considerations: This approach provides excellent control over spheroid composition and size, with the magnetic field facilitating consistent structure formation. The need for nanoparticle labeling introduces an additional step and potential variable [35].
Comparative Analysis of Scaffold-Free Methods
Table 1: Comparison of Primary Scaffold-Free 3D Culture Techniques
| Method | Key Advantages | Key Limitations | Optimal Use Cases | Throughput Potential |
|---|---|---|---|---|
| Hanging Drop | Low cost; simple setup; no specialized equipment required; suitable for hypoxia gradient studies [31] [36] | Difficult handling and media exchange; limited droplet volume restricts spheroid size; labor-intensive for large-scale studies [34] [31] | Initial drug screening; fundamental research on cell-cell interactions; studies requiring precise control over initial cell numbers [36] | Low to medium [31] |
| ULA Plates | High reproducibility; compatible with high-throughput screening; minimal handling required; suitable for long-term culture [34] [37] | Higher consumable costs; limited ability to control initial spheroid size beyond seeding density; potential batch-to-batch variability in plates [34] | High-throughput drug screening; long-term toxicity studies; production of uniform spheroid populations [34] [37] | High [34] |
| Magnetic Levitation | Precise control over spheroid composition and size; enables consistent incorporation of multiple cell types; rapid assembly [35] | Requires nanoparticle labeling; specialized equipment needed; additional variable of nanoparticle effects to consider [35] | Complex co-culture models; immune-tumor interaction studies; applications requiring precise spatial control [35] | Medium to high [35] |
Gene Expression Differences: 2D vs. 3D Scaffold-Free Cultures
Transcriptomic Reprogramming in 3D Environments
The transition from 2D to 3D scaffold-free culture systems induces significant changes in gene expression patterns that underlie functional differences observed in 3D models. Research comparing human bone marrow stromal cells (hBMSCs) cultured in 3D scaffolds versus 2D films revealed that substrate structure alone had stronger effects on gene expression than substrate polymer composition [38]. Pathway analysis demonstrated that 3D cultures and osteogenic supplements regulated similar ontological pathways, with particularly strong enrichment for TGF-β and cell-adhesion/ECM-receptor pathways in 3D environments [38].
A recent study on mesenchymal stem cells (MSCs) cultured using the hanging drop method revealed extensive transcriptome reprogramming [32]. RNA-Seq analysis showed that 3D MSCs upregulated receptors and cytokine production while downregulating proteolysis-, cytoskeletal-, extracellular matrix-, and adhesion-related genes compared to their 2D counterparts [32]. This transcriptional reshaping enhanced the cells' response capabilities to incoming signals, fundamentally altering their functional profile.
Cancer-Relevant Gene Expression Alterations
In cancer research, 3D spheroid models demonstrate gene expression profiles that more closely match those of real tumors compared to 2D cultures [34]. Studies using HeLa cell spheroids have shown increased drug resistance associated with cytoskeletal reorganization and overexpression of specific genes (SLC2A1, ALDOC, and PFKFB4) [36]. These expression changes in 3D models reflect adaptations to the tumor microenvironment that cannot be replicated in 2D systems, including hypoxia response, metabolic reprogramming, and altered cell-cell communication pathways.
Side-by-side CRISPR knockout screens performed on tumor cells cultured as 3D spheroids versus 2D monolayers revealed that 3D spheroids identified more cancer-relevant hits from driver pathways known to be essential for tumor growth, including p53, TGF-β, and hypoxia signaling [35]. This demonstrates how gene essentiality itself differs between 2D and 3D contexts, with 3D models providing more clinically relevant insights.
Quantitative Gene Expression Data
Table 2: Gene Expression Differences Between 2D and 3D Scaffold-Free Cultures
| Gene Category/Pathway | Expression Change in 3D | Functional Implications | Experimental Model |
|---|---|---|---|
| Pluripotency Markers (Oct4, Sox2, Nanog) | Upregulated [32] | Enhanced stemness and regenerative capacity [32] | Mesenchymal stem cells (hMSCs) [32] |
| Cytoskeletal & ECM Genes | Downregulated [32] | Reduced cell stiffness; modified cell-matrix interactions [32] | Mesenchymal stem cells (hMSCs) [32] |
| Drug Resistance Genes (SLC2A1, ALDOC, PFKFB4) | Upregulated [36] | Increased chemoresistance; altered metabolic activity [36] | HeLa cell spheroids [36] |
| TGF-β Signaling Pathway | Enriched [38] | Enhanced differentiation potential; tissue development [38] | Human bone marrow stromal cells [38] |
| Cell-Adhesion/ECM-Receptor Pathways | Strongly enriched [38] | Modified cell-cell communication; tissue organization [38] | Human bone marrow stromal cells [38] |
| Chemokine Receptors (CXCR4) | Upregulated [32] | Enhanced homing capability; improved recruitment to target tissues [32] | Mesenchymal stem cells (hMSCs) [32] |
Experimental Workflows and Key Signaling Pathways
Workflow for Establishing Scaffold-Free Cultures
The following diagram illustrates the general experimental workflow for establishing and analyzing scaffold-free 3D cultures, integrating common steps across different methods:
Diagram 1: Experimental workflow for scaffold-free 3D culture establishment and analysis
Signaling Pathways Activated in 3D Microenvironments
The transition to 3D culture activates specific signaling pathways that drive the functional differences observed between 2D and 3D systems:
Diagram 2: Signaling pathways activated in 3D microenvironments
The Scientist's Toolkit: Essential Research Reagents
Table 3: Essential Reagents and Materials for Scaffold-Free 3D Culture
| Reagent/Material | Function | Application Examples | Key Considerations |
|---|---|---|---|
| Ultra-Low Attachment Plates | Prevents cell adhesion, forcing aggregation into spheroids [34] | High-throughput drug screening; long-term spheroid culture [34] [37] | Coating consistency affects reproducibility; well geometry influences spheroid formation [34] |
| Magnetic Nanoparticles | Labels cells for magnetic assembly of spheroids [35] | Complex co-culture models; consistent incorporation of multiple cell types [35] | Nanoparticle concentration optimization required; potential effects on cell physiology [35] |
| CellTiter-Glo 3D Assay | Measures ATP content as viability indicator in 3D structures [37] [35] | Drug efficacy studies; metabolic activity monitoring in spheroids [37] | Optimized for penetration into 3D structures; more accurate than standard viability assays [37] |
| Extracellular Matrix Proteins (Collagen I, Matrigel) | Optional supplementation to enhance spheroid compaction [34] | Modeling invasive phenotypes; enhancing structural integrity in loose aggregates [34] [33] | Concentration-dependent effects on morphology; Matrigel has batch-to-batch variability [34] |
| Live-Cell Imaging Systems (Incucyte) | Monitors spheroid growth and morphology in real-time [34] | Kinetic studies of spheroid development; migration and invasion assays [34] | Requires specialized equipment; enables longitudinal analysis without sample destruction [34] |
Applications in Drug Development and Disease Modeling
Enhanced Predictive Power in Drug Screening
Scaffold-free 3D models have demonstrated significant utility in drug development, particularly for assessing therapeutic efficacy and predicting clinical response. Studies have shown that cancer cells cultured as spheroids are significantly less susceptible to chemotherapy than those grown in 2D, mirroring the high degree of chemoresistance observed in vivo [34]. This enhanced biological relevance makes 3D models valuable for early identification of ineffective drug candidates, preventing their advancement to costly animal studies and clinical trials [34].
Notable applications include:
- Pancreatic Cancer Research: Simple and reproducible co-culture spheroid models have been developed for pancreatic ductal adenocarcinoma (PDAC), recapitulating key features difficult to study in traditional 2D culture, including hypoxia, fibrosis, and chemoresistance [34].
- Immunotherapy Testing: 3D tumor spheroid models have been developed with robust T cell infiltration, maintaining T cell function and tumor-killing activity. These models enable evaluation of immunotherapies, including checkpoint inhibitors and T cell-engaging bispecific antibodies [35].
- Nanocarrier Assessment: 3D spheroid models serve as valuable tools for studying the tissue penetration of nanocarrier-based drug delivery systems, providing more physiologically relevant data on distribution efficiency than 2D models [34].
Personalized Medicine Applications
Patient-derived spheroids and organoids are increasingly employed in clinical precision medicine, with several clinical trials demonstrating the successful use of biopsy-derived cells to generate spheroids for drug screening and selection of optimal patient-specific treatments [34]. Memorial Sloan Kettering Cancer Center, for example, has used patient-derived organoids to match therapies to drug-resistant pancreatic cancer patients [3]. This approach leverages the maintained gene expression profiles and drug sensitivities of primary tissues in 3D culture systems [36].
Scaffold-free 3D culture methods represent a significant advancement over traditional 2D systems, offering more physiologically relevant models for studying cellular behavior, gene expression, and therapeutic responses. The distinct transcriptomic profiles observed in 3D cultures—with upregulation of pluripotency markers, cytokine production, and drug resistance genes, alongside downregulation of cytoskeletal and ECM genes—highlight the profound influence of the microenvironment on cellular function.
As the field evolves, the integration of scaffold-free methods with emerging technologies like microfluidic systems, 3D bioprinting, and AI-driven analysis promises to further enhance the predictive power of these models. The future of cell culture lies not in choosing between 2D and 3D systems, but in developing integrated approaches that leverage the strengths of each platform throughout the research and development pipeline. For researchers studying gene expression, disease mechanisms, or therapeutic interventions, scaffold-free 3D methods provide an essential toolset for generating clinically relevant data that can bridge the gap between traditional in vitro models and in vivo physiology.
The transition from traditional two-dimensional (2D) to three-dimensional (3D) cell culture models represents a paradigm shift in biomedical research, particularly for gene expression studies and drug development. While 2D cultures—where cells grow in a single layer on flat surfaces—have been the standard workhorse for decades due to their simplicity, low cost, and ease of use, they suffer from significant limitations in mimicking in vivo conditions [3]. Cells in 2D cultures typically exhibit altered morphology, disturbed cell-cell and cell-extracellular matrix interactions, and unlimited access to nutrients and oxygen, all of which dramatically influence gene expression patterns and drug responses [2].
In contrast, 3D culture systems allow cells to grow in all directions, forming structures that better recapitulate the architectural and functional complexity of native tissues. These models self-assemble into spheroids and organoids, facilitating complex extracellular matrix interactions while creating natural gradients of oxygen, pH, and nutrients [3]. The profound differences between these culture systems necessitate carefully considered experimental design parameters—including cell seeding strategies, culture duration, and appropriate replication—to generate meaningful, reproducible data that reliably predicts in vivo behavior.
Quantitative Comparison of Key Experimental Parameters
Cell Seeding and Proliferation Dynamics
Table 1: Comparative Analysis of Cell Seeding and Proliferation in 2D vs 3D Cultures
| Parameter | 2D Culture | 3D Culture | Research Implications |
|---|---|---|---|
| Initial Seeding Density | ~5×10³ cells/well (96-well plate) [1] | ~5×10³ cells/well for spheroid formation [1] | Similar seeding cells; different spatial organization |
| Time to Culture Formation | Minutes to hours [2] | Several hours to days [2] | 3D requires longer pre-culture stabilization |
| Proliferation Rate | High, exponential growth [1] [6] | Reduced, more controlled [1] [6] | 3D better mimics in vivo growth constraints |
| Proliferation Assessment Method | MTS assay, direct counting [1] [6] | Metabolic activity (Alamar Blue), imaging [6] | Different methods needed for accurate assessment |
| Culture Duration | Typically 3-5 days to confluence [6] | Extended to 10+ days for maturation [6] | 3D studies require longer experimental timelines |
| Glucose Dependence | High; proliferation ceases without glucose [6] | Moderate; cells survive longer under glucose restriction [6] | 3D models show alternative metabolic pathway activation |
Gene Expression and Drug Response Profiles
Table 2: Gene Expression and Drug Response Differences Between 2D and 3D Cultures
| Characteristic | 2D Culture Findings | 3D Culture Findings | Biological Significance |
|---|---|---|---|
| Gene Expression Patterns | Altered expression profiles [1] [2] | In vivo-like expression; shares methylation patterns with patient tissues [1] | 3D provides more clinically relevant transcriptomic data |
| Drug Sensitivity | Increased sensitivity to chemotherapeutics [1] [39] | Enhanced resistance to 5-fluorouracil, cisplatin, doxorubicin [1] [39] | 3D models better replicate clinical drug resistance |
| Pathway Activation | Simplified signaling pathways [2] | Complex, multi-enhancer hubs, promoter-enhancer stripes [40] | 3D captures intricate gene regulation mechanisms |
| Stemness Markers | Reduced expression of stemness factors [6] | Upregulation of OCT4, SOX2, ALDH1 [6] | 3D maintains cancer stem cell populations |
| Methylation Patterns | Elevated methylation rates [1] | Similar to formalin-fixed paraffin-embedded patient samples [1] | 3D better preserves epigenetic landscape |
Experimental Protocols for Robust 2D vs 3D Comparisons
Protocol for 3D Spheroid Formation and Maintenance
Materials and Reagents:
- Nunclon Sphera super-low attachment U-bottom 96-well microplates
- Complete cell culture medium (DMEM with HEPES, 10% FBS, 1% glutamine-penicillin-streptomycin)
- Trypsin-EDTA (0.025%) for cell detachment
- CellTiter 96 Aqueous Non-Radioactive Cell Proliferation Assay Kit
Methodology:
- Cell Preparation: Harvest cells at 80-90% confluency using trypsin-EDTA solution [1].
- Seeding: Prepare cell suspension at 5×10³ cells/well in 200μL aliquots into U-bottom 96-well microplates [1].
- Culture Conditions: Maintain spheroids in complete medium at 37°C with 5% CO₂ and humidified atmosphere [1].
- Medium Changes: Perform three consecutive 75% medium changes every 24 hours [1].
- Culture Duration: Extend culture to 10+ days to allow proper spheroid maturation and development of internal gradients [6].
- Assessment: Monitor proliferation using metabolic assays (MTS/Alamar Blue) and morphological analysis [1] [6].
Protocol for Parallel 2D Culture Experiments
Materials and Reagents:
- Standard tissue culture-treated flasks or multi-well plates
- Identical complete cell culture medium as used for 3D cultures
- Trypsin-EDTA (0.025%)
- Cell proliferation assay reagents
Methodology:
- Cell Preparation: Harvest cells simultaneously with 3D culture preparation using identical passage numbers [1].
- Seeding: Plate cells at identical density (5×10³ cells/well) in standard tissue culture-treated plates [1].
- Culture Conditions: Maintain under identical temperature, CO₂, and humidity conditions as 3D cultures.
- Culture Duration: Culture for 3-5 days, monitoring until reaching confluence [6].
- Assessment: Evaluate proliferation at same time points as 3D cultures using identical assay methods for direct comparison.
Experimental Workflow for Comparative Studies
Comparative Experimental Workflow for 2D vs 3D Studies
Replication Strategies and Statistical Considerations
Designing Robust Replication Schemes
Adequate replication is fundamental for generating statistically powerful and reproducible data in comparative culture studies. The low success rate of clinical trials (approximately 10%) for compounds that showed promise in traditional 2D cultures underscores the critical importance of using physiologically relevant models with proper experimental design [1] [3].
Biological vs. Technical Replication:
- Biological Replicates: Independent cultures derived from separate cell aliquots or passages are essential for capturing inherent biological variability. A minimum of three biological replicates per condition is generally recommended, though 4-8 replicates significantly enhance data reliability [41].
- Technical Replicates: Multiple measurements from the same biological sample help assess experimental consistency but cannot substitute for biological replicates [41].
Power Analysis: For RNA-seq experiments, power analysis should be conducted prior to experimentation to determine the appropriate sample size. scPower and similar tools can optimize the design of multi-sample studies, ensuring sufficient statistical power while conserving resources [42].
Randomization and Batch Effect Control
Table 3: Essential Research Reagent Solutions for 2D/3D Comparative Studies
| Reagent/Consumable | Function | Application Notes |
|---|---|---|
| Nunclon Sphera U-bottom Plates | Enable 3D spheroid formation | Super-low attachment surface promotes self-assembly [1] |
| Matrigel or Collagen Hydrogels | Provide extracellular matrix support | Mimics in vivo ECM; composition affects cell behavior [2] |
| Polyhydroxybutyrate (PHB) Scaffolds | Synthetic 3D culture substrate | Offers reproducible, cost-effective alternative to natural matrices [7] |
| CellTiter 96 Aqueous Assay | Measure cell proliferation | Non-radioactive MTS-based method suitable for both 2D/3D [1] |
| FITC Annexin V Apoptosis Kit | Quantify cell death phases | Distinguishes early/late apoptosis and necrosis [1] |
| Alamar Blue Reagent | Assess metabolic activity | Particularly useful for 3D culture viability measurement [6] |
| RNA Stabilization Reagents | Preserve gene expression profiles | Critical for accurate transcriptomic comparisons [41] |
Replication Strategy and Experimental Design
Impact of Culture Dimensions on Gene Expression Regulation
The dimensionality of cell culture systems profoundly influences gene expression through multiple mechanisms. Recent advances in 3D genomics have revealed that gene regulation is influenced by intrinsic cellular programs and physical proximity to other cells, vasculature, and structural boundaries within tissues [43].
Spatial Organization of Gene Regulation: In 3D cultures, the genome is organized into specialized structures such as "promoter-enhancer stripes" (PESs), which connect a gene's promoter to multiple enhancers through cohesin-mediated loop extrusion [40]. This organization enables the formation of multi-enhancer hubs where multiple enhancers form spatial clusters in association with gene promoters, creating complex regulatory environments that are absent in 2D systems [40].
Transcriptomic Differences: RNA sequencing analyses reveal significant dissimilarity in gene expression profiles between 2D and 3D cultures, involving thousands of up/down-regulated genes across multiple pathways in various cell lines [1]. Genes involved in drug metabolism (CYP2D6, CYP2E1), cell-surface interactions (CD44), and stemness (OCT4, SOX2) are consistently altered in 3D environments across different cancer types [6]. These differences explain why 3D cultures more accurately predict drug responses and resistance mechanisms observed in clinical settings.
Designing robust experiments comparing 2D and 3D culture systems requires careful consideration of multiple inter-related parameters. Based on the current evidence, the following best practices are recommended:
Employ a Tiered Approach: Utilize 2D cultures for initial high-throughput screening followed by 3D validation for lead compounds, balancing efficiency with physiological relevance [3].
Standardize Culture Timelines: Allow sufficient time for 3D model maturation (10+ days) while recognizing that 2D systems typically reach analytical endpoints sooner (3-5 days) [6].
Implement Appropriate Replication: Include sufficient biological replicates (minimum n=3, ideally 4-8) to ensure statistical power while accounting for the increased variability often present in 3D culture systems [42] [41].
Validate Findings with Multiple Assays: Combine proliferation metrics, morphological analyses, and molecular profiling (transcriptomics, epigenetics) to comprehensively characterize model differences [1] [6].
Align Model Selection with Research Objectives: Choose 2D systems for high-throughput applications and 3D models when tissue architecture, drug penetration, hypoxia, or more complex gene expression patterns are relevant to the research question [3].
The strategic integration of both culture systems, with careful attention to seeding strategies, culture duration, and replication design, will generate the most reliable and translatable data for drug development and basic biological research.
In vitro drug screening serves as a cost-effective approach for selecting promising therapeutic compounds, yet the predictive power of these models hinges entirely on their ability to mimic human physiology [7]. Traditional two-dimensional (2D) cell culture, where cells grow in a single layer on flat plastic surfaces, has been a laboratory standard for decades due to its simplicity, low cost, and compatibility with high-throughput screening [3]. However, this methodology comes with significant limitations: it produces limited cell-cell interaction, no spatial organization, and poor mimicry of human tissue response, often leading to drug efficacy overestimation [3]. The critical failure of a promising cancer therapy in Phase I clinical trials, despite success in 2D cultures and animal testing, stands as a turning point that highlighted the inadequacy of flat biological models [3].
The central challenge in modern oncology lies in addressing tumor heterogeneity and drug resistance, which are primary causes of therapeutic failure [44]. Tumor heterogeneity exists both between different patients (intertumor heterogeneity) and within a single tumor (intratumor heterogeneity), creating cellular populations with diverse genetic mutations, transcriptional alterations, and phenotypic profiles [44]. This heterogeneity constantly reprograms the tumor microenvironment (TME), leading to complex cell-cell networks and diffusion dynamics that flat cultures cannot replicate [44] [6]. Consequently, there has been a paradigm shift toward three-dimensional (3D) cell culture systems that more accurately simulate the in vivo physiological environment, including its spatial architecture, cell-matrix interactions, and metabolic gradients [45].
This guide provides a comprehensive comparison between 2D and 3D cell culture models within the specific context of cancer research, focusing on their application in modeling tumor heterogeneity and drug resistance mechanisms. By synthesizing experimental data and technical protocols, we aim to equip researchers with the necessary information to select the most appropriate model system for their investigative needs.
Fundamental Differences Between 2D and 3D Culture Environments
The dimensionality of cell culture systems fundamentally influences cellular behavior and response, making model selection a critical determinant in experimental outcomes. The table below summarizes the core distinctions between these environments:
Table 1: Core Characteristics of 2D vs. 3D Cell Culture Systems
| Feature | 2D Cell Culture | 3D Cell Culture |
|---|---|---|
| Growth Pattern | Monolayer; expansion in X-Y dimensions only [3] | Multilayer; expansion in X, Y, and Z dimensions [3] |
| Spatial Organization | Flat, artificial organization forced by plastic surface [3] | Tissue-like organization with natural cell polarity and architecture [45] |
| Cell-Cell & Cell-ECM Interactions | Limited to edges; no complex ECM integration [3] | Dynamic, multi-factorial interactions in all directions; complex ECM integration [3] [45] |
| Tumor Microenvironment (TME) | Absent; uniform exposure to nutrients, oxygen, and drugs [6] | Recapitulated; creates nutrient, oxygen, and pH gradients [3] [45] |
| Physiological Relevance | Low; cells adapt to unnatural flat surface [46] | High; mimics in vivo tissue conditions and cellular responses [46] |
| Typical Applications | High-throughput screening, basic cytotoxicity assays, genetic manipulations [3] [47] | Disease modeling (e.g., cancer), toxicology, drug penetration studies, personalized therapy [3] [45] |
The transition from 2D to 3D culture represents a shift from "sketches" to "blueprints"—moving from quick, inexpensive, but simplified models to detailed, realistic, and predictive systems [3]. In a 3D context, cells sense a surrounding matrix that influences their signal transduction, ultimately affecting gene expression, differentiation, proliferation, and general cell function [46]. For instance, hepatocytes express markedly different cytochrome P450 (CYP) profiles in 2D versus 3D cultures, directly impacting drug metabolism studies [47]. The additional dimensionality also induces physical constraints on cells, affecting their morphology and response to stimuli, which is particularly crucial when modeling complex diseases like cancer [46].
Quantitative Comparison: Key Performance Data in Cancer Research
Empirical evidence consistently demonstrates that 3D culture models provide a more accurate representation of in vivo tumor behavior, especially concerning drug resistance and cellular heterogeneity. The following tables consolidate quantitative findings from comparative studies.
Table 2: Comparative Drug Response and Resistance in 2D vs. 3D Models
| Cancer Cell Line / Model | Therapeutic Agent | Response in 2D | Response in 3D | Implications |
|---|---|---|---|---|
| B16 F10 murine melanoma & 4T1 murine breast cancer [7] [24] | Dacarbazine, Cisplatin | Higher sensitivity | Increased resistance | 3D models show drug resistance patterns closer to in vivo tumors [7] [24] |
| General 3D Tumor Models [45] | Various Chemotherapies | Overestimation of efficacy | More accurate, often reduced efficacy | Better predicts clinical trial outcomes; explains high failure rate of compounds successful in 2D [45] |
| HCT116 colorectal cancer [6] | ATP synthase inhibition | Sensitive | Reduced sensitivity | Linked to metabolic differences in 2D vs. 3D cultures affecting therapeutic response [6] |
Table 3: Differences in Gene Expression, Morphology, and Metabolic Activity
| Parameter | Observations in 2D Culture | Observations in 3D Culture |
|---|---|---|
| Gene Expression | Standardized profiles; some genes not expressed [6] [46] | Differentiated profiles; enables expression of genes silent in 2D (e.g., ANXA1, CD44, OCT4, SOX2 in prostate cancer) [6] [46] |
| Morphology | Flat, stretched, unnatural shape [3] [7] | Aggregates into spheroids/organoids; morphology similar to in vivo tumors [7] [45] |
| Proliferation Rate | High, uniform proliferation [6] | Reduced, heterogeneous proliferation; includes quiescent cells [6] |
| Metabolic Profile | Uniform, high nutrient access [6] | Heterogeneous; elevated Warburg effect, higher per-cell glucose consumption, distinct metabolic zones [6] |
| Transcriptomic Profile | Divergent from in vivo tumors [7] | More similar to in vivo tumors and patient-derived samples [7] |
The data reveal a consistent theme: 3D models intrinsically replicate the drug resistance observed in human patients, a feature notoriously absent in 2D systems [7] [45] [24]. This is largely attributed to the recreated TME, which imposes physical barriers to drug penetration and fosters cellular heterogeneity, including subpopulations of quiescent cells that are often resistant to therapy [45] [6]. Furthermore, gene expression analysis confirms that 3D platforms exhibit transcriptomic signatures that bear greater similarity to in vivo tumors than their 2D counterparts, providing a more genetically relevant context for mechanistic studies [7].
Experimental Protocols for 3D Cancer Models
To implement 3D cultures effectively, researchers can select from several established protocols, each with specific advantages and limitations.
Scaffold-Based Techniques Using Hydrogels
Principle: Cells are inoculated or dispersed within a loose, porous scaffold structure that mimics the native extracellular matrix (ECM) [45].
- Detailed Protocol (Matrigel/ECM-based Hydrogels):
- Preparation: Thaw Matrigel or similar hydrogel (e.g., collagen, alginate-gelatin) on ice overnight to prevent premature polymerization.
- Cell Seeding: Mix a single-cell suspension with the liquid hydrogel on ice to achieve a homogeneous distribution. The cell density must be optimized for the specific cell type and application.
- Polymerization: Plate the cell-hydrogel mixture into a pre-warmed culture vessel or microfluidic chip.
- Incubation: Transfer the culture to a 37°C incubator for 20-45 minutes to initiate gelation, forming a stable 3D matrix.
- Maintenance: After polymerization, carefully overlay with appropriate culture medium. Refresh the medium regularly to maintain nutrient supply and waste removal [45] [48].
- Applications: Ideal for studying cell-ECM interactions, drug penetration, and for cultivating patient-derived organoids (PDOs) that require a complex biomimetic environment [45].
Scaffold-Free Techniques: The Hanging Drop Method
Principle: Surface tension is used to create suspended droplets of cell suspension, enabling cells to aggregate into spheroids driven by gravity and intercellular adhesion [45].
- Detailed Protocol:
- Droplet Creation: Prepare a concentrated cell suspension. Using a pipette, dispense small droplets (typically 20-50 µL) onto the underside of a Petri dish lid.
- Inversion: Carefully invert the lid and place it over the base of the dish, which contains phosphate-buffered saline (PBS) to maintain humidity and prevent droplet evaporation.
- Incubation and Aggregation: Culture the dish undisturbed in a 37°C incubator for 2-5 days. Cells will sediment to the bottom of the droplet and self-assemble into a single spheroid.
- Harvesting: To retrieve the spheroids, carefully place a pipette tip into the droplet and aspirate [45].
- Applications: A straightforward and low-cost method for generating uniform multicellular tumor spheroids (MCTS) for high-throughput drug screening [45]. It is less suitable for large-scale cultures due to handling challenges.
Advanced Integrated Systems: 3D Bioprinting in Tumor-on-Chip Devices
Principle: Extrusion-based bioprinting is used to precisely position cells and biomaterials (bioinks) in a layer-by-layer procedure within a microfluidic chip, creating controlled tumor architectures [48].
- Detailed Protocol:
- Bioink Preparation: Formulate a biocompatible ink, such as alginate-gelatin hydrogel, and mix it with a cell suspension to create the bioink.
- Printing: Load the bioink into a bioprinter cartridge. Use a multi-cartridge system for co-culture models. Precisely deposit the bioink according to a digital design, creating a 3D construct with controlled cellular heterogeneity (e.g., random mixtures or sequential layers of different cell types).
- Chip Integration: Transfer the bioprinted construct into a microfluidic chip.
- Perfusion and Gradients: Connect the chip to a perfusion system to deliver culture medium continuously. The microfluidic device can be designed to create precise chemical gradients (e.g., of growth factors or drugs) across the bioprinted tumor, enabling the study of migration and response in a dynamic TME [48].
- Applications: Excellent for modeling controlled tumor heterogeneity, studying cell migration toward chemoattractants (e.g., EGF), and investigating the impact of specific tumor architectures on drug response [48].
The Tumor Microenvironment and Heterogeneity: A Systems View
The following diagram illustrates how tumor heterogeneity, driven by genetic and epigenetic evolution, reshapes the Tumor Microenvironment (TME) to foster drug resistance. This complex, multi-faceted process underpins the superiority of 3D models in cancer research.
Diagram: Tumor Heterogeneity Drives Resistance via the TME. Genetic diversity and clonal evolution dynamically reprogram the Tumor Microenvironment (TME), creating a complex ecosystem that promotes mechanisms of drug resistance. This systems-level interaction is a core strength of 3D models. Adapted from [44].
Research Reagent Solutions: Essential Materials for 3D Culture
Establishing a robust 3D cancer model requires specific reagents and equipment. The following toolkit details essential solutions for the protocols described above.
Table 4: Essential Research Reagents and Materials for 3D Cancer Modeling
| Reagent / Material | Function & Application | Example Use Cases |
|---|---|---|
| Basement Membrane Matrix (e.g., Matrigel) | A commercially available gel derived from the Engelbreth-Holm-Swarm (EHS) tumor; provides a complex, biologically active scaffold rich in laminin, collagen IV, and growth factors [7] [45]. | Gold standard for cultivating patient-derived organoids (PDOs) and for scaffold-based 3D cultures that require a rich ECM environment [7] [45]. |
| Synthetic Hydrogels (e.g., PHB, Alginate-Gelatin) | Fully synthetic or semi-synthetic polymers (e.g., polyhydroxybutyrate-PHB, alginate-gelatin) that form a water-rich 3D network. Offer high reproducibility, tunable stiffness, and porosity [7] [48]. | Used as a cost-effective, defined alternative to animal-derived matrices in scaffold-based cultures and as bioinks for 3D bioprinting [7] [48]. |
| Ultra-Low Attachment (ULA) Plates | Culture plates with a covalently bonded hydrogel coating that inhibits cell attachment, forcing cells to aggregate and form spheroids in a scaffold-free manner [3]. | Simple and high-throughput generation of multicellular tumor spheroids (MCTS) for drug screening applications [3]. |
| Microfluidic Chip | A device containing micro-channels and chambers that allows for precise fluid control, enabling the creation of chemical gradients and application of shear stress to 3D cultures [6] [48]. | Forms the basis of "tumor-on-chip" models, used to study drug penetration, metastasis, and the dynamic response of bioprinted tumors to gradients [6] [48]. |
| Specialized Growth Media | Formulations often containing specific growth factors and inhibitors (e.g., R-spondin, Noggin) necessary for the long-term maintenance and growth of organoids and other complex 3D models [45]. | Crucial for establishing and expanding patient-derived organoid (PDO) biobanks for personalized therapy testing [45]. |
The choice between 2D and 3D cell culture is not binary but strategic, requiring alignment with the specific research question [3]. 2D models remain valuable for high-throughput screening of thousands of compounds, basic genetic manipulations, and studies requiring uniform conditions and fast data turnaround [3] [47]. Their simplicity and low cost make them ideal for initial discovery phases.
Conversely, 3D models are indispensable when biological depth and physiological accuracy are paramount. They are the preferred system for studying the intricacies of the tumor microenvironment, tissue-specific architecture, drug penetration and resistance, stem cell differentiation, and for personalized therapy testing using patient-derived organoids [3] [45]. While they demand greater technical expertise, specialized equipment, and incur higher costs, 3D cultures prevent costly late-stage drug failures by providing predictive data that more accurately translates to clinical outcomes [3] [45].
The future of preclinical cancer research lies in integrated, multi-model workflows. Advanced labs now employ a tiered approach: using 2D for high-volume screening, 3D for predictive validation, and organoids for personalization [3]. This synergistic strategy, increasingly enhanced by AI-driven analytics and regulatory acceptance of 3D data, promises to bridge the gap between flat biology and the complex reality of human cancer, ultimately accelerating the development of more effective therapies [3].
Navigating the Third Dimension: Overcoming Technical Hurdles in 3D Culture Analysis
Common Pitfalls in RNA Extraction and Quality Control from 3D Structures
The transition from traditional 2D cell culture to more physiologically relevant 3D models represents a paradigm shift in cancer research and drug development. While 3D cultures including spheroids and organoids better recapitulate the tumor microenvironment and clinical characteristics of cancer, they introduce significant technical challenges for molecular analyses. RNA extraction from these complex architectures presents unique pitfalls that can compromise data integrity and experimental reproducibility. This guide systematically compares RNA extraction methodologies for 3D structures, evaluates commercial kit performance across critical metrics, and provides optimized protocols to ensure high-quality RNA for downstream applications. As the field moves toward hybrid workflows combining 2D and 3D models, standardized approaches to nucleic acid isolation become increasingly crucial for generating biologically relevant gene expression data.
Three-dimensional cell culture models have emerged as indispensable tools for bridging the gap between conventional 2D cultures and in vivo studies. These models—primarily spheroids (spherical aggregates of one or more cell types) and organoids (complex, heterogeneous, 3D "organ-like" structures)—can accurately mimic intra-tumoral heterogeneity, tumor evolution, and treatment response [49]. The architectural complexity of 3D cultures directly influences cellular behavior, leading to distinct metabolic profiles and altered gene expression compared to 2D counterparts [6]. This enhanced biological relevance comes with technical challenges, particularly for RNA extraction, where the dense extracellular matrix (ECM) and cellular heterogeneity of 3D models can compromise RNA yield, quality, and subsequent analytical results.
The imperative for reliable RNA extraction from 3D structures is underscored by the growing "translation gap" in drug development. In oncology, only approximately 3% of drugs successfully progress from preclinical studies to market approval [49]. This high failure rate partially stems from inadequate models that do not accurately predict human responses. High-quality RNA extraction enables advanced 'omics techniques crucial for understanding the genetic and molecular underpinnings of clinically important tumor characteristics [49]. However, researchers face significant challenges including increased lysis difficulties, contamination from ECM components, and the need for high-throughput compatible methods [49].
Fundamental Challenges in RNA Extraction from 3D Models
Structural and Compositional Barriers
The very features that give 3D models their biological advantage also create substantial obstacles for RNA extraction:
- Enhanced Structural Integrity: The compact nature of spheroids and organoids, combined with abundant ECM components in hydrogels such as collagen, GAGs, and proteoglycans, physically impedes lysis efficiency. These ECM components tend to co-precipitate with RNA and can act as potent inhibitors of PCR [50] [51].
- Cellular Density and Heterogeneity: While cartilage tissue shares similar challenges with its low cellular density (1-5% of total mass) [50], 3D models can vary greatly in cellularity. This variability introduces significant challenges in standardizing input material across samples, potentially affecting RNA yield consistency.
Methodological Pitfalls in Sample Preparation
Without proper protocols, RNA quality and yield from 3D models can be severely compromised:
- Incomplete Lysis: Standard lysis protocols developed for 2D cultures often prove insufficient for 3D structures. Inefficient lysis leads to reduced RNA yields and under-representation of certain cell populations within heterogenous 3D models [49].
- Hydrogel Contamination: When using starPEG-heparin or similar hydrogels, contamination of RNA with hydrogel residues (polymers or glycosaminoglycan fragments) can impact template quality and quantity, limiting effective gene expression analyses [51].
- Improper Handling and Storage: RNA degradation begins immediately upon sample collection. For tissue with low cell density like cartilage (analogous to some 3D models), delays in processing or improper freezing can significantly compromise RNA integrity [50].
Table 1: Common Pitfalls and Their Impact on Downstream Applications
| Pitfall | Effect on RNA | Impact on Downstream Applications |
|---|---|---|
| Incomplete lysis | Low yield, population bias | Reduced statistical power in RNA-seq, inaccurate gene expression |
| Hydrogel/ECM contamination | Inhibited enzymatic reactions | PCR failure, reduced sequencing library complexity |
| RNA degradation | Fragmented RNA | 3' bias in RNA-seq, reduced detection of long transcripts |
| Inconsistent sampling | Variable yield/quality | Poor reproducibility, increased technical variability |
| Inadequate purification | Protein/salt carryover | Spectrophotometric inaccuracies, inhibited reverse transcription |
Comparative Analysis of RNA Extraction Methodologies
Commercial Kit Performance Evaluation
Recent systematic evaluations of high-throughput, magnetic bead-based RNA extraction kits provide valuable insights for 3D culture research. A comparative study of four commercial kits using the KingFisher Flex purification system revealed significant performance differences [52]:
Table 2: Performance Metrics of Commercial RNA Extraction Kits
| Kit Name | Average Yield (ng/μL) | Purity (A260/A280) | Extraction Efficiency (%) | Best Application Use Case |
|---|---|---|---|---|
| MagMAX mirVana Total RNA Isolation Kit | 30.9-96.3 | 1.95-2.10 | 84.3-93.9 | High-precision gene expression studies |
| Direct-zol-96 MagBead RNA Kit | 22.6-71.4 | 1.90-2.08 | 43.3-68.7 | Cost-effective screening studies |
| Maxwell HT SimplyRNA Kit | 30.4-78.4 | 1.92-2.09 | 54.4-80.5 | Balanced cost-performance applications |
| HighPrep Total RNA Plus Kit | 19.7-48.5 | 1.89-2.00 | 42.8-62.1 | Basic RNA extraction needs |
The MagMAX mirVana Total RNA Isolation Kit demonstrated superior performance across multiple metrics, achieving the highest extraction efficiency (84.3-93.9%) and excellent RNA purity (A260/A280 ratios of 1.95-2.10) across diverse tissue matrices [52]. This kit employs a guanidine thiocyanate-based lysis combined with magnetic bead purification, effectively handling the challenging composition of 3D models.
Specialized Protocols for Hydrogel-Embedded Cultures
For cells cultured in specialized hydrogels such as starPEG-heparin systems, specific methodological adaptations are essential:
- Centrifugation-Based Clarification: Research demonstrates that removal of hydrogel residue by centrifugation is essential for obtaining high-quality RNA. This step effectively separates RNA from contaminating polymer and glycosaminoglycan fragments that can co-precipitate with nucleic acids [51].
- Purification Assessment: Contrary to expectations, additional purification steps beyond basic centrifugation did not significantly improve RNA quality in hydrogel-based cultures, simplifying the overall workflow [51].
- Quality Validation: The extracted RNA should be validated for suitability in downstream applications through quantitative polymerase chain reaction (qPCR) of endogenous control genes to confirm integrity and lack of inhibition [51].
Optimized Experimental Protocols
Comprehensive Workflow for RNA Extraction from 3D Models
The following diagram illustrates a robust, optimized workflow for extracting high-quality RNA from 3D cell culture models, integrating best practices from recent studies:
Detailed Step-by-Step Protocol
Based on the optimized workflow, here is the comprehensive protocol for obtaining high-quality RNA from 3D cultures:
Sample Collection and Stabilization
- For fresh processing: Immediately proceed to lysis after collection, keeping samples on ice
- For batch processing: Snap-freeze in liquid nitrogen and store at -80°C until extraction
- Critical Consideration: Limit ex vivo time before freezing as extended delays significantly impact RNA integrity and mRNA expression levels [50]
Complete Dissociation and Lysis
- Transfer 3D structures to appropriate lysis buffer (e.g., guanidine thiocyanate-based)
- Mechanically disrupt using homogenization or vigorous pipetting
- Extend lysis incubation time (15-30 minutes) compared to 2D culture protocols
- Technical Tip: Visually inspect solution to ensure no visible tissue fragments remain
Hydrogel Debris Removal
- Centrifuge lysates at 12,000 × g for 5-10 minutes at 4°C
- Carefully transfer supernatant to new tube, avoiding pellet
- Validation Point: This centrifugation step is essential when working with hydrogel-embedded cultures to prevent polymer contamination [51]
RNA Binding and Purification
- Follow manufacturer's protocol for magnetic bead-based purification systems
- For manual methods: employ silica membrane columns with appropriate binding capacity
- Kit Selection: Consider high-performance options like MagMAX mirVana based on comparative data [52]
Stringent Washing
- Perform all wash steps rigorously without over-drying membranes
- Use ethanol-containing wash buffers as specified
- Quality Assurance: Ensure complete ethanol evaporation before elution
Elution and Quantification
- Elute in nuclease-free water or TE buffer (preheated to 55-60°C)
- Allow 1-2 minutes incubation before centrifugation for optimal yield
- Quantify using spectrophotometry (NanoDrop) and assess integrity (Bioanalyzer)
Quality Control and Analytical Considerations
Comprehensive Quality Assessment
Rigorous quality control is essential for ensuring RNA extracted from 3D models is suitable for downstream applications:
- Spectrophotometric Analysis: Assess purity using A260/A280 and A260/A230 ratios. Target values of 1.8-2.1 and >2.0 respectively indicate minimal protein and solvent contamination [52].
- RNA Integrity Evaluation: For RNA sequencing applications, use microfluidic electrophoresis (Bioanalyzer, TapeStation) to determine RNA Integrity Number (RIN). Prioritize samples with RIN >8 for optimal results.
- Extraction Efficiency Monitoring: Consider spiking samples with a known quantity of exogenous RNA (e.g., VetMAX Xeno IPC RNA) before extraction to calculate extraction efficiency and identify potential inhibition [52].
Impact on Downstream Applications
The RNA extraction method significantly influences molecular analysis results:
- RNA Sequencing: Extraction methodology affects the fraction of uniquely mapped reads, number of detectable genes, fraction of duplicated reads, and representation of complex features like the B-cell receptor repertoire [53].
- Gene Expression Analysis: Variability in RNA extraction efficiency across different sample types and matrices impacts the sensitivity and specificity of RT-qPCR and gene expression analysis [52].
- Comparative Studies: When comparing 2D versus 3D cultures, consistent RNA extraction methods are crucial for valid interpretation. Gene expression profiles are strongly influenced by culture dimensionality, with 3D cultures showing altered expression of genes involved in drug metabolism and cellular differentiation [6].
Essential Research Reagent Solutions
Table 3: Key Reagents and Kits for RNA Extraction from 3D Models
| Product Name | Type | Primary Application | Key Advantage |
|---|---|---|---|
| MagMAX mirVana Total RNA Isolation Kit | Magnetic bead-based | High-quality total RNA isolation | Superior extraction efficiency and purity across diverse matrices |
| TRIzol Reagent | Phenol-guanidine isothiocyanate | Difficult-to-lyse samples | Effective disruption of complex 3D structures, may require optimization |
| TaqMan Fast Advanced Cells-to-CT Kit | All-in-one | Direct analysis from cells | Minimizes processing steps, suitable for screening |
| Direct-zol-96 MagBead RNA Kit | Magnetic bead-based | High-throughput applications | Cost-effective for large-scale studies |
| KingFisher Flex System | Instrumentation | Automated purification | Reproducibility, reduced hands-on time |
The extraction of high-quality RNA from 3D cell culture models presents distinct challenges that, if unaddressed, can compromise downstream applications and experimental validity. The dense extracellular matrix, cellular heterogeneity, and structural complexity of 3D structures demand optimized methodologies beyond those sufficient for 2D cultures. Through systematic evaluation of extraction technologies, we've identified that magnetic bead-based systems, particularly the MagMAX mirVana Total RNA Isolation Kit, demonstrate superior performance in extraction efficiency and RNA purity. Critical procedural modifications—including extended lysis durations, centrifugation to remove hydrogel contaminants, and rigorous quality control—are essential for success. As research continues to shift toward more physiologically relevant 3D models, standardized, optimized RNA extraction protocols will be increasingly crucial for generating reliable, reproducible data that accurately reflects in vivo biology and enhances the translational potential of preclinical findings.
Optimizing Protocols for Imaging and Molecular Analysis in Thick Specimens
The shift from two-dimensional (2D) to three-dimensional (3D) cell culture models represents a paradigm change in biomedical research, offering more physiologically relevant systems that better mimic the in vivo microenvironment [3]. This transition, however, presents significant technical challenges for researchers, particularly in the realms of imaging and molecular analysis of these thick, complex specimens. Traditional protocols optimized for monolayer cultures often fail when applied to 3D structures such as spheroids, organoids, and tissue-engineered constructs, necessitating the development of specialized methodologies.
The fundamental limitation of 2D cultures lies in their inability to recapitulate the natural tissue architecture and cell-cell interactions found in living systems [2]. When cells are removed from their native 3D context and grown on flat, rigid surfaces, they undergo significant changes in morphology, polarity, gene expression, and drug sensitivity [54]. In contrast, 3D models self-assemble into structures that mimic natural tissues, creating physiological gradients of oxygen, nutrients, and signaling molecules that more accurately predict in vivo responses [3]. This article provides a comprehensive comparison of analytical performance between 2D and 3D systems and offers optimized protocols for overcoming the unique challenges posed by thick specimens in modern research.
Comparative Analysis: 2D versus 3D Culture Systems
Fundamental Differences with Analytical Implications
The transition from 2D to 3D culture systems introduces fundamental differences that directly impact analytical outcomes. Understanding these distinctions is crucial for selecting appropriate imaging and molecular analysis techniques.
Table 1: Fundamental Differences Between 2D and 3D Culture Systems with Analytical Implications
| Characteristic | 2D Culture Systems | 3D Culture Systems | Analytical Implications |
|---|---|---|---|
| Spatial Architecture | Monolayer, flat geometry | Multi-layered, tissue-like structure | Standard microscopy insufficient for 3D; requires optical sectioning techniques |
| Cell-Matrix Interactions | Limited to single plane | Complex, omnidirectional interactions | ECM composition affects permeability of probes and staining reagents |
| Molecular Gradients | Homogeneous nutrient and oxygen distribution | Physiological gradients of oxygen, nutrients, waste products | Regional variations in gene expression, proliferation, and cell viability |
| Proliferation Dynamics | Uniform, rapid proliferation | Heterogeneous: proliferating outer layer, quiescent/necrotic core | Analytical methods must account for zonal heterogeneity |
| Gene Expression Profiles | Often de-differentiated, unnatural expression patterns | In vivo-like expression, proper cell polarization | Molecular analysis reveals different transcriptional networks |
| Drug Penetration | Immediate, uniform access | Limited, time-dependent diffusion | Efficacy testing requires longer exposure times and 3D assessment |
Experimental Evidence: Performance Comparison
Recent comparative studies provide quantitative evidence of the differential performance between 2D and 3D culture systems across multiple analytical parameters.
Table 2: Experimental Comparison of 2D and 3D Cultures in Key Research Applications
| Experimental Parameter | 2D Culture Performance | 3D Culture Performance | Study Details |
|---|---|---|---|
| Drug Sensitivity (5-FU) | High sensitivity, IC50 reached quickly | Reduced sensitivity, higher IC50 values | CRC cell lines showed significant (p<0.01) differences in responsiveness [1] |
| Cell Proliferation Rate | Rapid, continuous proliferation | Significantly slower, contact-inhibited | Colorimetric MTS assays showed different proliferation patterns over time (p<0.01) [1] |
| Gene Expression Fidelity | 20-30% difference from in vivo profiles | <10% difference from in vivo profiles | RNA-seq revealed significant (p-adj<0.05) dissimilarity involving thousands of genes [1] |
| Apoptosis Profile | Homogeneous response | Heterogeneous, zone-dependent resistance | Flow cytometry showed different apoptotic/live status distributions [1] |
| Methylation Pattern | Elevated methylation rate, altered from in vivo | Similar to patient FFPE samples | 3D cultures and FFPE shared the same methylation pattern [1] |
Optimized Protocols for Thick Specimen Analysis
Imaging Techniques for 3D Specimens
The imaging of thick specimens requires specialized approaches that overcome the challenges of light scattering, penetration depth, and 3D reconstruction. The following protocols have been optimized for various 3D culture systems.
Raman Spectral Projection Tomography (RSPT)
RSPT has emerged as a powerful label-free technique for molecular imaging of thick specimens at the mesoscale. The protocol leverages the molecular specificity of Raman spectroscopy while enabling volumetric imaging.
Protocol Details:
- Instrument Configuration: Utilize a transmission Raman imaging geometry with a high-power (2.0 W) NIR 785 nm laser shaped into a line illumination pattern using a cylindrical lens [55]. The system should incorporate a telecentric detection design with long focal length, low NA imaging lenses to collect forward-scattered Raman photons while rejecting diffuse light.
- Data Acquisition: For each sample, collect projections across a full 360° rotation with z-axis translation to cover the entire specimen volume. Acquisition should include both fingerprint (600-1800 cm⁻¹) and high-wavenumber (2700-3600 cm⁻¹) spectral regions to maximize molecular information [55].
- Processing Pipeline: Implement specialized computational correction for CCD aberrations, followed by wavelength calibration, autofluorescence subtraction, and normalization. Employ multivariate regression against a library of purified reference components to quantify relative molecular abundances [55].
- 3D Reconstruction: Apply inverse Radon transform with back projection of regression component abundances for each slice, followed by volumetric rendering to visualize molecular gradients and extracellular matrix heterogeneities [55].
Pheno-Seq: Integrating Imaging and Transcriptomics
The pheno-seq methodology enables direct correlation of visual phenotypes with gene expression profiles in 3D culture systems, providing powerful insights into morphological heterogeneity.
Protocol Details:
- Sample Preparation: Isolate individual spheroids from Matrigel or other 3D matrices without perturbing phenotypic identity. For colorectal cancer models, use patient-derived cells cultured in Nunclon Sphera super-low attachment U-bottom 96-well plates to form spheroids [56].
- Data Acquisition: Utilize a nanowell-based system (e.g., modified iCELL8 platform) for high-throughput processing of spheroids up to 150 μm in size. Acquire high-resolution microscopy images followed by in-situ RNA sequencing within the same nanowells [56].
- Image Processing: Implement an automated pipeline to extract morphological features (e.g., circularity, volume, surface texture) that inform about epithelial integrity and invasive potential. Aberrant phenotypes typically show lower circularity values and express EMT markers like VIM, while round phenotypes maintain epithelial markers like KRT15 [56].
- Integrative Analysis: Correlate morphological features with transcriptomic clusters identified through t-SNE visualization of RNA-seq data. This enables direct association of visual phenotypes (e.g., invasive vs. non-invasive) with underlying gene expression programs [56].
Molecular Analysis in 3D Environments
Molecular analysis in thick specimens requires special considerations for reagent penetration, regional heterogeneity, and representation of all cellular populations.
RNA Extraction and Transcriptomic Analysis
Optimized Protocol:
- Effective Lysis: For 3D cultures, extend lysis times and utilize mechanical disruption (e.g., pipette trituration) in addition to chemical lysis buffers to ensure complete penetration throughout the spheroid/organoid.
- Regional Analysis: For large specimens (>500 μm), consider microdissection approaches to separate proliferating outer layers from quiescent/necrotic core regions to analyze zone-specific gene expression patterns.
- Validation: Always correlate molecular findings with spatial information through techniques like in situ hybridization or immunohistochemistry on sectioned specimens.
Experimental evidence demonstrates that 3D-cultured cells exhibit transcriptomes significantly closer to in vivo phenotypes compared to 2D cultures. A study comparing mouse hepatocytes grown in 2D and 3D cultures revealed substantial differences in higher-order genomic interactions, including compartment identity and strength, as well as TAD-TAD interactions [17]. Genes involved in physiological hepatocyte functions were up-regulated in 3D-cultured cells and associated with these structural genomic changes [17].
Drug Response Assessment
Optimized Protocol:
- Extended Exposure: For thick specimens, extend drug exposure times (typically 72-96 hours for 3D vs. 24-48 hours for 2D) to account for delayed penetration to inner regions [1].
- Viability Assessment: Utilize multiple complementary assays (MTS, ATP content, apoptosis markers) rather than relying on a single readout, as different regions may respond differently.
- Penetration Validation: Include fluorescent dye conjugates of compounds or use analytical methods to verify complete penetration throughout the specimen.
Comparative studies using colorectal cancer cell lines demonstrated significant (p<0.01) differences in responsiveness to 5-fluorouracil, cisplatin, and doxorubicin between 2D and 3D cultures [1]. The 3D models more accurately replicated the drug resistance patterns observed in patient tumors.
Advanced Imaging Technologies for Thick Specimens
Mesoscale Imaging Approaches
Imaging of thick specimens requires technologies that balance spatial resolution, penetration depth, and molecular specificity.
Table 3: Advanced Imaging Modalities for Thick Specimen Analysis
| Imaging Technology | Resolution Range | Penetration Depth | Key Advantages | Optimal Applications |
|---|---|---|---|---|
| RSPT | Optical sub-millimeter | ~1 cm semi-transparent tissues | Label-free molecular contrast, living tissue compatible | ECM heterogeneity, molecular gradients in engineered tissues [55] |
| Light Sheet Microscopy | Sub-micrometer to micrometer | 1-2 mm (cleared samples) | High speed, low phototoxicity, optical sectioning | Developmental biology, organoid dynamics, 3D culture monitoring |
| Multiphoton Microscopy | Sub-micrometer | 500 μm - 1 mm | Deep tissue imaging, inherent optical sectioning | Live tissue imaging, collagen visualization via SHG |
| Micro-CT | 1-50 μm | Several cm | High resolution for mineralized tissues, quantitative | Bone tissue engineering, scaffold architecture |
| OPT | 1-10 μm | 1-2 cm (cleared samples) | High throughput, whole-organ imaging | Embryonic development, tumor morphology |
Molecular Imaging Probes and Nanotechnology
The development of specialized molecular probes has significantly advanced imaging capabilities in thick specimens. Current research focuses on improving biocompatibility, stability, and targeting efficiency of these agents [57].
Research Reagent Solutions for Thick Specimen Imaging:
Table 4: Essential Reagents for Advanced Imaging of Thick Specimens
| Reagent Category | Specific Examples | Function | Application Notes |
|---|---|---|---|
| Scaffold Matrices | Matrigel, collagen, synthetic PEG hydrogels | Provide 3D structure for cell growth | Natural matrices better mimic ECM but show batch variability; synthetic offer reproducibility [58] |
| Molecular Probes | Antibodies, peptides, aptamers, small molecules | Target specific molecular markers | Smaller probes (peptides, aptamers) penetrate better; consider cleavable activation mechanisms [57] |
| Nanoparticles | Gold NPs, silica NPs, quantum dots | Enhance contrast, enable multimodal imaging | Surface modification crucial for stability and reduced nonspecific accumulation [57] |
| Clearing Reagents | Scale, CUBIC, CLARITY | Reduce light scattering in thick tissues | Enable deeper imaging but may affect molecular integrity |
| Viability Indicators | Calcein AM, propidium iodide, caspase sensors | Distinguish live/dead/apoptotic cells | Penetration time must be optimized for each specimen size |
| ECM Probes | Collagen hybridizing peptides, ECM antibodies | Visualize extracellular matrix organization | Essential for understanding tissue microstructure and cell-matrix interactions |
Implementation Framework and Technical Considerations
Integrated Workflow for Comprehensive Analysis
A robust analytical strategy for thick specimens requires the integration of multiple complementary techniques to overcome the limitations of any single approach.
Troubleshooting Common Challenges
- Incomplete Probe Penetration: Pre-treat with mild permeabilization agents; extend incubation times; use smaller probe formats (nanobodies, aptamers rather than full antibodies); verify distribution with sectioning.
- Regional Under-sampling: Implement zonal microdissection; use multiple sectioning planes for analysis; employ technologies that provide complete volumetric assessment rather than single-plane information.
- Artifactual Results: Always include appropriate 3D-specific controls; validate findings with multiple complementary techniques; compare multiple time points to distinguish biological phenomena from technical artifacts.
- Data Integration Challenges: Utilize computational approaches for spatial registration; develop customized analysis pipelines that account for 3D geometry; establish standardized metrics for quantitative comparison across specimens.
The optimization of protocols for imaging and molecular analysis in thick specimens is essential for leveraging the full potential of 3D culture systems in biomedical research. While these advanced models provide more physiologically relevant information than traditional 2D cultures, they demand specialized methodological approaches that account for their structural complexity, regional heterogeneity, and mass transport limitations. The techniques outlined in this guide—from Raman spectral projection tomography for label-free molecular imaging to pheno-seq for integrated morphological and transcriptomic analysis—provide researchers with a comprehensive toolkit for extracting meaningful data from these challenging but invaluable model systems.
As the field continues to evolve, the integration of artificial intelligence with multimodal imaging and molecular profiling promises to further enhance our ability to interpret complex biological patterns in thick specimens. Additionally, the ongoing development of more sophisticated molecular probes and clearing techniques will continue to push the boundaries of what can be visualized and analyzed in 3D contexts. By adopting these optimized protocols and maintaining flexibility to incorporate emerging technologies, researchers can maximize the return from their investments in 3D culture systems, ultimately accelerating the translation of basic research findings into clinical applications.
The transition from traditional two-dimensional (2D) cell cultures to three-dimensional (3D) spheroids represents a paradigm shift in preclinical research, offering a more physiologically relevant model that better mimics the in vivo tumor microenvironment [59]. However, this increased biological relevance comes with a significant analytical challenge: pronounced structural and cellular heterogeneity within spheroids that can critically impact experimental outcomes and translational potential [60] [59]. Unlike homogeneous monolayer cultures, spheroids develop complex architectural features including an outer layer of proliferating cells, an intermediate quiescent zone, and an inner core of necrotic cells under hypoxic and acidic conditions [59]. This spatial organization creates gradients of nutrients, oxygen, pH, and metabolic waste products that drive differential gene expression, varied proliferative states, and heterogeneous drug responses across the spheroid structure [59].
This heterogeneity presents a substantial methodological challenge for researchers seeking to obtain representative cellular samples that accurately reflect the complete spheroid population. Traditional sampling approaches developed for 2D cultures fail to account for this three-dimensional complexity, potentially leading to biased results and compromised data interpretation [60]. The emerging consensus suggests that overcoming this challenge requires sophisticated strategies specifically designed to characterize, account for, and leverage spheroid heterogeneity rather than attempting to eliminate it [60]. This guide comprehensively compares current methodologies for sampling representative cells from spheroids, providing experimental data and standardized protocols to support researchers in navigating this complex analytical landscape.
Table 1: Comparative Analysis of 2D vs. 3D Cell Culture Models
| Parameter | 2D Monolayer Cultures | 3D Spheroid Models |
|---|---|---|
| Spatial Architecture | Flat, uniform monolayer | Complex 3D structure with concentric zones [59] |
| Cell-Cell Interactions | Limited to peripheral contact | Extensive, mimicking natural tissue [59] |
| Microenvironment | Homogeneous nutrient/gas exchange | Gradients of oxygen, nutrients, pH [59] |
| Proliferation Patterns | Uniform throughout culture | Heterogeneous: proliferating outer layer, quiescent intermediate, necrotic core [59] |
| Gene Expression Profiles | Often artificial, de-differentiated | More physiologically relevant, resembling in vivo patterns [1] |
| Drug Penetration & Response | Uniform access, typically more sensitive | Limited penetration, resistance in inner layers, more predictive of in vivo response [59] [1] |
| Cellular Heterogeneity | Low, homogeneous population | High, multiple cell states within single spheroid [60] [59] |
Quantitative Characterization of Spheroid Heterogeneity
Biophysical Profiling with PCA-Based Analysis
Recent methodological advances have enabled more precise quantification of spheroid heterogeneity, providing researchers with tools to characterize samples before sampling. The PCA-coupled Biophysical Characterization (PCA-BC) method represents a significant innovation, integrating Principal Component Analysis and Hierarchical Cluster Analysis with simultaneous measurement of spheroid mass density, diameter, and weight [60]. This approach allows researchers to discriminate variability within and across spheroid populations, identifying distinct subpopulations that might be missed by traditional diameter measurements alone.
In practical application, PCA-BC analysis of spheroids derived from A549 and LoVo cell lines demonstrated clear separation based on biophysical characteristics, with automated clustering successfully discriminating between cell lines and even identifying operator-dependent variations in spheroid development [60]. The biophysical parameters obtained revealed significant differences, with A549 spheroids showing mass density of 1034 ± 7 fg/mm³ compared to 1014 ± 2 fg/mm³ for LoVo spheroids, while LoVo spheroids were substantially larger (473.0 ± 112.4 μm) compared to A549 spheroids (197.5 ± 34.3 μm) [60]. This method enables real-time analysis of heterogeneity, providing crucial data to inform sampling strategies and ensure representative cell collection.
Mathematical Modeling of Spheroid Growth and Heterogeneity
Mathematical modeling approaches offer complementary tools for understanding and predicting heterogeneity patterns within spheroid populations. Recent work has developed sophisticated partial differential equation (PDE) models that quantify inter-patient and intra-tumor heterogeneity by analyzing spheroid growth dynamics [61]. These models incorporate both migration and growth terms, accurately capturing the "Go-or-Grow" hypothesis observed in certain cell populations where proliferation and migration appear to be mutually exclusive behaviors [61].
The RD-ARD (Reaction-Diffusion-Advection-Reaction-Diffusion) model represents a particularly advanced framework, describing two distinct cellular subpopulations with different migratory and proliferative characteristics [61]. When applied to patient-derived glioblastoma spheroids, these models revealed significant heterogeneity between different patients, with model parameters correlating with patient age and survival outcomes [61]. This approach provides researchers with predictive tools to identify heterogeneity patterns before sampling, enabling more strategic and representative cell collection.
Heterogeneity Characterization Framework: This diagram illustrates the multi-faceted approach required to characterize spheroid heterogeneity, encompassing structural, biophysical, and mathematical modeling dimensions.
Comparative Analysis of Sampling Methodologies
Scaffold-Based vs. Scaffold-Free Spheroid Culture Systems
The foundation for representative sampling begins with spheroid culture methodology itself. Research demonstrates significant differences between scaffold-based and scaffold-free culture systems that influence resulting heterogeneity and sampling strategies. Scaffold-free systems utilizing ultra-low attachment plates, hanging drop techniques, or magnetic levitation promote self-assembly of spheroids through cell-cell interactions, typically generating more uniform spheroids suitable for high-throughput screening [59] [62]. In contrast, scaffold-based approaches employing natural hydrogels (Matrigel, collagen) or synthetic polymers provide extracellular matrix (ECM) interactions that more closely mimic the in vivo microenvironment but may introduce additional heterogeneity [59] [62].
Standardized comparisons of these methodologies reveal distinct applications: high-throughput scaffold-free systems (such as BioFloat and Elplasia 96-well platforms) generate highly uniform spheroids with consistent circularity ideal for reproducible sampling, while low-throughput six-well ultra-low attachment plates produce heterogeneous populations with distinct subpopulations (holospheres: 408.7 μm², merospheres: 99 μm², paraspheres: 14.1 μm²) that enable studies of stem cell diversity but require more sophisticated sampling approaches [62]. When spheroids from these heterogeneous populations are embedded in Matrigel scaffolds, merospheres and paraspheres demonstrate outward migration forming epithelial sheets, while holospheres remain intact as BMI-1+ stem cell reservoirs, suggesting different sampling strategies are needed for different spheroid subtypes [62].
Complete vs. Zonal Sampling Strategies
Researchers must choose between complete spheroid processing (which captures full heterogeneity but may mask important spatial relationships) and zonal sampling (which preserves spatial information but requires more sophisticated techniques). Complete spheroid dissociation is typically employed for genomic, transcriptomic, or proteomic analyses where population-level data is sufficient, utilizing enzymatic digestion (trypsin, collagenase) followed by mechanical disruption to create single-cell suspensions [1] [63]. The validity of this approach was demonstrated in a colorectal cancer study where spheroids were completely dissociated for transcriptomic analysis, revealing thousands of significantly differentially expressed genes between 2D and 3D cultures [1].
For investigations requiring preservation of spatial heterogeneity, zonal sampling strategies are essential. These approaches leverage the concentric organization of spheroids, often employing microdissection techniques, gradient-based separation, or fluorescent-activated cell sorting (FACS) of pre-stained spheroids to isolate cells from specific regions [59]. Experimental evidence confirms the biological significance of zonal sampling, with studies demonstrating distinct gene expression profiles between outer proliferating cells and inner hypoxic core cells [59]. For instance, research on lung cancer spheroids showed upregulation of genes associated with hypoxia signaling, epithelial-to-mesenchymal transition, and tumor microenvironment regulation specifically in inner regions [59].
Table 2: Sampling Methodology Comparison for Different Research Applications
| Research Application | Recommended Sampling Strategy | Technical Approach | Experimental Evidence |
|---|---|---|---|
| High-Throughput Drug Screening | Complete spheroid dissociation | Enzymatic digestion + mechanical disruption | 3D spheroids showed differential drug responsiveness compared to 2D cultures; complete dissociation enabled uniform plating for screening [1] [63] |
| Stem Cell & Heterogeneity Studies | Heterogeneous population sampling from low-throughput ULA plates | Manual selection of different spheroid subtypes (holospheres, merospheres, paraspheres) | Distinct subpopulations showed different stemness markers and regenerative potential [62] |
| Spatial Gene Expression Analysis | Zonal sampling or in situ analysis | Microdissection or regional staining followed by FACS | Transcriptomic analysis revealed significant spatial heterogeneity with differential expression of hypoxia, EMT, and stemness markers [59] [1] |
| Toxicological Assessment | Complete spheroid dissociation for uniform plating | ATP-based viability assays after complete dissociation | 3D spheroids showed different sensitivity patterns to mycotoxins compared to 2D cultures [63] |
| Biophysical Characterization | Non-destructive analysis of intact spheroids | PCA-BC method measuring mass density, size, weight | Enabled classification of heterogeneity without disrupting spheroid integrity [60] |
Standardized Protocols for Representative Sampling
Protocol 1: Complete Spheroid Dissociation for Bulk Analysis
This protocol is optimized for obtaining representative single-cell suspensions from entire spheroid populations while maintaining cell viability and molecular integrity:
- Spheroid Collection: Transfer spheroids from culture conditions to low-adhesion centrifuge tubes using wide-bore pipette tips to minimize mechanical damage [1] [63].
- Washing: Centrifuge at 300 × g for 5 minutes and wash with PBS to remove residual culture media and ECM components [1].
- Enzymatic Digestion: Incubate with appropriate dissociation reagent (trypsin-EDTA, Accutase, or collagenase IV) with concentration and duration optimized for specific spheroid type and size [1] [63]. For colorectal cancer spheroids, 0.05% trypsin-EDTA for 10-15 minutes at 37°C has been successfully employed [1].
- Mechanical Disruption: Gently triturate using P1000 pipette with wide-bore tips until single-cell suspension is achieved, visually confirming dissociation under microscope [63].
- Neutralization: Add complete culture media containing serum to neutralize enzymatic activity [1].
- Filtration: Pass cell suspension through 40μm cell strainer to remove residual aggregates [63].
- Viability Assessment: Determine cell count and viability using trypan blue exclusion or automated cell counters [1] [63].
Validation studies employing this approach have demonstrated successful application in transcriptomic analyses, with RNA sequencing confirming significant differences between 2D and 3D cultures while maintaining RNA integrity suitable for downstream analysis [1].
Protocol 2: Regional Sampling for Spatial Heterogeneity Analysis
This advanced protocol enables isolation of cells from specific spheroid regions to preserve spatial information:
- Vital Staining: Incubate intact spheroids with cell-permeable fluorescent dyes that differentially label regions based on metabolic activity (e.g., hypoxia probes, viability markers) [59].
- Embedding: Embed stained spheroids in low-melting-point agarose or optimal cutting temperature (OCT) compound to maintain structural integrity during sectioning [59].
- Sectioning: Use vibratome or cryostat to generate sections of appropriate thickness (200-500μm) for microdissection [59].
- Regional Microdissection: Employ laser capture microdissection or manual microdissection with fine needles to isolate specific regions (proliferating outer layer, quiescent middle layer, necrotic core) under fluorescence guidance [59].
- Regional Dissociation: Process each region separately using optimized enzymatic digestion as described in Protocol 1.
- Validation: Confirm regional identity through expression analysis of zone-specific markers (hypoxia-inducible factors for core regions, proliferation markers for outer layers) [59].
Research applying similar approaches has revealed significant spatial heterogeneity in protein expression, including elevated EGFR expression in outer regions of patient-derived head and neck squamous cell carcinoma spheroids and differential expression of EMT markers in gastric cancer microtumors [59].
Research Reagent Solutions for Spheroid Sampling
Table 3: Essential Research Reagents for Representative Spheroid Sampling
| Reagent Category | Specific Products | Function in Sampling Process | Application Notes |
|---|---|---|---|
| Dissociation Reagents | Trypsin-EDTA (0.05%), Accutase, Collagenase IV | Break down cell-cell junctions and ECM for single-cell suspension | Concentration and incubation time must be optimized for specific spheroid type and size [1] [63] |
| Viability Assays | CellTiter-Glo 3D, ATP-based assays, MTS assays | Assess cell viability and metabolic activity post-dissociation | 3D-optimized assays account for different metabolic states in spheroids [60] [63] |
| Extracellular Matrix | Matrigel, Collagen I, Synthetic hydrogels | Provide structural support for scaffold-based spheroid culture | Influences spheroid heterogeneity and required sampling approach [59] [62] |
| Fluorescent Probes | Hypoxia probes (e.g., pimonidazole), CellTracker dyes, viability stains | Enable visualization and separation of spheroid regions | Critical for zonal sampling strategies [59] |
| Low-Attachment Surfaces | Ultra-Low Attachment (ULA) plates, Elplasia plates, BioFloat plates | Facilitate scaffold-free spheroid formation | Surface properties influence spheroid uniformity and sampling approach [1] [62] |
| Analysis Kits | RNA extraction kits, single-cell sequencing reagents | Enable molecular analysis of sampled cells | Specialized protocols needed for 3D culture-derived material [1] |
The critical importance of representative sampling from spheroids cannot be overstated, as methodological choices directly impact experimental outcomes and translational relevance. The evidence presented in this guide demonstrates that no single sampling strategy is universally optimal; rather, researchers must align their approach with specific research objectives. For population-level analyses where spatial information is secondary, complete spheroid dissociation provides a practical and efficient approach, particularly when coupled with heterogeneity assessment methods like PCA-BC to characterize the starting population [60] [1]. For investigations of cellular plasticity, stem cell dynamics, or microenvironmental influences, zonal sampling strategies that preserve spatial relationships are essential, despite their technical challenges [59] [62].
The emerging field of spheroid research continues to develop more sophisticated analytical tools, including mathematical modeling approaches that can predict heterogeneity patterns and guide sampling strategies [61]. Regardless of the specific methodology employed, the fundamental principle remains consistent: researchers must acknowledge, characterize, and account for spheroid heterogeneity through appropriate sampling strategies to generate biologically relevant and reproducible data that effectively bridges the gap between in vitro models and in vivo reality.
Balancing Physiological Relevance with Throughput and Reproducibility
The transition from traditional two-dimensional (2D) to three-dimensional (3D) cell culture represents a paradigm shift in biomedical research, particularly in drug discovery and cancer biology. This shift is driven by the fundamental recognition that physiological relevance is crucial for generating predictive data, yet it introduces significant challenges in maintaining the high-throughput screening capabilities and reproducible data quality that drug development pipelines require [3] [64]. While 2D cultures—where cells grow in a single layer on plastic surfaces—have been the workhorse of laboratories for decades due to their simplicity and scalability, they suffer from critical limitations: they cannot mimic the complex tissue architecture, cell-cell interactions, and cell-ECM interactions that define living organisms [2]. The consequence of these limitations is stark: approximately 90% of drugs that show promise in conventional preclinical models (including 2D cultures) fail in human trials, often due to inadequate predictive power of the models used in early development [64].
The emergence of 3D culture systems—including spheroids, organoids, and scaffold-based models—addresses these limitations by providing a physiologically relevant environment that more accurately recapitulates the in vivo context [16] [2]. Cells in 3D cultures exhibit natural morphology, polarization, and gene expression patterns that closely mirror human tissue responses [1] [24]. However, these advanced models demand more sophisticated infrastructure, specialized reagents, and complex analytical techniques, creating a fundamental tension between biological fidelity and practical utility [3] [65]. This guide objectively compares the performance of 2D and 3D culture systems through the lens of this critical balance, providing researchers with evidence-based insights to inform their experimental designs.
Physiological Relevance: Bridging the Gap Between In Vitro and In Vivo
Morphological and Architectural Differences
The most immediately apparent difference between 2D and 3D culture systems lies in their physical structure and cellular organization. In 2D monolayers, cells are forced to adopt flattened, elongated morphologies as they spread across rigid plastic surfaces, fundamentally altering their natural shape and polarity [2]. In contrast, 3D cultures enable cells to assume their native configurations, forming complex tissue-like structures with appropriate cell-cell and cell-ECM interactions [16]. These architectural differences have profound functional implications, particularly for epithelial cells that require proper polarization for normal function.
Table 1: Structural and Morphological Comparisons Between 2D and 3D Cultures
| Characteristic | 2D Culture | 3D Culture | Biological Significance |
|---|---|---|---|
| Cell Morphology | Artificial flattening and stretching | Natural, in vivo-like shapes | Altered morphology affects cytoskeleton organization, signaling, and function [2] |
| Spatial Organization | Monolayer with uniform exposure to stimuli | Multiple layers with variable nutrient/gradient access | Mimics tissue barriers and microenvironmental heterogeneity [3] |
| Cell-Cell Interactions | Limited to horizontal contacts in a single plane | Omnidirectional, as in native tissues | Enables proper junction formation and collective cell behaviors [2] |
| Cell-ECM Interactions | Single surface attachment point | Natural engagement with surrounding matrix in 3D space | ECM interactions regulate survival, differentiation, and mechanotransduction [3] [16] |
| Polarity | Disrupted or absent | Properly established apical-basal polarity | Critical for barrier function, secretion, and absorption [2] |
Gene Expression and Transcriptomic Profiles
Perhaps the most compelling evidence for the superior physiological relevance of 3D cultures comes from comparative transcriptomic analyses. A comprehensive 2023 study comparing 2D and 3D colorectal cancer models revealed significant differences in gene expression profiles, with thousands of genes showing differential expression between the two systems [1]. Importantly, the transcriptomic signatures of 3D cultures demonstrated much closer alignment with patient-derived tumor samples than their 2D counterparts.
The differences extend beyond cancer biology. Research into extracellular vesicle (EV) production found that 3D cultures generate EVs with composition and functionality more representative of in vivo conditions than those produced in 2D systems [66]. Similarly, studies of hepatic models show that 3D-cultured hepatocytes maintain more appropriate drug metabolism enzymes and transporters, crucial for accurate pharmacokinetic and toxicity assessments [3] [64].
Table 2: Molecular and Functional Comparisons Between 2D and 3D Cultures
| Parameter | 2D Culture Findings | 3D Culture Findings | Experimental Evidence |
|---|---|---|---|
| Gene Expression Fidelity | Altered expression patterns | Closer match to in vivo transcriptomes | RNA sequencing showing 3D models recapitulate in vivo gene expression patterns [1] [24] |
| Drug Response | Overestimated efficacy; missed resistance | More predictive of clinical outcomes | Chemotherapy resistance patterns in 3D match clinical observations [1] [24] |
| Tumor Microenvironment | Limited heterogeneity and hypoxia | Established oxygen, nutrient, and pH gradients | Presence of hypoxic cores in tumor spheroids mimicking in vivo conditions [3] |
| Stem Cell Properties | Gradual loss of stemness | Maintenance of stem cell populations | Preservation of cancer stem cells in 3D tumor spheroids [2] |
| Epigenetic Patterns | Aberrant methylation profiles | Methylation patterns similar to patient tissues | 3D cultures and patient FFPE samples shared same methylation pattern [1] |
Signaling Pathway Fidelity and Cellular Communication
The preservation of proper signaling pathways represents another critical advantage of 3D culture systems. In living tissues, cells exist in a complex web of communication, exchanging signals through direct contact, soluble factors, and ECM remodeling. The diagram below illustrates how 3D cultures better recapitulate these in vivo signaling dynamics compared to 2D systems:
This enhanced signaling fidelity in 3D cultures translates to more accurate modeling of disease mechanisms and treatment responses. For instance, Roche uses 3D tumor spheroids to model hypoxic tumor cores and test immunotherapies, while Memorial Sloan Kettering employs patient-derived organoids to match therapies to drug-resistant pancreatic cancer patients [3].
Throughput and Scalability: Practical Considerations for Drug Screening
Experimental Workflow and Scalability Constraints
The drug discovery process requires efficient screening of thousands of compounds in its early stages, making throughput a critical consideration. The following diagram compares the general workflows for 2D and 3D culture systems in a screening context:
The throughput advantage of 2D systems remains substantial for simple viability and proliferation assays. These systems are compatible with automated liquid handling, high-content screening systems, and standardized microplate readers without significant modification [3] [64]. The established infrastructure for 2D culture, combined with simplified imaging and analysis requirements, enables rapid processing of thousands of compounds in standardized formats.
Throughput Comparison and Strategic Implementation
Table 3: Throughput and Scalability Comparison Between 2D and 3D Cultures
| Parameter | 2D Culture | 3D Culture | Practical Implications |
|---|---|---|---|
| Culture Establishment Time | Minutes to hours | Several hours to days | Longer setup reduces screening velocity [2] |
| Assay Compatibility | Compatible with most conventional HTS assays | Requires specialized assays and optimization | Higher implementation costs for 3D screening [3] |
| Automation Potential | Readily automated with existing systems | Requires specialized equipment and protocols | Significant infrastructure investment needed for 3D [65] |
| Imaging and Analysis | Straightforward with standard microscopy | Complex, often requiring confocal imaging and 3D analysis | Increased time and computational resources for 3D [3] |
| Standardization | Highly standardized protocols | Evolving standards with manufacturer-specific variations | Greater protocol optimization required for 3D [65] |
Leading laboratories have adopted a tiered screening approach that leverages the strengths of both systems: using 2D cultures for primary high-throughput screening of compound libraries, followed by 3D validation of selected hits [3]. This hybrid strategy balances the need for efficiency in early discovery with the demand for physiological relevance in lead optimization.
Reproducibility and Technical Considerations
Reproducibility Challenges and Solutions
Reproducibility constitutes a fundamental requirement for robust scientific research and drug development. While 2D cultures benefit from decades of protocol optimization and standardization, 3D systems introduce multiple variables that can impact experimental consistency:
Sources of Variability in 3D Cultures:
- Matrix composition differences between lots of natural hydrogels like Matrigel [16]
- Spheroid size heterogeneity affecting nutrient diffusion and core hypoxia [2]
- Technical variability in cell seeding density and distribution [65]
- Donor-to-donor variability in primary cell-derived organoids [3]
Industry leaders like InSphero have addressed these challenges through the development of highly standardized, reproducible 3D models that maintain physiological relevance while ensuring batch-to-batch consistency [65]. Their approach emphasizes defined matrices, controlled manufacturing processes, and rigorous quality control metrics—demonstrating that reproducibility challenges in 3D culture can be overcome through systematic engineering.
Protocol Details: Comparative Experimental Methodology
To illustrate the practical differences in working with these systems, below are detailed protocols for a representative experiment comparing drug response in 2D versus 3D cultures, adapted from a 2023 study in Scientific Reports [1]:
Experimental Protocol: Comparative Analysis of 5-Fluorouracil Response in Colorectal Cancer Models
Table 4: Key Research Reagent Solutions for 2D/3D Comparative Studies
| Reagent/Kit | Function | Example Product | Application Notes |
|---|---|---|---|
| Ultra-Low Attachment Plates | Prevents cell attachment, enabling spheroid formation | Nunclon Sphera U-bottom 96-well plates | Essential for scaffold-free spheroid formation [1] |
| Extracellular Matrix | Provides 3D scaffold for cell growth and signaling | Corning Matrigel matrix | Mimics natural basement membrane composition [3] [18] |
| Cell Viability Assay | Measures metabolic activity as proxy for viability | CellTiter 96 Aqueous Non-Radioactive Cell Proliferation Assay (MTS) | Works for both 2D and 3D; 3D may require longer incubation [1] |
| Apoptosis Detection Kit | Distinguishes stages of programmed cell death | FITC Annexin V Apoptosis Detection Kit I | Critical for understanding mechanism of drug response [1] |
| RNA Isolation Kit | Extracts high-quality RNA for transcriptomic analysis | Various commercial kits | 3D samples may require additional mechanical disruption [1] |
Methodology Details:
Cell Culture Setup:
- 2D Culture: Seed colorectal cancer cells (e.g., HCT-116, SW-480) at 5×10³ cells/well in standard 96-well tissue culture plates. Allow attachment for 24 hours.
- 3D Culture: Seed same cell number into Nunclon Sphera super-low attachment U-bottom 96-well microplates. Centrifuge plates at 300×g for 3 minutes to aggregate cells. Culture for 72 hours to form spheroids.
Drug Treatment:
- Prepare 5-fluorouracil (5-FU) serial dilutions in complete medium.
- Treat both 2D (24 hours post-seeding) and 3D (72 hours post-seeding) cultures with identical drug concentrations.
- Incubate for predetermined duration (typically 72-120 hours for 3D vs 48-72 hours for 2D).
Viability Assessment:
- Add 20μL MTS/phenazine methosulfate mixture to each well containing 100μL culture.
- Incubate for 1-4 hours at 37°C (3D cultures typically require longer incubation).
- Measure absorbance at 490nm using plate reader.
Apoptosis Analysis:
- Harvest 2D cells by trypsinization; collect 3D spheroids and dissociate to single cells.
- Wash cells with HBSS and resuspend in Annexin-binding buffer.
- Stain with FITC-Annexin V and propidium iodide (5μL each) for 15 minutes at room temperature.
- Analyze by flow cytometry (FACSCalibur) within 1 hour.
This representative protocol highlights the methodological adjustments required for 3D cultures, particularly regarding longer timeframes for spheroid formation and drug response assessment.
Strategic Implementation: Balancing the Competing Demands
Context-of-Use Framework for Model Selection
The decision between 2D and 3D culture systems should be guided by a context-of-use framework that matches the model capabilities to the specific research question [65]. The following diagram illustrates a strategic approach to model selection based on research objectives:
Integrated Workflows and Future Directions
Progressive research organizations are implementing integrated workflows that strategically deploy both model systems according to their strengths. As noted in the search results: "Most advanced labs now use a tiered approach: 2D for screening → 3D for prediction → organoids for personalization" [3]. This approach maximizes both efficiency and predictive power throughout the drug discovery pipeline.
The future landscape points toward continued convergence of these technologies, with emerging trends including:
- Automation-compatible 3D platforms that maintain physiological relevance while increasing throughput [65]
- Standardized protocols and reference materials to enhance reproducibility across laboratories [3]
- AI-powered analytics for extracting more information from complex 3D datasets [3] [18]
- Regulatory acceptance of 3D models for specific applications, reducing animal testing requirements [65]
The balance between physiological relevance, throughput, and reproducibility represents a central consideration in modern cell culture. While 2D systems maintain advantages for high-throughput applications and reductionist biological questions, 3D cultures provide indispensable physiological context for modeling complex tissue functions and disease processes. Rather than viewing these systems as mutually exclusive, researchers should adopt a strategic, integrated approach that deploys each system according to its strengths within a well-defined research workflow. As 3D technologies continue to mature—addressing current limitations in standardization, scalability, and analytical complexity—they are poised to become the default platform for predictive preclinical research, ultimately bridging the critical gap between conventional in vitro models and clinical reality.
Proof in the Data: Validating 3D Models Against 2D and In Vivo Benchmarks
In vitro cell culture is a cornerstone of biomedical research, drug discovery, and cancer biology. For decades, two-dimensional (2D) cell culture, where cells grow as a single layer on flat plastic surfaces, has been the standard model system [3] [2]. However, the recognition that 2D models poorly mimic the complex in vivo environment has driven the adoption of three-dimensional (3D) culture systems [3] [16]. These 3D models, including spheroids, organoids, and scaffold-based cultures, allow cells to grow in all directions, establishing more natural cell-cell and cell-extracellular matrix (ECM) interactions, spatial organization, and physiological gradients of oxygen, nutrients, and signaling molecules [3] [2] [67]. This architectural difference is not merely morphological; it profoundly influences cellular behavior, gene expression, and, critically, responses to therapeutic agents [68] [69]. This guide provides a comparative analysis of drug response genes in 2D versus 3D cell culture models, presenting objective experimental data to inform researchers and drug development professionals.
Key Comparative Features of 2D and 3D Cell Cultures
The table below summarizes the fundamental differences between 2D and 3D cell culture systems that underpin disparities in drug response.
Table 1: Fundamental Comparison of 2D and 3D Cell Culture Systems
| Feature | 2D Cell Culture | 3D Cell Culture | Research Implication |
|---|---|---|---|
| Growth Pattern & Architecture | Monolayer; flat, adherent growth [2] | Three-dimensional structures (e.g., spheroids, organoids) [2] | 3D models mimic in vivo tissue morphology and tumor microenvironments [3] [69] |
| Cell-Cell & Cell-ECM Interactions | Limited; disrupted spatial interactions [2] | Complex; recapitulates natural interactions and polarity [3] [67] | Critical for accurate signal transduction and gene expression profiles [3] |
| Microenvironmental Gradients | Uniform access to oxygen, nutrients, and drugs [2] | Physiological gradients of oxygen (hypoxia), pH, nutrients, and waste [3] [2] | Creates heterogeneous subpopulations of cells, influencing drug penetration and efficacy [68] |
| Gene Expression & Splicing | Altered morphology leads to changed gene expression and splicing [2] | In vivo-like gene expression profiles and mRNA splicing [2] [69] | Results in more accurate modeling of disease states and drug mechanisms [70] |
| Drug Penetration & Response | Direct and uniform exposure; can overestimate efficacy [3] [68] | Limited and heterogeneous penetration; often exhibits higher drug resistance [68] [69] | Better predicts in vivo drug performance, including resistance mechanisms [68] [8] |
| Cost & Throughput | Inexpensive, simple, high-throughput compatible [3] [2] | More expensive, time-consuming, fewer standardized assays [2] [16] | 2D is suited for initial high-throughput screening; 3D for secondary, predictive validation [3] |
Differential Drug Responses and Gene Expression Profiles
A primary application of 3D models is in oncology research, where they more accurately model solid tumor behavior. Multiple studies have consistently demonstrated that cells cultured in 3D exhibit significantly higher resistance to chemotherapeutic agents compared to their 2D counterparts.
Table 2: Documented Drug Response Differences Between 2D and 3D Cultures
| Cell Line / Model | Therapeutic Agent | Key Findings: 2D vs. 3D Response | Reference |
|---|---|---|---|
| A549 (Lung Cancer) | Lapatinib | Similar intracellular drug uptake in 2D and 3D, but 3D spheroids showed significantly less growth inhibition, indicating enhanced intrinsic drug tolerance [68]. | [68] |
| B16 F10 (Melanoma) & 4T1 (Breast Cancer) | Dacarbazine, Cisplatin | Cells grown on 3D models (EHS gel, PHB scaffolds) showed increased resistance to chemotherapy drugs compared to 2D monolayers [69]. | [69] |
| PEO4 (Ovarian Cancer) | Cisplatin, Paclitaxel | A computational model calibrated with 3D data showed different parameters and simulated behaviors compared to one calibrated with 2D data, highlighting the model-dependent nature of drug response assessment [8]. | [8] |
| General Tumor Models | Various Chemotherapies | 3D architecture creates physical barriers and gradients that limit drug penetration, contributing to reduced efficacy not observed in 2D [68] [69]. | [68] [69] |
The differential drug response is underpinned by significant alterations in gene expression. Research has shown that cells in 3D cultures possess gene expression profiles that are more comparable to in vivo tumors than cells grown in 2D [2] [69]. A comprehensive RNA-seq analysis of various human stem cells further revealed that culture conditions (a technical factor) have a strong impact on gene expression diversity, sometimes surpassing the effect of tissue origin (a biological factor) [70]. This suggests the 3D environment itself pushes cells toward a more native transcriptional state.
Pathway analysis of differential expression data reveals consistent trends. When comparing cell lines to their tissues of origin, processes like cell cycle, DNA replication and repair, and transcription are often upregulated in cell lines [71]. Conversely, pathways related to specific tissue functions (e.g., immune system function in blood, metabolism and cell adhesion in skin) are enriched in primary tissues [71]. This indicates that 2D culture selects for a proliferative phenotype, while 3D systems better maintain tissue-specific functionality, which directly impacts how cells respond to drugs that target these pathways.
Experimental Protocols for Comparative Analysis
To ensure the validity and reproducibility of comparative 2D/3D studies, robust and well-characterized experimental protocols are essential. Below are detailed methodologies for key assays cited in this field.
3D Spheroid Formation and Drug Treatment (Liquid Overlay Method)
This protocol is a common scaffold-free technique for generating multicellular tumor spheroids (MCTS) [3] [2].
- Coating Plates: Use 96-well plates treated with ultra-low attachment (ULA) coating to prevent cell adhesion and promote self-aggregation [2] [16].
- Cell Seeding: Seed a single-cell suspension at an optimized density (e.g., 1,000-5,000 cells/well in 100-200 µL of culture medium) depending on the cell line and desired spheroid size [2].
- Spheroid Formation: Centrifuge the plate at low speed (e.g., 500 x g for 5 minutes) to aggregate cells at the bottom of the well. Incubate at 37°C with 5% CO₂ for 24-72 hours to allow for compact spheroid formation.
- Drug Treatment: After spheroids have formed, add chemotherapeutic agents (e.g., Lapatinib, Cisplatin) directly to the existing medium at the desired concentrations. Include vehicle-only controls.
- Incubation and Analysis: Incubate for the treatment duration (e.g., 72 hours). Assess outcomes using viability assays (e.g., CellTiter-Glo 3D) [8], imaging for morphology changes, or processing for gene expression analysis.
Stimulated Raman Scattering (SRS) Microscopy for Drug Uptake
This advanced optical technique allows for label-free quantification of drug uptake and distribution within 2D and 3D cultures [68].
- Sample Preparation: Culture cells in both 2D (on glass-bottom dishes) and as 3D spheroids using the ULA method.
- Drug Treatment: Treat both models with the drug of interest. For SRS, compounds with unique vibrational bonds, like C-D bonds in deuterated drugs, are often used.
- SRS Imaging:
- Mount the samples on a custom-built or commercial SRS microscope.
- Use a two-laser system (pump and Stokes) to probe the specific Raman shift of the drug molecule (e.g., C-D stretch at ~2100-2300 cm⁻¹).
- Simultaneously acquire images in the C-H region (for cellular biomass) and the fingerprint region (for broader molecular information).
- Data Analysis:
- Quantify intracellular drug concentration by integrating the SRS signal intensity in the C-D channel within cell boundaries defined by the C-H image.
- Generate false-color heat maps to visualize the spatial distribution and penetration depth of the drug within 3D spheroids [68].
- Correlate local drug concentration with subsequent biological response (e.g., cell death markers) in different spheroid regions.
Signaling Pathways and Regulatory Networks
The transition from 2D to 3D culture induces profound changes in the cellular regulatory network. These changes are not merely due to differential expression of a few key genes but are the cumulative result of widespread alterations in transcription factor (TF) regulation [71]. Network analysis of paired cell lines and tissues has revealed that while cell lines retain a signature of their tissue of origin, they exhibit significant rewiring of TF networks. A key finding is that over-expressed cell cycle genes in cell lines show an overall decrease in repressive targeting by transcription factors, effectively releasing brakes on proliferation [71].
Diagram 1: Network-level changes in 3D cultures drive drug resistance. The 3D microenvironment initiates signaling that leads to widespread transcription factor (TF) activity changes and network rewiring. This results in the de-repression of pro-proliferation genes and enhancement of protective pathways, collectively conferring a drug-resistant phenotype.
The Scientist's Toolkit: Essential Research Reagents
Selecting the appropriate tools is critical for establishing robust and physiologically relevant 2D and 3D culture models. The table below lists key reagent solutions used in the featured experiments.
Table 3: Key Reagent Solutions for 2D/3D Comparative Studies
| Reagent / Material | Function in Research | Application Context |
|---|---|---|
| Ultra-Low Attachment (ULA) Plates | Provides a non-adhesive surface to promote cell self-aggregation into spheroids in a scaffold-free manner [2] [16]. | Suspension culture for spheroid formation; used in drug sensitivity and penetration studies [68]. |
| Matrigel / ECM Hydrogels | A complex, reconstituted basement membrane extract that provides a biologically active scaffold for 3D cell growth and organoid formation [2] [16]. | Embedded or on-top 3D cultures; used for studying invasion, morphogenesis, and tissue-specific functions. |
| Polyhydroxybutyrate (PHB) Scaffolds | Synthetic, biodegradable polymer scaffolds (e.g., SCPL membranes, electrospun fibers) that provide a tunable 3D structure for cell growth [69]. | A fully synthetic and reproducible alternative to animal-derived matrices for 3D drug screening [69]. |
| CellTiter-Glo 3D Assay | A luminescent viability assay optimized for 3D models, utilizing a reagent that penetrates spheroids to lyse cells and quantify ATP content [8]. | Viability measurement post-drug treatment in 3D spheroids; more reliable than standard MTT in 3D [8]. |
| Hanging Drop Plates | A scaffold-free technique where gravity forces cells to aggregate and form a single spheroid within a droplet of medium suspended from a plate lid [3] [16]. | High-throughput spheroid generation with uniform size and shape, ideal for screening applications. |
The high failure rate of anticancer drugs in clinical trials, despite promising preclinical results, represents a critical challenge in oncology research. A significant contributor to this problem is the reliance on traditional two-dimensional (2D) cell culture models, which do not accurately mimic the complex biology of human tumors. This guide examines the growing body of evidence demonstrating that three-dimensional (3D) cell culture models bridge this translational gap by exhibiting gene expression profiles that closely correlate with clinical tumor samples, offering more predictive platforms for drug development.
2D vs. 3D Culture: A Fundamental Divide in Tumor Modeling
Architectural and Microenvironmental Differences
Traditional 2D cell cultures, where cells grow as a single layer on plastic surfaces, fail to recapitulate the architecture of human tissues. In these flat monolayers, all cells have equal, unrestricted access to oxygen, nutrients, and growth factors [3] [2]. This unnatural environment leads to altered cell morphology, disrupted cell-cell and cell-extracellular matrix (ECM) interactions, and loss of tissue-specific polarity [2] [54].
In contrast, 3D culture systems allow cells to grow in all directions, forming structures such as spheroids and organoids that closely resemble the 3D tumor architecture found in vivo [72]. These models develop natural gradients of oxygen, pH, and nutrients, creating heterogeneous microenvironmental zones similar to those in solid tumors: an external proliferating zone, an internal quiescent zone, and a necrotic hypoxic core [72] [54]. This architectural complexity drives more physiological gene expression patterns that better align with clinical observations.
Table 1: Fundamental Differences Between 2D and 3D Cell Culture Systems
| Characteristic | 2D Culture | 3D Culture |
|---|---|---|
| Growth Pattern | Monolayer on flat surface | Three-dimensional structures in all directions |
| Cell-Matrix Interactions | Limited, unnatural | Extensive, physiologically relevant |
| Tumor Architecture | Does not mimic in vivo tissue | Recapitulates native tumor organization |
| Microenvironment | Homogeneous nutrient and oxygen access | Heterogeneous gradients (oxygen, nutrients, pH) |
| Proliferation Rate | Uniformly rapid and unnatural | Varies by location within structure, more physiological |
| Gene Expression | Altered, does not reflect in vivo patterns | More closely mirrors gene expression in clinical tumors |
Transcriptomic Evidence: 3D Cultures More Closely Mirror Clinical Tumor Profiles
Comprehensive Transcriptomic Analysis
A landmark 2023 study published in Scientific Reports provided direct transcriptional evidence supporting the superiority of 3D models. Researchers conducted a comparative analysis using five different colorectal cancer (CRC) cell lines cultured in both 2D and 3D formats, with Formalin-Fixed Paraffin-Embedded (FFPE) blocks from CRC patients serving as the clinical reference [1].
RNA sequencing and thorough bioinformatic analyses revealed significant dissimilarity in gene expression profiles between 2D and 3D cultures, involving thousands of differentially expressed genes (up/down-regulated) across multiple pathways for each cell line [1]. The 3D cultures demonstrated gene expression patterns that more closely aligned with the clinical tumor samples than their 2D counterparts.
Key Transcriptional Differences and Pathway Analysis
The transcriptomic differences between 2D and 3D cultures extend beyond random variations to affect crucial cancer-relevant pathways:
- Drug Metabolism and Resistance Pathways: Genes involved in drug transport, metabolism, and resistance mechanisms show markedly different expression patterns, explaining the frequently observed drug resistance in 3D models that better mirrors clinical responses [73] [24].
- Hypoxia Response Genes: 3D cultures consistently show upregulation of hypoxia-inducible factors (HIFs) and their target genes, reflecting the oxygen gradient present in actual tumors but absent in 2D monolayers [72].
- ECM and Adhesion Molecules: Expression of integrins, cadherins, and other adhesion molecules differs significantly, affecting cell signaling, survival, and migration capacities [54].
- Proliferation and Apoptosis Regulators: While 2D cultures typically show uniformly high expression of proliferation markers, 3D cultures exhibit more heterogeneous patterns that include quiescent and slowly-cycling cell populations, better representing tumor heterogeneity [54].
Table 2: Key Transcriptomic Differences Between 2D and 3D Culture Systems
| Transcriptomic Feature | 2D Culture Expression | 3D Culture Expression | Clinical Relevance |
|---|---|---|---|
| Hypoxia-responsive Genes | Generally low or absent | Significantly upregulated in core regions | Mirrors hypoxic tumor cores in patients |
| Drug Resistance Markers | Often downregulated or altered | More physiological expression | Explains clinical drug resistance patterns |
| Cell-Cell Adhesion Molecules | Abnormal patterns | Physiorganization resembling in vivo tumors | Affects invasion and metastasis potential |
| Proliferation Signatures | Uniformly high across population | Heterogeneous based on spatial location | Reflects varying proliferation zones in actual tumors |
| Stemness Markers | Often diminished | Better maintained, especially in core regions | Preserves cancer stem cell populations |
Methodological Framework: Establishing 3D Cultures for Gene Expression Studies
3D Culture Establishment Protocols
Creating physiologically relevant 3D models requires specific methodologies that differ substantially from standard 2D culture techniques:
Scaffold-Based Methods:
- Hydrogel Embedding: Cells are suspended in ECM-based hydrogels such as Matrigel or synthetic alternatives, then polymerized to create a 3D support structure. This method facilitates natural cell-matrix interactions and has been shown to promote expression of tissue-specific genes [73].
- Synthetic Scaffolds: Utilizing materials like polyhydroxybutyrate (PHB) membranes created through solvent-casting particle-leaching (SCPL) or electrospinning techniques. These fully synthetic scaffolds offer better reproducibility while still enabling spheroid formation and in vivo-like gene expression profiles [24].
Scaffold-Free Methods:
- Hanging Drop Technique: Cells are placed in droplets on the underside of a culture plate lid, allowing gravity-enforced aggregation into spheroids without external scaffolds. This method is straightforward but can be limited in scalability [73].
- Ultra-Low Attachment Plates: Specially treated plastic surfaces prevent cell adhesion, forcing cells to self-assemble into spheroids. This approach, used with Nunclon Sphera plates in the CRC study, enables high-throughput formation of uniform spheroids [1].
- Rotating Bioreactors: Systems like the Rotary Cell Culture System (RCCS) keep cells in constant suspension, allowing aggregation with minimal shear forces. This method is particularly suitable for larger spheroid formation and has been used for modeling various tumor types [73].
Experimental Workflow for Comparative Studies
Diagram 1: Experimental workflow for 3D-clinical correlation studies. This schematic outlines the key steps in establishing 3D cultures and validating their transcriptomic correlation with clinical tumor samples.
The Researcher's Toolkit: Essential Reagents and Platforms for 3D Transcriptomics
Successfully implementing 3D culture models for gene expression studies requires specific reagents and platforms designed to support three-dimensional growth while enabling downstream molecular analyses.
Table 3: Essential Research Reagents and Platforms for 3D Culture Transcriptomic Studies
| Reagent/Platform | Type | Primary Function | Application in Transcriptomics |
|---|---|---|---|
| Matrigel/ECM Hydrogels | Scaffold | Provides biologically active 3D matrix for cell growth | Promoves physiologically relevant gene expression patterns |
| Ultra-Low Attachment Plates | Platform | Prevents cell adhesion, forcing spheroid formation | Enables high-throughput spheroid formation for transcriptomic screening |
| Hanging Drop Plates | Platform | Facilitates spheroid formation through gravity aggregation | Creates uniform spheroids for reproducible gene expression studies |
| RNA Stabilization Reagents | Reagent | Preserves RNA integrity in complex 3D structures | Maintains RNA quality during extraction from dense spheroids |
| Tissue Disruption Kits | Reagent | Homogenizes 3D structures for RNA extraction | Ensures complete RNA recovery from compact spheroids |
| Single-Cell RNA Seq Kits | Reagent | Enables transcriptomic analysis at single-cell level | Reveals heterogeneity within different spheroid regions |
| Polymer Scaffolds (e.g., PHB) | Scaffold | Synthetic alternative to biological matrices | Provides reproducible platform for studying ECM-driven gene expression |
Biological Significance: How 3D-Driven Gene Expression Affects Therapeutic Responses
Drug Resistance Mechanisms
The altered gene expression profiles in 3D cultures directly impact therapeutic responses, mirroring clinical drug resistance patterns not observed in 2D models. Cells in 3D cultures consistently demonstrate increased resistance to chemotherapy drugs such as 5-fluorouracil, cisplatin, and doxorubicin compared to their 2D counterparts [1] [24]. This resistance emerges from multiple factors:
- Upregulation of Drug Efflux Transporters: Genes encoding P-glycoprotein and other ABC transporters are often elevated in 3D cultures, enhancing drug export capabilities [73].
- Altered Cell Cycle Regulation: The presence of quiescent cell populations in 3D spheroids reduces susceptibility to cell cycle-dependent chemotherapeutic agents [72].
- Enhanced DNA Repair Capacity: Expression of DNA repair genes is frequently modulated in 3D cultures, increasing recovery from DNA-damaging agents [54].
Cancer Stem Cell Preservation
3D culture environments better maintain cancer stem cell (CSC) populations, which play crucial roles in tumor initiation, metastasis, and therapy resistance. The transcriptomic profiles of 3D cultures show sustained expression of stemness markers such as OCT4, NANOG, and SOX2, which are often diminished in 2D cultures [74]. This preservation has significant implications for drug development, as therapies that appear effective in 2D models may fail to eliminate the critical CSC population that drives long-term tumor recurrence.
Tumor Microenvironment Interactions
Advanced 3D co-culture systems incorporate multiple cell types, including cancer-associated fibroblasts, immune cells, and endothelial cells, enabling study of the complex cellular crosstalk that influences tumor behavior and therapeutic responses [75]. These systems demonstrate how paracrine signaling between different cell types alters gene expression patterns in ways that cannot be captured in monoculture 2D systems.
Advanced Models: Patient-Derived Organoids and Clinical Translation
Patient-Derived Organoids (PDOs)
The most physiologically relevant 3D models are PDOs, which are established directly from patient tumor samples and maintain the genetic and phenotypic characteristics of the original tumor [73]. Transcriptomic analyses have demonstrated that PDOs retain the gene expression signatures of their parental tumors through multiple passages, making them invaluable for personalized medicine approaches [73] [74].
Institutions like Memorial Sloan Kettering Cancer Center have successfully utilized PDOs to match therapies for drug-resistant pancreatic cancer patients, demonstrating the clinical predictive value of these models [3]. The ability to maintain patient-specific gene expression patterns in PDOs enables truly personalized drug screening and biomarker identification.
Integration with Multi-Omics Technologies
The combination of 3D culture models with multi-omics approaches (genomics, transcriptomics, proteomics) provides comprehensive molecular profiling that enhances clinical predictive power [75]. This integrated approach allows researchers to identify context-specific, clinically actionable biomarkers that may be missed when relying on a single data type.
Diagram 2: Microenvironment-driven transcriptomic modulation in 3D cultures. This schematic illustrates how specific features of the 3D tumor microenvironment activate key signaling pathways that drive transcriptomic changes, ultimately enhancing clinical predictivity.
The evidence comprehensively demonstrates that 3D cell culture models address critical limitations of traditional 2D systems by exhibiting gene expression profiles that more closely correlate with clinical tumor samples. The preservation of tissue-specific architecture, physiological microenvironmental gradients, and appropriate cell-ECM interactions in 3D models drives more faithful transcriptional programs that better predict therapeutic responses.
For researchers and drug development professionals, incorporating 3D models into preclinical workflows—particularly through tiered approaches using 2D for initial screening and 3D for predictive validation—offers a path to more efficient and effective therapeutic development. As 3D technologies continue to advance, with improvements in standardization, scalability, and multi-omics integration, their role in bridging the translational gap will only expand, potentially reducing both drug development costs and late-stage clinical failures.
In the realm of drug discovery and development, the accurate prediction of a compound's efficacy and toxicity hinges on the use of preclinical models that faithfully recapitulate human physiology. For decades, two-dimensional (2D) cell culture has been the standard workhorse for in vitro testing. However, a paradigm shift is underway, driven by the growing recognition that three-dimensional (3D) cell culture models often provide a more physiologically relevant context for evaluating drug response. This guide objectively compares these two models by examining the critical link between their fundamental transcriptomic landscapes and the resulting phenotypic outcomes in functional assays. A substantial body of comparative literature indicates that 3D cell cultures demonstrate a more in vivo-like gene expression profile and, consequently, more clinically predictive responses to therapeutic agents [39] [1] [76].
Quantitative Data Comparison: 2D vs. 3D Models
The differences between 2D and 3D culture systems are quantifiable across multiple parameters, from gene expression to drug resistance. The tables below summarize key comparative data extracted from published studies.
Table 1: Transcriptomic and Phenotypic Differences in 2D vs. 3D Cultures
| Cell Type / Cancer | Proliferation Rate in 3D | Key Upregulated Pathways in 3D | Drug Resistance in 3D |
|---|---|---|---|
| Prostate Cancer (PC-3, LNCaP, DU145) [39] | Lower | Altered gene expression profile | More resistant to paclitaxel and docetaxel |
| Colorectal Cancer (Caco-2, HCT-116, others) [1] | Significant (p<0.01) difference in pattern over time | Thousands of significantly (p-adj<0.05) up/down-regulated genes involving multiple pathways | More resistant to 5-fluorouracil, cisplatin, and doxorubicin |
| HER2+ Breast Cancer (BT474, HCC1954) [76] | N/D | Increased expression of cell survival proteins (Akt), drug transporters, and drug targets | More resistant to neratinib and docetaxel |
| Cervical Cancer (SiHa) [13] | N/D | Upregulation of immune activation, angiogenesis, tissue remodeling, and HPV16 E6/E7 genes | Suggests superior model for drug response studies |
Table 2: Functional and Mechanistic Differences in 2D vs. 3D Cultures
| Parameter | 2D Culture Findings | 3D Culture Findings | Biological Implication |
|---|---|---|---|
| Cell Viability (ATP levels) [76] | Higher (set as 100% baseline) | Reduced to 18-44% of 2D levels | Lower proliferation rate in 3D mimics in vivo tumor growth |
| Drug Metabolism [76] | Limited CYP3A4 activity | Substantially increased CYP3A4 activity | 3D models better predict in vivo drug metabolism and toxicity |
| Methylation & microRNA [1] | Altered pattern compared to patient tissue (FFPE) | Shared same pattern with patient tissue (FFPE) | 3D epigenetics more closely mirrors the in vivo state |
| Apoptosis Profile [1] | Different apoptotic/live status | Different apoptotic/live status | Cell death mechanisms differ fundamentally between models |
Experimental Protocols for Key Comparative Assays
To ensure the reproducibility of 2D vs. 3D comparisons, standardized methodologies are essential. Below are detailed protocols for key experiments cited in the data tables.
Protocol for Establishing 3D Spheroid Cultures
- Method: Non-scaffold, forced-floating method using super-low attachment plates.
- Procedure:
- Prepare a single-cell suspension of the chosen cell line (e.g., colorectal, breast, or cervical cancer cells).
- Seed an aliquot of 200 µL of cell suspension (at a density of 5 × 10^3 cells) into individual wells of a Nunclon Sphera super-low attachment U-bottom 96-well microplate [1] [13].
- Centrifuge the plate at 70 × g for 5 minutes to encourage cell aggregation at the bottom of the well.
- Maintain the spheroids in a complete growth medium at 37°C in a humidified atmosphere of 5% CO₂.
- Perform consecutive 75% medium changes every 24-48 hours to provide nutrients without disrupting the forming spheroids [1].
- Allow spheroids to form and grow for 7-9 days before use in subsequent assays [13].
Protocol for Cell Proliferation Assay (MTS Assay)
- Objective: To compare proliferation rates between 2D and 3D cultures over time.
- Reagents: CellTiter 96 Aqueous Non-Radioactive Cell Proliferation Assay Kit (MTS/PMS) [1].
- Procedure:
- Culture cells in both 2D and 3D formats, seeding at an identical initial density (e.g., 5 × 10^3 cells/well).
- At desired time points, add 20 µL of the MTS/PMS mixture (20:1 v/v) directly to each well containing 100 µL of culture medium.
- Incubate the plate for 4 hours at 37°C.
- Measure the absorbance of the soluble formazan product at 490 nm using a standard ELISA plate reader.
- The absorbance is directly proportional to the number of metabolically active cells, allowing for a comparison of proliferation rates between the two models [1].
Protocol for Drug Response / Cytotoxicity Assay
- Objective: To evaluate and compare the efficacy of anticancer drugs in 2D and 3D cultures.
- Procedure:
- Establish stable 2D monolayers and 3D spheroids as described above.
- Treat both models with a range of concentrations of the drug of interest (e.g., neratinib, docetaxel, 5-fluorouracil).
- Incubate for a predetermined period (e.g., 72-144 hours).
- Assess cell viability using an ATP-based luminescence assay (e.g., CellTiter-Glo 3D for spheroids) or the MTS assay described above.
- Calculate the percentage of cell survival relative to an untreated control (NT) for each model.
- Generate dose-response curves and calculate IC₅₀ values. A significantly higher IC₅₀ in 3D cultures indicates enhanced innate resistance, a common finding that more closely mirrors clinical drug response [39] [76].
Protocol for Transcriptomic Analysis (RNA Sequencing)
- Objective: To comprehensively identify differentially expressed genes (DEGs) between 2D and 3D cultures.
- Procedure:
- RNA Extraction: Harvest 2D and 3D samples and extract total RNA using a commercial kit (e.g., PureLink RNA Mini Kit), including an on-column DNase treatment step to remove genomic DNA contamination. Assess RNA purity and concentration using a spectrophotometer [13].
- Library Preparation and Sequencing: Ship high-quality RNA (RIN > 8.0) for library preparation and subsequent sequencing on a platform such as Illumina NovaSeq 6000, generating 150 bp paired-end reads [13].
- Bioinformatic Analysis:
- Perform quality control on raw sequencing reads using tools like FastQC.
- Align reads to the appropriate reference genome (e.g., GRCh38 for human) using a splice-aware aligner like STAR.
- Quantify transcript/gene-level abundance from aligned reads using software such as RSEM.
- Identify DEGs using statistical packages like DESeq2 or edgeR, applying appropriate thresholds (e.g., adjusted p-value < 0.05 and absolute log2 fold change > 1) [1] [13].
- Pathway Analysis: Perform functional enrichment analysis (e.g., GO, KEGG) on the DEG list to identify biological pathways that are differentially active between the two culture conditions [13].
Visualizing the Mechanistic Workflow and Signaling Pathways
The following diagrams, generated with Graphviz, illustrate the core experimental workflow and the key molecular pathways differentially regulated in 3D models.
Experimental Workflow for 2D vs. 3D Comparison
Key Signaling Pathways in 3D Cultures
The Scientist's Toolkit: Essential Research Reagents and Materials
Successfully conducting 2D vs. 3D comparative studies requires specific reagents and tools. The following table details essential solutions for these experiments.
Table 3: Research Reagent Solutions for 2D vs. 3D Functional Validation
| Item | Function / Application | Example Product / Method |
|---|---|---|
| Super-Low Attachment Plates | Prevents cell attachment, enabling spheroid formation via forced-floating. | Nunclon Sphera U-bottom 96-well plates [1] [13] |
| Viability Assay Kits | Quantifying metabolically active cells in both 2D and 3D formats. | CellTiter 96 AQueous (MTS) for 2D/3D; CellTiter-Glo 3D for optimal spheroid lysis [1] [76] |
| Apoptosis Detection Kit | Distinguishing between live, early apoptotic, and late apoptotic cells. | FITC Annexin V / Propidium Iodide (PI) staining with flow cytometry [1] |
| RNA Extraction Kit | Isolating high-quality total RNA for downstream transcriptomic analysis. | PureLink RNA Mini Kit with on-column DNase treatment [13] |
| Poly-HEMA | Coating culture surfaces to create a non-adhesive hydrogel for 3D spheroid formation. | Used in the forced-floating method for breast cancer cell studies [76] |
| Extracellular Matrix (ECM) Hydrogels | Providing a biologically relevant scaffold for more complex 3D culture models. | ECM hydrogels for restoring hepatocyte phenotype (e.g., in HepG2 models) [76] |
The drug discovery process is notoriously time-intensive and costly, with approximately 90% of discovered drugs that reach the clinical trial phase failing to gain FDA approval and commercialization [1]. A significant factor contributing to this high attrition rate is the poor predictive capacity of traditional two-dimensional (2D) cell culture systems, which do not adequately mimic the complex physiological environments where cells naturally reside [77] [58]. In response to this limitation, three-dimensional (3D) cell culture models have emerged as transformative tools that better recapitulate in vivo tissue architecture, cell-cell interactions, and cell-extracellular matrix (ECM) interactions [77].
This guide objectively compares the performance of 2D and 3D cell culture models, with a specific focus on their economic and predictive value within drug discovery pipelines. By synthesizing experimental data on cellular morphology, gene expression, and drug responses, we demonstrate how 3D models provide more clinically relevant data, ultimately de-risking drug development and potentially saving millions in downstream costs associated with late-stage clinical failures [1] [78].
Morphological and Functional Differences Between 2D and 3D Cultures
Fundamental Architectural Distinctions
Cells cultured in 2D systems grow as a single layer on flat, rigid polystyrene or glass surfaces, forcing them into an unnatural state that compromises their morphology and polarity [3] [58]. In contrast, 3D cultures enable cells to grow in all directions, forming complex structures that closely resemble native tissues. These structures include:
- Spheroids: Spherical, multi-cellular aggregates that can be scaffold-free or scaffold-based [77] [58].
- Organoids: More complex, self-organizing structures that develop from stem cells or organ progenitors and recapitulate key aspects of micro-anatomy and organ functionality [77] [78].
citation:3 highlights a critical real-world consequence: a promising cancer therapy successfully killed tumor cells in 2D culture and passed animal trials, but failed badly in Phase I human trials because the 2D model could not mimic the dense, three-dimensional tumor ecosystem.
Impact on Cellular Microenvironment
The architectural differences create fundamentally different microenvironments. While 2D cultures offer a homogeneous environment, 3D models recreate physiological gradients of oxygen, nutrients, pH, and metabolic waste products [3]. These gradients lead to the formation of heterogeneous cell populations within 3D structures, including proliferating, quiescent, and hypoxic regions—conditions commonly observed in human tumors but absent in 2D monolayers [1].
Comparative Experimental Data: A Quantitative Analysis
Drug Response and Resistance Profiles
Substantial evidence demonstrates that cells in 3D cultures exhibit markedly different responses to therapeutic agents compared to their 2D counterparts, often showing increased resistance that more closely mirrors clinical observations.
Table 1: Comparative Drug Responses in 2D vs. 3D Culture Models
| Cell Line | Therapeutic Agent | 2D Culture Response | 3D Culture Response | Reference |
|---|---|---|---|---|
| B16 F10 murine melanoma & 4T1 murine breast cancer | Dacarbazine, Cisplatin | Increased sensitivity | Increased resistance | [7] |
| Various colorectal cancer (CRC) cell lines (Caco-2, HCT-116, LS174T, SW-480, HCT-8) | 5-Fluorouracil, Cisplatin, Doxorubicin | Increased sensitivity | Increased resistance | [1] |
| Prostate cancer (PC-3, LNCaP, DU145) | Paclitaxel, Docetaxel | Increased sensitivity | Increased resistance | [39] |
| Colon cancer HCT-116 | Melphalan, Fluorouracil, Oxaliplatin, Irinotecan | Increased sensitivity | Increased resistance | [77] |
The increased drug resistance observed in 3D models is multifactorial, arising from:
- Limited drug penetration through multiple cell layers and ECM [77] [78].
- Presence of quiescent cells in the inner cores of spheroids [1].
- Activation of survival pathways influenced by 3D architecture and cell-ECM interactions [7].
Proliferation and Apoptosis Dynamics
Cells in 3D cultures typically demonstrate lower proliferation rates compared to 2D cultures, which more accurately reflects the growth dynamics of in vivo tissues [39]. A comparative study using colorectal cancer cell lines found significant differences (p < 0.01) in proliferation patterns over time between 2D and 3D cultures [1]. Furthermore, analysis of apoptotic status using FITC Annexin V staining revealed distinct cell death phase profiles between the two models, with 3D cultures often showing reduced baseline apoptosis [1].
Gene Expression and Epigenetic Profiles
Perhaps the most significant differences emerge at the molecular level. A comprehensive transcriptomic study using RNA sequencing and bioinformatic analysis revealed significant dissimilarity (p-adj < 0.05) in gene expression profiles between 2D and 3D cultures, involving thousands of up/down-regulated genes across multiple pathways for each colorectal cancer cell line tested [1].
Table 2: Molecular and Genetic Characteristics of 2D vs. 3D Cultures
| Characteristic | 2D Culture | 3D Culture | In Vivo Relevance |
|---|---|---|---|
| Gene Expression Profile | Altered; differs significantly from in vivo | More similar to in vivo patterns; more physiologically relevant | High for 3D [1] [39] |
| Methylation Pattern | Elevated methylation rate; altered from in vivo | Similar to FFPE patient samples | High for 3D [1] |
| microRNA Expression | Altered compared to in vivo | Similar to FFPE patient samples | High for 3D [1] |
| Pathway Activation | Does not fully recapitulate in vivo signaling | Better represents multiple in vivo pathways | High for 3D [1] |
| Cell-Cell Signaling | Limited due to forced 2D orientation | Enhanced; more physiologically accurate | High for 3D [58] |
Epigenetically, 3D cultures and Formalin-Fixed Paraffin-Embedded (FFPE) patient samples shared the same methylation pattern and microRNA expression, while 2D cells showed elevation in methylation rate and altered microRNA expression [1]. This molecular divergence explains why 3D cultures provide superior models for predicting drug efficacy and toxicity in humans.
Methodological Approaches in 3D Cell Culture
Experimental Workflow for 3D Model Evaluation
The following diagram illustrates a generalized experimental workflow for generating and comparing 2D and 3D models, incorporating key assays that highlight their differential performance.
3D Cell Culture Techniques and Applications
The two primary approaches for establishing 3D cultures are scaffold-based and scaffold-free methods, each with distinct advantages and applications.
The Scientist's Toolkit: Essential Reagents and Materials
Table 3: Key Research Reagent Solutions for 3D Cell Culture
| Reagent/Material | Function | Example Applications |
|---|---|---|
| Polyhydroxybutyrate (PHB) scaffolds | Fully synthetic, cost-effective scaffold offering high reproducibility for 3D cell growth [7] | Drug screening; comparison with classical models [7] |
| Matrigel/ECM gels | Naturally-derived basement membrane hydrogel providing microenvironment for morphogenesis [77] [78] | Organoid development; stem cell differentiation [77] |
| Nunclon Sphera U-bottom plates | Super-low attachment surface to promote spheroid formation in defined geometry [1] | High-throughput screening; uniform spheroid production [1] |
| Hanging drop plates | Platform for spheroid formation through self-aggregation in discrete media droplets [77] | Spheroid generation; co-culture models [77] |
| Magnetic 3D bioprinting system | Enables magnetic levitation and patterning of cells into 3D structures [39] | Prostate cancer models; drug testing [39] |
| CellTiter 96 Aqueous Assay | Colorimetric cell proliferation assay (MTS) adapted for 3D cultures [1] | Proliferation rate comparison; drug efficacy [1] |
| FITC Annexin V Apoptosis Kit | Flow cytometry-based detection of apoptotic cells in 3D structures [1] | Apoptosis profiling; treatment response [1] |
Economic Implications and Future Directions
The adoption of 3D cell culture technologies represents a paradigm shift in preclinical drug discovery, with significant economic implications. While the initial investment in 3D culture systems may be higher than traditional 2D methods, the potential for reducing late-stage clinical failures offers substantial cost savings. As noted in [3], most advanced pharmaceutical companies and research institutions now employ a tiered approach: utilizing 2D for high-throughput screening of thousands of compounds, followed by 3D models for predictive assessment of efficacy and safety, and ultimately patient-derived organoids for personalized therapy selection.
Future developments in 3D cell culture are focused on increasing physiological complexity through:
- Vascularization of 3D models to enable nutrient delivery to inner layers [77] [78].
- Multi-organ-on-chip systems that interconnect different organoids to study systemic effects [77] [78].
- Automated 3D bioprinting for high-throughput production of standardized, complex tissue models [78].
- AI-powered predictive analytics that leverage 3D data to forecast clinical outcomes with greater accuracy [3].
Regulatory bodies, including the FDA and EMA, are increasingly considering 3D model data in drug submissions, signaling a growing acceptance of these technologies as valid predictive tools [3]. By 2028, most pharmaceutical R&D pipelines are expected to adopt integrated 2D/3D workflow models, combining the speed of flat models with the physiological relevance of 3D systems to optimize the drug discovery process [3].
Conclusion
The collective evidence firmly establishes that 3D cell culture models induce a fundamental shift in gene expression, bringing it significantly closer to in vivo conditions than traditional 2D monolayers. This enhanced biological relevance, characterized by more accurate profiles of metabolism, cell adhesion, and stemness-related genes, directly addresses the high failure rates in drug development by providing more predictive preclinical data. Future directions point toward the integration of 3D models with advanced technologies like AI-driven analytics and patient-derived organoids, paving the way for truly personalized medicine and a systematic reduction in the reliance on animal models. For biomedical research, transitioning to 3D systems is not merely a technical upgrade but a necessary evolution to generate clinically meaningful insights.
References
- 1. Comparative analysis between 2D and 3D colorectal cancer culture models for insights into cellular morphological and transcriptomic variations | Scientific Reports [https://www.nature.com/articles/s41598-023-45144-w]
- 2. 2D and 3D cell cultures – a comparison of different types of cancer cell cultures - PMC [https://pmc.ncbi.nlm.nih.gov/articles/PMC6040128/]
- 3. 3D vs 2D Cell Culture: Which Model Suits Your Lab in 2025? [https://www.pharmanow.live/knowledge-hub/research/3d-vs-2d-cell-culture-comparison]
- 4. 3D vs 2D Cell Culture: A Comprehensive Comparison and ... [https://cellculturecollective.com/blog/3d-cell-culture-vs-2d-cell-culture/?srsltid=AfmBOooFhL1PEYxgGslXKTtyvD74XXQThLhSWpWh3eRongIg1Koth9O_]
- 5. Spheroid-Based 3D Models to Decode Cell Function and ... [https://pmc.ncbi.nlm.nih.gov/articles/PMC12606745/]
- 6. 2D versus 3D tumor-on-chip models to study the impact of ... [https://www.nature.com/articles/s41598-025-03504-8]
- 7. Comparison of 2D and 3D cell culture models for cell growth, gene expression and drug resistance - PubMed [https://pubmed.ncbi.nlm.nih.gov/31761183/]
- 8. A comparative analysis of 2D and 3D experimental data for ... [https://www.nature.com/articles/s41598-023-42486-3]
- 9. Identification of key metabolism-related genes and ... [https://pubmed.ncbi.nlm.nih.gov/39229380/]
- 10. Identification of key metabolism-related genes and ... [https://www.frontiersin.org/journals/endocrinology/articles/10.3389/fendo.2024.1440436/full]
- 11. Metabolic gene alterations impact the clinical ... [https://www.nature.com/articles/s42003-019-0666-1]
- 12. Breaking the mold: 3D cell cultures reshaping the future of ... [https://www.frontiersin.org/journals/cell-and-developmental-biology/articles/10.3389/fcell.2024.1507388/full]
- 13. Deciphering the divergent transcriptomic landscapes of ... [https://pmc.ncbi.nlm.nih.gov/articles/PMC11347336/]
- 14. Deciphering the divergent transcriptomic landscapes of ... [https://www.frontiersin.org/journals/cell-and-developmental-biology/articles/10.3389/fcell.2024.1413882/full]
- 15. Comparative metabolomic and transcriptomic analysis of ... [https://pubmed.ncbi.nlm.nih.gov/40955118/]
- 16. Is It Time to Start Transitioning From 2D to 3D Cell Culture? [https://www.frontiersin.org/journals/molecular-biosciences/articles/10.3389/fmolb.2020.00033/full]
- 17. Epithelial Cells in 2D and 3D Cultures Exhibit Large ... [https://www.sciencedirect.com/science/article/pii/S1672022921000267]
- 18. 3D Cell Culture Summit Roadshow 2025 [https://www.corning.com/worldwide/en/products/life-sciences/news-events/events/2025/09/3d-summit-2025.html]
- 19. Comparison of 3D culture systems on mesenchymal stem cell ... [https://pmc.ncbi.nlm.nih.gov/articles/PMC12562725/]
- 20. Cell–extracellular matrix mechanotransduction in 3D - PMC [https://pmc.ncbi.nlm.nih.gov/articles/PMC10656994/]
- 21. Cellular mechanotransduction in health and diseases [https://www.nature.com/articles/s41392-023-01501-9]
- 22. Review Epigenetic regulation of extracellular matrix ... [https://www.sciencedirect.com/science/article/abs/pii/S0006295225005908]
- 23. Bridging the gap: from 2D cell culture to 3D microengineered ... [https://pmc.ncbi.nlm.nih.gov/articles/PMC4780579/]
- 24. Comparison of 2D and 3D cell culture models for ... [https://www.sciencedirect.com/science/article/abs/pii/S0928493119305934]
- 25. Mechanical regulation of transcription: Recent advances [https://pmc.ncbi.nlm.nih.gov/articles/PMC8221528/]
- 26. Effects of three-dimensional collagen scaffolds on the ... [https://pmc.ncbi.nlm.nih.gov/articles/PMC5919708/]
- 27. Advances in the application of natural/synthetic hybrid ... [https://www.sciencedirect.com/science/article/abs/pii/S0378517325001590]
- 28. Advancements in Hydrogels: A Comprehensive Review of ... [https://www.mdpi.com/2073-4360/17/15/2026]
- 29. Tumor extracellular matrix enhances invasive gene ... [https://www.nature.com/articles/s41598-025-12196-z]
- 30. and 2 D 3 D Cell Culture Comparison [https://www.news-medical.net/life-sciences/2D-and-3D-Cell-Culture-Comparison.aspx]
- 31. An Overview on Spheroid and Organoid Models in Applied ... [https://www.mdpi.com/2413-4155/7/1/27]
- 32. Hanging drop culture reprograms mesenchymal stem cell ... [https://link.springer.com/article/10.1007/s13346-025-01927-4]
- 33. Comparison of three-dimensional cell culture techniques ... [https://www.frontiersin.org/journals/cell-and-developmental-biology/articles/10.3389/fcell.2024.1362696/full]
- 34. A 3D spheroid model for assessing nanocarrier-based ... [https://www.nature.com/articles/s44385-025-00041-x]
- 35. A 3D tumor spheroid model with robust T cell infiltration ... [https://pmc.ncbi.nlm.nih.gov/articles/PMC12283745/]
- 36. and three-dimensional culture systems in tumor models ... [https://pmc.ncbi.nlm.nih.gov/articles/PMC12425351/]
- 37. What 32000 3D Spheroids Revealed About Culture ... [https://www.promegaconnections.com/what-32000-3d-spheroids-revealed-about-culture-conditions/]
- 38. Ontology analysis of global gene of human... expression differences [https://pubmed.ncbi.nlm.nih.gov/24840613/]
- 39. Comparative Assay of 2D and 3D Cell Culture Models: Proliferation, Gene Expression and Anticancer Drug Response - PubMed [https://pubmed.ncbi.nlm.nih.gov/29623827/]
- 40. Single-cell Micro-C profiles 3D genome structures at high ... [https://www.nature.com/articles/s41588-025-02247-6]
- 41. Designing Successful RNA-Seq Experiments for Drug ... [https://alitheagenomics.com/blog/designing-successful-rna-seq-experiments-for-drug-discovery-a-strategic-approach]
- 42. How thoughtful experimental design can empower biologists ... [https://pmc.ncbi.nlm.nih.gov/articles/PMC12328601/]
- 43. 3D spatial biology: A new dimension for drug discovery [https://www.ddw-online.com/3d-spatial-biology-a-new-dimension-for-drug-discovery-36077-202508/]
- 44. Tumor heterogeneity reshapes the ... [https://pmc.ncbi.nlm.nih.gov/articles/PMC9066118/]
- 45. 3D tumor cultures for drug resistance and screening ... [https://pmc.ncbi.nlm.nih.gov/articles/PMC11927140/]
- 46. 2D vs 3D Cell Culture [https://advancedbiomatrix.com/2d-vs-3d-cell-culture.html]
- 47. 2D vs 3D Cell Culture: Choosing the Right Model [https://www.tempobioscience.com/2d-vs-3d-cell-culture-choosing-the-right-model-by-tempo-bioscience/]
- 48. Controlled tumor heterogeneity in a co-culture system by ... [https://www.nature.com/articles/s41598-023-40680-x]
- 49. Overcoming Challenges in Nucleic Acid Isolation from 3D ... [https://www.thermofisher.com/blog/life-in-the-lab/overcoming-challenges-in-nucleic-acid-isolation-from-3d-tumor-models/]
- 50. RNA Extraction from Cartilage: Issues, Methods, Tips [https://www.mdpi.com/1422-0067/24/3/2120]
- 51. Techniques for RNA extraction from cells cultured in ... [https://pubmed.ncbi.nlm.nih.gov/34062095/]
- 52. Comparative analysis of high-throughput RNA extraction ... [https://www.sciencedirect.com/science/article/abs/pii/S1056871924000595]
- 53. RNA Extraction Method Impacts Quality Metrics and ... [https://www.sciencedirect.com/science/article/pii/S0023683722004433]
- 54. Three-Dimensional Cell Culture Systems and Their ... [https://pmc.ncbi.nlm.nih.gov/articles/PMC4026212/]
- 55. Label-free 3D molecular imaging of living tissues using ... [https://www.nature.com/articles/s41467-024-51616-y]
- 56. Pheno-seq – linking visual features and gene expression ... [https://www.nature.com/articles/s41598-019-48771-4]
- 57. Molecular imaging using (nano)probes - RSC Publishing [https://pubs.rsc.org/en/content/articlehtml/2025/ra/d5ra03927d]
- 58. 3D Cell Culture Methods and Applications [https://elveflow.com/microfluidic-reviews/3d-cell-culture-methods-and-applications-a-short-review/]
- 59. Mimicking the Complexity of Solid Tumors: How Spheroids ... [https://pmc.ncbi.nlm.nih.gov/articles/PMC11987746/]
- 60. Redefine tumor spheroids heterogeneity via PCA-coupled ... [https://www.nature.com/articles/s41598-025-19557-8]
- 61. Mathematical modeling of multicellular tumor spheroids ... [https://www.nature.com/articles/s41540-025-00492-3]
- 62. Standardized Methodology of Scaffold-Free and ... [https://www.mdpi.com/2409-9279/8/5/123]
- 63. Comparative Study of Spheroids (3D) and Monolayer ... [https://www.mdpi.com/2304-8158/13/4/564]
- 64. 3D cell culture: market and industrial needs [https://elveflow.com/microfluidic-reviews/3d-cell-culture-market-industrial-needs/]
- 65. The Model of Excellence in 3D Cell Culture: Scalable ... [https://insphero.com/3d-cell-culture-model-of-excellence/]
- 66. improving physiological relevance and yield with 3D cell ... [https://pubs.rsc.org/en/content/articlelanding/2025/nr/d5nr00707k]
- 67. A Century of Cell Culture And The Rise of Organ-Chips [https://emulatebio.com/2d-vs-3d-cell-culture-models/]
- 68. Assessing Drug Uptake and Response Differences in 2D and ... [https://pubmed.ncbi.nlm.nih.gov/39186736]
- 69. Comparison of 2D and 3D cell culture models for ... [https://www.sciencedirect.com/science/article/pii/S0928493119305934]
- 70. Comprehensive comparison of gene expression diversity ... [https://pmc.ncbi.nlm.nih.gov/articles/PMC9706419/]
- 71. Regulatory network changes between cell lines and their ... [https://pmc.ncbi.nlm.nih.gov/articles/PMC5596945/]
- 72. 3D Cell Culture Models as Recapitulators of the Tumor ... [https://pmc.ncbi.nlm.nih.gov/articles/PMC8749977/]
- 73. 3D tumor cultures for drug resistance and screening ... [https://molecular-cancer.biomedcentral.com/articles/10.1186/s12943-025-02281-2]
- 74. Three-Dimensional Culture System: A New Frontier in ... [https://pmc.ncbi.nlm.nih.gov/articles/PMC12292892/]
- 75. Bridging the Gap: Translating Preclinical Biomarkers to ... [https://blog.crownbio.com/bridging-the-gap-translating-preclinical-biomarkers-to-clinical-success]
- 76. The relevance of using 3D cell cultures, in addition to 2D ... [https://pmc.ncbi.nlm.nih.gov/articles/PMC5216757/]
- 77. Three-Dimensional Cell Cultures in Drug Discovery and ... [https://pmc.ncbi.nlm.nih.gov/articles/PMC5448717/]
- 78. 3D Cell Culture - A Rapidly Emerging Technique for Drug ... [https://www.ddw-online.com/3d-cell-culture-a-rapidly-emerging-technique-for-drug-discovery-973-201704/]