Building Robust Data Preprocessing Pipelines for Single-Cell Foundation Model Training
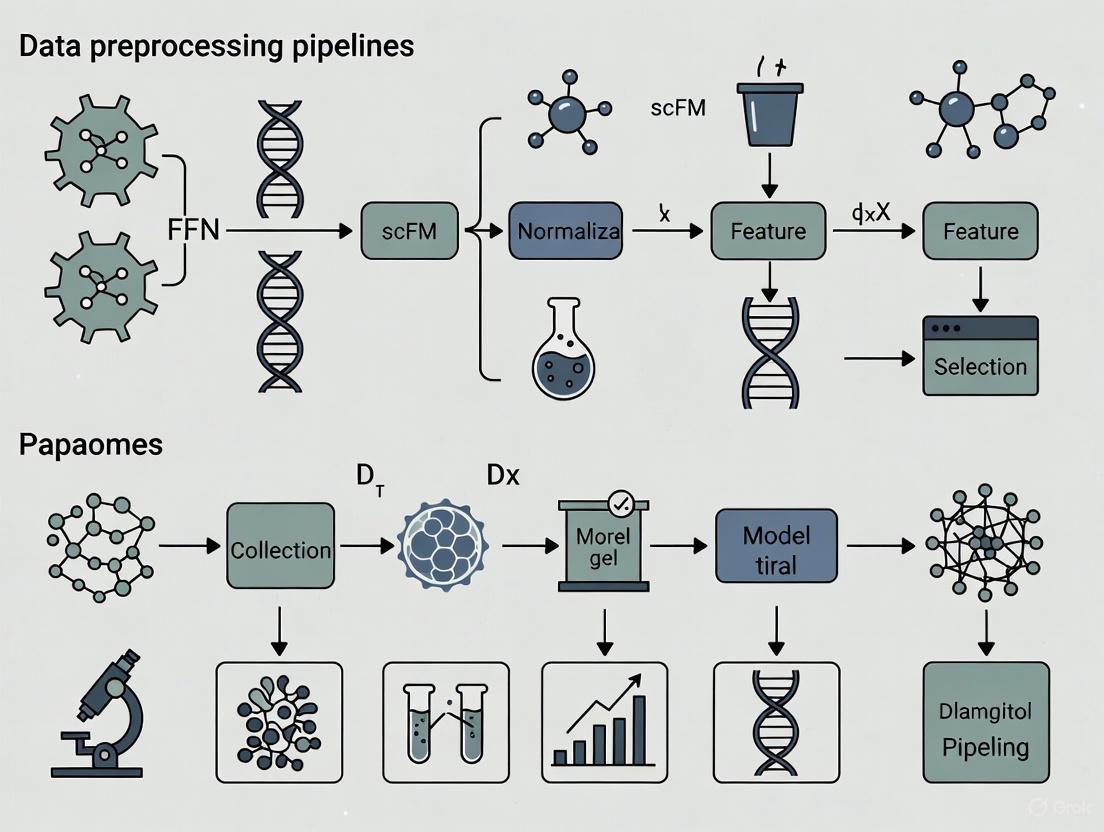
This article provides a comprehensive guide for researchers and bioinformaticians on constructing effective data preprocessing pipelines for single-cell Foundation Model (scFM) training.
Building Robust Data Preprocessing Pipelines for Single-Cell Foundation Model Training
Abstract
This article provides a comprehensive guide for researchers and bioinformaticians on constructing effective data preprocessing pipelines for single-cell Foundation Model (scFM) training. It covers foundational concepts, practical methodologies, critical optimization strategies, and robust validation techniques. The content addresses key challenges such as data heterogeneity, tokenization strategies, and bias mitigation, emphasizing how high-quality, well-structured preprocessing is crucial for developing generalizable and powerful models that can advance drug discovery and biomedical research.
Laying the Groundwork: Core Concepts and Data Challenges in scFM Preprocessing
Understanding the Single-Cell Foundation Model (scFM) Ecosystem and its Data Demands
Single-cell Foundation Models (scFMs) are large-scale artificial intelligence models, pre-trained on vast datasets of single-cell RNA sequencing (scRNA-seq) data, designed to learn universal biological representations that can be adapted to a wide range of downstream tasks [1]. These models, inspired by the success of large language models, treat individual cells as "sentences" and genes or genomic features as "words" or "tokens" [1]. Their development is driven by the rapid expansion of public single-cell data repositories, which now encompass tens of millions of cells profiling diverse cell types, states, and conditions [1]. This technical support article guides researchers through the data preprocessing pipelines and experimental protocols essential for effective scFM training and application.
The scFM landscape features several prominent models with distinct architectures and pretraining strategies. The table below summarizes key models and their primary data characteristics.
Table 1: Key Single-Cell Foundation Models and Their Data Profiles
| Model Name | Core Architecture | Pretraining Data Scale | Key Specialization / Focus |
|---|---|---|---|
| scGPT [2] [3] | Generative Pretrained Transformer (Decoder) | Over 33 million cells [3] | Multi-omic integration, perturbation prediction |
| Geneformer [4] [5] | Transformer | Not Specified in Results | Gene-network biology, leveraging rank-based input |
| scBERT [1] [2] | Bidirectional Encoder Representations from Transformers (BERT) | 1.12 million human cells [3] | Cell type annotation |
| scFoundation [4] [2] | Transformer | Not Specified in Results | Gene-level tasks, uses value projection |
| GeneMamba [5] | State Space Model (BiMamba) | Scalable to over 50 million cells [5] | Computational efficiency, long-sequence modeling |
Data Prerequisites for Pretraining
A critical ingredient for any scFM is the compilation of large and diverse datasets. Successful pretraining requires:
- Data Volume and Diversity: Models are trained on massive, aggregated corpora from public archives like CZ CELLxGENE, the Human Cell Atlas, and NCBI GEO, which provide a broad coverage of cell types and states necessary for learning generalizable patterns [1].
- Data Quality Challenges: A significant challenge is managing inconsistent data quality, batch effects, technical noise, and varying processing steps across different studies and experiments [1]. Effective pretraining requires careful dataset selection, filtering of cells and genes, and quality control [1].
Section 2: Troubleshooting Guides and FAQs
Data Preprocessing and Tokenization
Q: What is the best method to tokenize single-cell data for foundation models? My model performance is sub-optimal.
Single-cell data is not naturally sequential, unlike text, so tokenization strategies are critical. Incompatible tokenization can lead to poor model convergence and an inability to capture biological relationships.
A: The choice of tokenization strategy is a fundamental architectural decision. Below is a comparison of the primary methods.
Table 2: Comparison of scRNA-seq Data Tokenization Strategies
| Tokenization Strategy | How It Works | Advantages | Disadvantages | Used By |
|---|---|---|---|---|
| Rank-based [5] | Genes are ranked by expression level within each cell; the sequence of gene IDs is the input. | Robust to batch effects and noise; captures relative expression. | Loses information on absolute expression magnitude. | Geneformer, GeneMamba |
| Bin-based [5] | Expression values are grouped into predefined, discrete bins (e.g., low, medium, high). | Preserves some information about expression level distribution. | Can introduce information loss; sensitive to binning parameters. | scBERT, scGPT |
| Value Projection [5] | Continuous expression values are projected into an embedding space via a linear layer. | Maintains full, continuous data resolution. | Diverges from standard NLP tokenization; impact not fully known. | scFoundation |
Troubleshooting Steps:
- Audit Your Data: If your data has significant technical variation, consider a rank-based approach for its inherent robustness [5].
- Define Your Goal: If predicting subtle shifts in expression is critical, a value projection method may be more appropriate [5].
- Consult the Literature: Use the tokenization method employed by the model you are building upon or fine-tuning (see Table 2).
This logical workflow for selecting and implementing a tokenization strategy can be visualized as follows:
Model Selection and Performance
Q: How do I choose the right scFM for my specific biological task, such as cell type annotation or perturbation prediction?
A: Model performance is highly task-dependent. A comprehensive 2025 benchmark study revealed that no single scFM consistently outperforms all others across diverse applications [4]. Use the following guidance:
Table 3: Model Selection Guide Based on Task and Resources
| Primary Task | Recommended Model Considerations | Computational Constraint Considerations |
|---|---|---|
| Cell Type Annotation | scBERT is specialized for this, but newer models like scGPT also show strong performance [1] [2]. | For limited resources, a simpler baseline model (e.g., on HVGs) may be more efficient for a single, specific dataset [4]. |
| Perturbation Prediction | scGPT has been successfully adapted for predicting outcomes to both genetic and novel chemical perturbations [3]. | Models like GeneMamba offer a more computationally efficient alternative to transformers for large-scale perturbation studies [5]. |
| Multi-batch Integration | scGPT, Geneformer, and GeneMamba have demonstrated strong capabilities in integrating datasets and removing batch effects [4] [5]. | |
| Gene-level Tasks | Geneformer and scFoundation have shown strong capabilities in tasks focused on gene relationships and function [4] [2]. |
Troubleshooting Steps:
- Clearly define your primary downstream task (e.g., annotation, integration, prediction).
- Assess your computational resources and dataset size. For smaller, focused studies, simpler non-foundation models may be sufficient and more efficient [4].
- Consult the "Scientist's Toolkit" below for key resources that can aid in model evaluation and selection, such as the BioLLM framework [2].
Computational Efficiency and Fine-tuning
Q: Training or fine-tuning an scFM is too computationally expensive. What are my options?
A: The quadratic complexity of the transformer architecture can indeed be a bottleneck. Consider these approaches:
- Alternative Architectures: Explore next-generation models designed for efficiency. For example, GeneMamba uses a State Space Model (SSM) architecture with linear computational complexity, significantly reducing training time and memory requirements while maintaining performance [5].
- Parameter-Efficient Fine-Tuning (PEFT): Instead of updating all model parameters, use adapter-based methods. For instance, you can inject a small, trainable drug-conditional adapter layer to fine-tune a model for molecular perturbation prediction, training less than 1% of the original model's parameters [3]. This preserves the pre-trained knowledge and prevents overfitting on small datasets.
Section 3: The Scientist's Toolkit
This section details key resources and materials for researchers working with scFMs.
Table 4: Essential Research Reagent Solutions for scFM Workflows
| Item / Resource | Function / Purpose | Example / Note |
|---|---|---|
| BioLLM Framework [2] | A unified system with standardized APIs that simplifies the process of using, comparing, and benchmarking different scFMs. | Enables streamlined model switching and consistent evaluation. |
| Public Data Atlases [1] | Provide the large-scale, diverse, and annotated single-cell datasets required for pre-training and benchmarking scFMs. | CZ CELLxGENE, Human Cell Atlas, PanglaoDB. |
| Cell Ontology-Informed Metrics [4] | Novel evaluation metrics that assess whether a model's learned representations are consistent with established biological knowledge. | scGraph-OntoRWR, Lowest Common Ancestor Distance (LCAD). |
| Parameter-Efficient Fine-Tuning (PEFT) [3] | A set of techniques that allows adaptation of large models to new tasks by training only a small number of parameters, saving compute resources. | Includes adapter layers (e.g., scDCA) and prefix tuning. |
The relationships between these core components in a typical scFM research workflow are illustrated below:
Frequently Asked Questions (FAQs)
Q1: What are the primary differences between CZ CELLxGENE Discover and the Human Cell Atlas (HCA) Data Portal? The core difference lies in their structure and access methods. CZ CELLxGENE Discover is a highly integrated and standardized corpus of data, accessible via a powerful graphical user interface and a programmable API (Census) for efficient data slicing [6] [7]. In contrast, the Human Cell Atlas (HCA) Data Portal is a vast, community-generated repository where you can access raw and processed data from numerous independent projects within the global HCA consortium [8] [9]. CZ CELLxGENE is often used for direct analysis of a curated collection, while the HCA provides a broader view of ongoing single-cell research efforts.
Q2: I need to download a specific subset of data for analysis in R or Python. Which resource is most suitable? For this purpose, the CZ CELLxGENE Census is specifically designed for programmatic data access [7]. It allows you to query and download precise slices of data based on cell or gene metadata. The data can be directly loaded into popular objects like AnnData (for Scanpy in Python), Seurat objects (for R), or SingleCellExperiment objects (for Bioconductor in R), which significantly streamlines your workflow [10] [7].
Q3: How can I ensure the scRNA-seq data I use from these repositories is reproducible and well-annotated? Repositories increasingly adhere to community standards like the Minimum Information about a Single-Cell Experiment (minSCe) guidelines [11]. When depositing or selecting data, check for complete metadata, including detailed protocols for cell isolation, library construction, and sequencing. The HCA Data Coordination Platform and CZ CELLxGENE work to standardize this information. For cell type annotations, which are often inferred computationally, ensure the analysis methods are reproducible and clearly documented [11].
Q4: My analysis requires a comprehensive, tissue-specific reference atlas. Where should I look? Both resources offer this. The HCA is actively building consensus tissue-specific atlases, such as the Human Lung Cell Atlas (HLCA), which integrates data from 486 individuals [12]. CZ CELLxGENE Discover also allows you to browse data by tissue and offers a "Cell Guide" that acts as an encyclopedia for cell types, providing definitions, marker genes, and relevant datasets [6]. For a multi-tissue, baseline reference from healthy donors, the Tabula Sapiens collection, available on CZ CELLxGENE, is an excellent resource [6] [12].
Q5: I am studying cancer. Are there specialized databases I should use alongside these general repositories? Yes, cancer-specific databases are highly valuable. Resources like TISCH and CancerSEA are tailored for cancer single-cell research [12]. TISCH provides detailed annotations of the tumor microenvironment across many cancer types, while CancerSEA focuses on decoding various functional states of cancer cells (e.g., invasion, stemness) [12]. You can use CZ CELLxGENE or the HCA to find original cancer datasets and then leverage these specialized portals for deeper, cancer-focused analysis.
Comparison of Major Single-Cell Data Repositories
The table below summarizes the key quantitative and qualitative features of major data sources to help you select the right one for your research needs.
| Repository | Scale (Cells) | Data Type | Primary Access Method | Key Features & Tools |
|---|---|---|---|---|
| CZ CELLxGENE Discover [6] | 33M+ cells, 436 datasets [6] | Standardized, integrated scRNA-seq | Web UI, Census API (Python/R) | Differential Expression, Explorer, Cell Guide, Census for programmatic access [6] [7] |
| Human Cell Atlas (HCA) Data Portal [8] | 70.3M cells, 523 projects [8] | Community-generated, multi-omic | Web Portal, Data Browser | Raw & processed data from global consortium; organized by biological network [8] [9] |
| Single Cell Portal (Broad Institute) [12] | 654 datasets [12] | Individual study datasets | Web UI, Direct download | Interactive visualizations (t-SNE, UMAP), often includes study-specific analysis tools [10] [12] |
| Tabula Sapiens [12] | Data from 15 individuals, 24 tissues [12] | Integrated multi-tissue atlas | Web UI, CZ CELLxGENE | A reference of "healthy" or baseline cell states across the human body [12] |
| GEO / SRA [10] | 3,000+ scRNA-seq studies [11] | Raw sequencing data (FASTQ) & processed data | Web search, Direct download | Broad repository; often the original data source for other portals; requires significant preprocessing [10] |
Experimental Protocols for Data Utilization
Protocol 1: Accessing and Querying Data via CZ CELLxGENE Census API
This protocol is essential for researchers who need to programmatically extract specific data slices for large-scale analysis, such as training scFM models.
- Installation: Install the
cellxgene_censuspackage in your Python or R environment. - Connect to Census: Open a connection to the Census data. The package will handle the cloud-based data access.
- Query Data: Use the SOMA interface to specify query criteria based on cell metadata (e.g., tissue, cell type, disease) and/or gene metadata.
- Data Retrieval: Load the queried data directly into an AnnData (Python/Scanpy), Seurat (R), or SingleCellExperiment (R/Bioconductor) object [7].
- Local Analysis: Proceed with your standard preprocessing and analysis workflow on the in-memory object.
Key Consideration: The Census data may include both full-length and 3'/5' sequencing data. Use the metadata variable is_primary_data to filter out duplicate cells present across multiple datasets if needed [7].
Protocol 2: Building a Custom Consolidated Dataset from the HCA Data Portal
This protocol guides you through aggregating data from multiple projects on the HCA portal for a meta-analysis.
- Define Scope: Identify the biological question (e.g., T-cell states in lung cancer) to determine relevant tissues, diseases, and cell types.
- Browse and Filter: Use the HCA Data Portal's exploration tools to filter projects by organism, organ, or assay type [8].
- Select Projects: Manually curate a list of projects based on experimental design and metadata completeness, referring to minSCe guidelines [11].
- Data Download: Download the raw count matrices and associated metadata for each selected project.
- Harmonize and Integrate: This is the most critical and challenging step. Use batch correction tools like Harmony, BBKNN, or Seurat's CCA to integrate the datasets, ensuring that cell types are aligned across different studies [13] [12].
Research Reagent Solutions: Computational Tools for Data Handling
The table below lists essential computational "reagents" for working with public single-cell data repositories.
| Tool / Resource | Function | Use-Case |
|---|---|---|
| CZ CELLxGENE Census [7] | Programmatic data access | Efficiently query and load specific data subsets from CZ CELLxGENE into Python/R. |
| Seurat [10] [13] | scRNA-seq analysis (R) | An all-in-one toolkit for QC, normalization, clustering, and integration of datasets. |
| Scanpy [13] | scRNA-seq analysis (Python) | A comprehensive Python-based toolkit for analyzing single-cell gene expression data. |
| SingleCellExperiment [10] | Data object (R/Bioconductor) | A standard S4 class for storing single-cell data; interoperable with many Bioconductor packages. |
| AnnData [7] | Data object (Python) | The standard Python object for single-cell data, used by Scanpy and CellxGene Census. |
| Harmony [12] | Data integration | Algorithm for integrating datasets to remove batch effects while preserving biological variation. |
Workflow Diagrams
Data Access Workflow for scFM Research
Single-Cell Data Ecosystem Overview
Frequently Asked Questions (FAQs)
FAQ 1: What is the core purpose of a preprocessing pipeline for single-cell foundation model (scFM) training?
The preprocessing pipeline transforms raw, unstructured single-cell data into a standardized, numerical format that a deep learning model can process. Its primary goal is to remove unwanted technical variation (e.g., from differences in sequencing depth) while preserving meaningful biological signals (e.g., cell type differences). This involves critical steps like normalization, which makes gene counts comparable between cells, and tokenization, which converts the normalized gene expression profiles into a sequence of discrete tokens that serve as the model's input [14] [1]. A robust pipeline is essential for building a model that generalizes well across diverse datasets and biological conditions.
FAQ 2: My dataset has an abundance of zeros. Is this a technical error I need to fix?
Not necessarily. A high abundance of zeros is an inherent feature of single-cell RNA-sequencing (scRNA-seq) datasets, stemming from both biological factors (a gene being truly inactive in a cell) and technical factors (mRNA molecules not being captured or amplified during library preparation, often called "dropout") [14]. Your preprocessing strategy should account for this. While some imputation methods exist to address technical zeros, many successful scFMs are trained directly on the sparse, normalized count data without complex imputation, allowing the model to learn from the data's inherent structure [1].
FAQ 3: Why is tokenization necessary since I already have a gene expression matrix?
While a gene expression matrix is structured, it lacks the sequential nature that transformer-based models, the backbone of most foundation models, are designed to process. Tokenization standardizes this data into discrete input units, or "tokens," analogous to words in a sentence for a language model [1]. For scFMs, a "token" typically represents a gene (or a feature) along with its expression value. Since genes have no natural order, a crucial part of tokenization is defining a sequence, often by ranking genes by their expression level within each cell before feeding them to the model [1].
FAQ 4: How do I choose a normalization method for my scRNA-seq data?
There is no single best-performing normalization method, and the choice can impact downstream analysis like clustering [15]. The selection depends on your data's characteristics and your analysis goals. The table below summarizes some commonly used methods. It is considered good practice to test multiple methods and compare their results in cell clustering and embedding [14] [15].
Table 1: Common scRNA-seq Data Normalization Methods
| Method | Underlying Principle | Key Features | Considerations |
|---|---|---|---|
| Global Scaling (e.g., LogNorm) | Divides counts by total per cell and log-transforms [15]. | Simple, fast, widely used. | May not effectively normalize high-abundance genes [15]. |
| SCTransform | Uses regularized negative binomial regression [15]. | Models technical noise, avoids overfitting, generates depth-independent residuals. | More computationally intensive than global scaling. |
| Scran | Pools cells to compute size factors [15]. | Robust for data with many zero counts. | Performance can depend on the pooling strategy. |
| BASiCS | Uses a Bayesian hierarchical model [15]. | Can integrate spike-in RNAs to quantify technical variation. | Requires spike-in genes or technical replicates. |
Troubleshooting Guides
Issue 1: Poor Model Performance Due to Data Quality and Batch Effects
Problem: Your scFM fails to generalize or shows inconsistent performance across different datasets, likely due to unaddressed technical artifacts and batch effects.
Investigation & Resolution:
Audit Your Data Sources: The first step is to scrutinize the data used for pretraining. scFMs are trained on large, aggregated datasets from public repositories like CZ CELLxGENE, GEO, and SRA [1]. Check for consistency in:
- Cell Isolation Protocol: Was the data generated using microfluidics, droplets, or microplates? [14]
- Library Preparation: Was it a full-length or 3'/5' counting-based method? [14]
- Sequencing Depth: Are there vast differences in the number of reads per cell across studies?
- Solution: Implement rigorous quality control and filtering for cells and genes during the data compilation stage. The goal is to create a high-quality, non-redundant training corpus [1].
Evaluate Normalization Efficacy: Test if your normalization method has successfully removed the technical variation.
- Metric: Use the silhouette width to assess the clarity of cell clustering after normalization. Employ the K-nearest neighbor batch-effect test to check if cells from the same cell type but different batches mix well [14].
- Solution: If batches are not integrating well, try a method like SCTransform, which explicitly models the relationship between gene expression and sequencing depth, or explore batch-effect correction tools after normalization [14] [15].
Issue 2: Inefficient Tokenization and Input Representation
Problem: The model struggles with long sequences (memory issues) or fails to capture fine-grained, nucleotide-level information, often due to a suboptimal tokenization strategy.
Investigation & Resolution:
Diagnose the Tokenization Bottleneck: Standard tokenization that treats each gene as a token can lead to very long sequences, hitting the context window limits of transformer models [16].
- Solution - Adaptive Tokenization: For long sequences, consider a method like Byte-Pair Encoding (BPE), which merges frequent character sequences into tokens, effectively shortening the sequence length. For tasks requiring fine-grained resolution (e.g., predicting single-nucleotide variants), nucleotide-level (NUC) tokenization is preferable, though more resource-intensive. Frameworks like BiRNA-BERT demonstrate that a dual-tokenization approach, dynamically selecting between BPE and NUC based on input length, can be highly effective [16].
Define a Robust Gene Ordering: Since genes lack a natural sequence, the model requires an arbitrary but deterministic order.
- Solution: A common and effective strategy is to rank genes by their expression values within each cell before creating the token sequence [1]. This creates a consistent input structure for the model to learn from. You can also enrich tokens with metadata, such as prepending a special token representing the cell's identity or adding modality indicators for multi-omics data [1].
The following diagram illustrates the complete workflow from raw single-cell data to model-ready tokens, integrating the key troubleshooting points.
The Scientist's Toolkit: Essential Research Reagents & Materials
Table 2: Key Tools and Platforms for scFM Preprocessing
| Item / Tool | Function in the Preprocessing Pipeline |
|---|---|
| 10X Genomics Chromium | A widely used droplet-based platform for generating single-cell gene expression data. It incorporates cell barcodes and UMIs for accurate molecule counting [14]. |
| Spike-in RNAs (e.g., ERCC) | Exogenous RNA controls added to the sample before library prep. They create a standard curve to help distinguish technical noise from biological variation and are used by some normalization methods (e.g., BASiCS) [14] [15]. |
| Unique Molecular Identifiers (UMIs) | Random nucleotide sequences added during reverse transcription. UMIs allow bioinformatics tools to count individual mRNA molecules and correct for PCR amplification biases [14]. |
| CZ CELLxGENE | A platform providing unified access to millions of curated and annotated single-cell datasets, which is crucial for assembling the large, diverse pretraining corpora needed for scFMs [1]. |
| Seurat / Scanpy | Popular software toolkits for single-cell analysis. They provide built-in functions for common normalization methods (e.g., NormalizeData in Seurat) and subsequent steps like clustering and visualization [15]. |
| SentencePiece | A language-agnostic tokenization tool that can be applied to DNA or protein sequences, as it processes raw data without pre-defined boundaries, making it suitable for biological data [17]. |
For researchers in drug discovery and development, the generalizability of a machine learning model—its ability to perform accurately on new, unseen data—is a critical determinant of its real-world utility. A model that excels on its training data but fails in a different clinical context or with a new patient population offers little value. The foundation of model generalizability is not the algorithm itself, but the quality of the data it learns from. This technical support center outlines how a robust data preprocessing pipeline is the direct, non-negotiable link between raw, imperfect data and a generalizable model, particularly within the high-stakes context of single-chain Fragment variable (scFv) research and foundation model training.
Frequently Asked Questions (FAQs)
1. Why is data preprocessing considered so critical for model generalizability in scientific research? Data preprocessing is crucial because real-world data is messy, inconsistent, and often incomplete. Statistical models and machine learning algorithms are mathematical constructs that assume clean, well-structured input. Feeding them raw data leads to the "garbage in, garbage out" phenomenon, where the model learns spurious patterns or noise instead of the true underlying biological signal. Preprocessing directly addresses this by resolving data quality issues, thereby enabling the model to learn robust, generalizable patterns rather than artifacts of a specific, messy dataset [18]. In regulated environments, the FDA's 2025 draft guidance emphasizes data quality and representativeness as foundational for establishing model credibility for a specific Context of Use (COU) [19].
2. What are the most common data quality issues that preprocessing must address? The most frequent challenges researchers encounter are detailed in the table below.
Table: Common Data Quality Issues and Their Impacts
| Data Issue | Description | Potential Impact on Model |
|---|---|---|
| Missing Values | Absent data points in a collection, common in experimental data. | Can lead to biased estimates, reduced statistical power, and errors if not handled properly [20] [18]. |
| Outliers | Data points that deviate significantly from other observations. | Can skew model training, leading to inaccurate representations of data trends [20]. |
| Data Imbalance | Unequal representation of different conditions or classes in the dataset. | Can cause fairness problems, where a model has high accuracy for majority conditions but poor performance for minority conditions [21]. |
| Inconsistent Scales | Features or variables measured on different numerical scales (e.g., age vs. salary). | Can cause algorithms that rely on distance calculations to be dominated by the feature with the largest scale [18]. |
| Non-Numerical Data | Categorical or text data that most algorithms cannot process directly. | Prevents model training, as algorithms typically require numerical input [18]. |
3. How does the "Context of Use" (COU) influence preprocessing decisions? The FDA's 2025 guidance stresses that AI/ML models must be built and validated for a precise Context of Use (COU)—the specific regulatory question the model informs [19]. The COU dictates every preprocessing choice. For instance:
- If the COU involves predicting drug efficacy across global populations, your preprocessing must include rigorous checks for dataset representativeness and bias mitigation across demographics [19].
- If the COU is for a diagnostic model, handling missing values from certain lab equipment or normalizing data from different sources becomes a critical preprocessing step to ensure consistent performance [20]. The COU defines what "high quality" means for your specific model.
4. What is the difference between data preprocessing and data augmentation? Data preprocessing is applied to the entire dataset (training, validation, and test sets) to make the data usable and improve quality. Its goal is to clean and prepare the base data. In contrast, data augmentation is a technique applied only to the training set to artificially increase its size and diversity by creating slightly modified copies of existing data [22]. This is common in image data (e.g., rotations, contrast changes) to improve model robustness, but it is a distinct step from core preprocessing tasks like handling missing values.
Troubleshooting Guides
Issue: Model Performs Well in Training but Fails on New Experimental Data
Problem Description: Your model achieved high accuracy during training and validation on your initial dataset but shows significantly degraded performance when applied to new data from a different experiment, patient cohort, or laboratory.
Potential Causes & Solutions:
Cause: Data Drift and Non-Representative Training Data The training data was not representative of the real-world data the model encounters later. This is a fundamental failure of generalizability.
- Solution: Implement rigorous data provenance and representativeness analysis during preprocessing.
- Action: Before training, document the source and demographics of your training data. Use preprocessing steps to analyze feature distributions. If possible, incorporate diverse data sources from the start to create a more heterogeneous and representative training set [19].
- Preprocessing Technique: As part of your preprocessing pipeline, use tools to compare the distributions of key features between your training set and new, incoming data to detect "drift" [19].
- Solution: Implement rigorous data provenance and representativeness analysis during preprocessing.
Cause: Inconsistent Preprocessing Between Training and Inference Pipelines The data preprocessing steps applied to your training data were not identically applied to the new, incoming data.
- Solution: Standardize and version-control your preprocessing pipeline.
- Action: Package your preprocessing steps (imputation values, scaling parameters, encoding schemas) into a reusable pipeline or function. This ensures that every dataset fed to the model is transformed in exactly the same way [18]. Use data versioning tools (like lakeFS) to create immutable snapshots of both your raw data and the preprocessing code that acted upon it [18].
- Solution: Standardize and version-control your preprocessing pipeline.
Issue: Algorithm Fails to Converge or Training is Unstable
Problem Description: During the model training process, the algorithm's error does not consistently decrease, or the process is highly unstable.
Potential Causes & Solutions:
Cause: Improper Feature Scaling Many machine learning algorithms (e.g., SVMs, neural networks) are sensitive to the scale of input features. If features are on dramatically different scales, the model may struggle to converge.
- Solution: Apply feature scaling during preprocessing.
- Action: Normalize or standardize your numerical features. The choice of scaler depends on your data.
- Experimental Protocol:
- Step 1: Split your data into training and test sets. Do not fit scalers on the entire dataset to avoid data leakage.
- Step 2: Fit the chosen scaler (e.g.,
StandardScalerfor Standardization,MinMaxScalerfor Normalization) on the training set only. - Step 3: Transform both the training and test sets using the parameters learned from the training set.
- Preprocessing Technique: The table below compares common scaling methods.
- Solution: Apply feature scaling during preprocessing.
Table: Common Feature Scaling Techniques
| Scaling Approach | Description | Best For |
|---|---|---|
| Standard Scaler | Centers data to have a mean of 0 and a standard deviation of 1. | Data that is roughly normally distributed [18]. |
| Min-Max Scaler | Scales data to a fixed range, often [0, 1]. | Data that does not follow a normal distribution and where bounds are known [18]. |
| Robust Scaler | Scales using the interquartile range (IQR). It is robust to outliers. | Data containing significant outliers [18]. |
Cause: Presence of Outliers or Noisy Data Extreme values can dominate the model's loss function and prevent it from learning the central trends in the data.
- Solution: Identify and handle outliers during data cleaning.
- Action: Use statistical methods (e.g., IQR method, Z-scores) or visualization (e.g., box plots) to detect outliers.
- Preprocessing Technique: Decide whether to remove, cap, or transform outliers based on their presumed cause. If they are measurement errors, removal may be appropriate. If they are genuine but extreme biological responses, capping or using a Robust Scaler might be better [20].
- Solution: Identify and handle outliers during data cleaning.
The Data Preprocessing Workflow for Generalizable Models
The following diagram illustrates a robust, iterative preprocessing workflow that directly targets model generalizability, incorporating best practices from the cited literature.
Data Preprocessing Workflow for Generalizability
Workflow Stages:
- Data Audit & COU Definition: This is the foundational step. Precisely define the model's Context of Use and perform an initial audit of data sources, lineage, and representativeness against this COU [19].
- Data Cleaning: Address the common issues outlined in the troubleshooting guides: handle missing values (through imputation or removal), identify and treat outliers, and remove duplicate records [20] [18].
- Feature Engineering: Transform the data into a format suitable for modeling. This includes encoding categorical variables into numerical form, creating new features from existing ones, and scaling features to a uniform range [18].
- Data Splitting: Split the cleaned and engineered dataset into training, validation, and test sets. The test set must be held out and never used during training or preprocessing parameter tuning to provide an unbiased estimate of generalizability [18].
- Create Preprocessing Pipeline: Bundle all cleaning and transformation steps from steps 2 and 3 into a single, reusable pipeline. This ensures identical processing for training and future data, which is critical for generalizability [18].
- Train Model & Evaluate Generalizability: Train the model on the preprocessed training data and use the untouched test set for the final evaluation. Use the validation set for hyperparameter tuning. Monitor for performance drops that indicate overfitting or poor generalizability.
The Scientist's Toolkit: Research Reagent Solutions
Table: Essential Components for scFv Research and Development
| Research Reagent | Function/Description |
|---|---|
| Single-chain Fragment variable (scFv) | The core recombinant antibody unit; a ~25 kDa polypeptide containing variable light (VL) and heavy (VH) chains connected by a flexible linker, serving as the primary antigen-binding element [23]. |
| Flexible Linker Peptide | A 15-20 amino acid peptide (often rich in glycine and serine) that connects the VL and VH domains, enabling proper folding and formation of the antigen-binding site [23]. |
| Phage Display Library | A key in vitro selection tool; a pooled library of scFvs displayed on bacteriophages used to screen for and select high-affinity binders without animal immunization [23]. |
| Bacterial Expression System | A standard, cost-effective system (e.g., E. coli) for producing scFvs. Requires strategies like periplasmic targeting or redox mutant strains for proper disulfide bond formation and solubility [23]. |
| Constant Domain Scaffold Vector | A plasmid vector used to convert a selected scFv back into a full-length monoclonal antibody by inserting the scFv's variable domains into the scaffold [23]. |
| Chimeric Antigen Receptor (CAR) Vector | A genetic construct that fuses an scFv (for antigen recognition) to T-cell receptor signaling domains, used to create CAR-T cells for immunotherapy [23]. |
From Theory to Practice: A Step-by-Step Guide to scFM Data Preprocessing
Frequently Asked Questions (FAQs)
FAQ 1: What is tokenization in the context of single-cell genomics, and why is it a critical step? Tokenization is the process of converting raw, unstructured data into discrete units called "tokens" that a model can process. For single-cell data, this typically involves defining genes or genomic features as the fundamental tokens, and the combination of these tokens represents a single cell, analogous to words forming a sentence [1]. This step is critical because it standardizes the biological data into a structured format that deep learning architectures, particularly transformers, can understand and learn from. The chosen tokenization strategy directly impacts the model's ability to capture biological patterns, its scalability, and its performance on downstream tasks [24].
FAQ 2: My model is struggling with the non-sequential nature of gene expression data. What are the common strategies to impose an order? Unlike words in a sentence, genes in a cell have no inherent sequence. To apply sequence-based models like transformers, researchers use deterministic strategies to create an order. Common methods include:
- Ranking by Expression: Sorting genes within each cell by their expression levels (from highest to lowest) and using the ordered list of top genes as the input sequence [1] [2].
- Expression Binning: Partitioning genes into bins based on their expression values and using these bins to determine their position in the sequence [1].
- Fixed Gene Order: Some models forgo complex ranking and simply use a fixed, pre-defined order for all genes, relying on normalized counts [1].
FAQ 3: During fine-tuning, my model performs well on some tasks but fails on others that require broader sequence context. What could be the issue? This is a known challenge. Some tokenization strategies, particularly those using overlapping k-mers, may lead the model to learn the identity of individual tokens very well but struggle to capture larger sequence context [25]. If your fine-tuning task relies heavily on long-range dependencies within the data (e.g., understanding regulatory networks across the genome), the foundation model's tokenization might be a bottleneck. It is recommended to use benchmarking tasks that are independent of specific biology to evaluate the model's ability to learn sequence context, such as next-token prediction without overlaps [25].
FAQ 4: How can I enrich my token inputs to provide more biological context to the model? Beyond the raw gene identifier and expression value, you can incorporate additional biological metadata as special tokens or within the token embedding. This can include:
- Cell-level context tokens representing the cell's identity or metadata [1].
- Modality indicators for multi-omics models (e.g., scRNA-seq vs. scATAC-seq) [1].
- Gene metadata such as Gene Ontology terms or chromosomal location [1].
- Batch information to help the model account for technical variations [1].
Troubleshooting Guides
Problem 1: Poor Model Generalization Across Different Datasets
Symptoms: The model performs well on the training data or data from similar batches but shows significantly degraded performance on new datasets with different technical characteristics.
Possible Causes and Solutions:
- Cause: High sensitivity to batch effects.
- Solution: Incorporate batch information directly into the tokenization process using special batch tokens [1]. This allows the model to explicitly learn and adjust for technical variations.
- Cause: Inadequate data diversity during pre-training.
- Solution: Ensure your pre-training corpus is assembled from high-quality, diverse datasets that span multiple biological conditions, tissues, and species. Leverage curated public archives like CZ CELLxGENE, the Human Cell Atlas, and GEO to maximize biological variation [1].
- Cause: Overfitting to the token sequence rather than learning biological context.
- Solution: Consider using a tokenization strategy that encourages learning of broader context. Interrogate your model's learning through tasks like non-overlapping next-token prediction to diagnose an over-reliance on token identity [25].
Problem 2: Inefficient Training or Out-of-Memory Errors
Symptoms: Training is prohibitively slow, or the process fails due to insufficient GPU memory, especially with long gene sequences.
Possible Causes and Solutions:
- Cause: Overly long input sequences due to a large number of genes.
- Cause: Suboptimal tokenization strategy creating excessive tokens.
- Solution: Evaluate different tokenization methods. While treating every gene as a token is common, other strategies like non-overlapping k-mers or Byte Pair Encoding (BPE) can be more computationally efficient for certain architectures [24].
- Cause: Standard transformer self-attention mechanism has high computational complexity.
- Solution: Explore more efficient model architectures like HyenaDNA or Mamba, which are designed to handle very long sequences (up to 1 million tokens) more efficiently than standard transformers [24].
Problem 3: Low Interpretability of Model Results
Symptoms: The model makes accurate predictions, but it is difficult to understand which genes or features drove the decision, limiting biological insight.
Possible Causes and Solutions:
- Cause: The "black box" nature of deep learning models, particularly transformers.
- Solution: Leverage the model's attention mechanisms. Analyze the attention weights to identify which genes the model "attended to" most strongly when making a prediction. This can reveal important gene-gene relationships [1].
- Cause: Token embeddings are not biologically meaningful.
- Solution: Extract and analyze the contextualized token embeddings. Techniques like Principal Component Analysis (PCA) can be used to assess whether the embeddings capture biological structure, such as grouping genes with similar functions [25].
Experimental Protocols & Methodologies
Protocol 1: Implementing Gene-Ranking Tokenization for scRNA-seq Data
This is a common method for preparing single-cell RNA sequencing data for transformer models.
- Input: A raw count matrix (cells x genes).
- Quality Control: Filter out low-quality cells and genes with low expression across the dataset.
- Normalization: Normalize the count data (e.g., using log(CP10K+1)) to account for differences in sequencing depth.
- Gene Selection: Select the top 2,000-4,000 highly variable genes. Alternatively, for a per-cell approach, use all genes that are expressed in that cell.
- Ranking: For each individual cell, rank all selected genes by their normalized expression value from highest to lowest.
- Sequencing: Create the input sequence for the cell by using the ordered list of gene identifiers. The sequence length can be truncated to a fixed number (e.g., the top 1,000 genes) for uniformity [1] [2].
- Embedding: Each gene ID in the sequence is converted into a trainable embedding vector. The expression value can be incorporated as a separate value or integrated into the embedding.
Protocol 2: Benchmarking Sequence Context Learning with Non-Overlapping Next-Token Prediction
This protocol provides a task-agnostic method to evaluate how well a foundation model learns sequence context beyond simple token identity [25].
- Model Selection: Choose a pre-trained DNA or single-cell foundation model to evaluate.
- Task Formulation: Fine-tune the selected model to predict the next k-mer in a sequence, where the k-mer does not overlap with the input context tokens.
- For example, given a sequence window, mask the next 3 nucleotides (a non-overlapping 3-mer) and train the model to predict it.
- Dataset: Prepare a held-out genomic or single-cell sequence dataset not seen during pre-training.
- Fine-tuning: Fine-tune the model on this next-token prediction task.
- Evaluation: Measure the prediction accuracy on a test set. A model that has learned meaningful sequence context will achieve accuracy significantly higher than random chance (e.g., >0.25 for a 4-mer, compared to a random baseline of 0.004). Poor performance indicates the model may be over-reliant on token identity and struggles with broader context [25].
Data Presentation
Table 1: Comparison of Common Tokenization Techniques in Genomics
| Tokenization Method | Description | Advantages | Disadvantages | Example Models |
|---|---|---|---|---|
| One-Hot Encoding | Each nucleotide (A,C,G,T) is represented as a binary vector. | Simple, interpretable, no information loss. | Results in very long, sparse sequences; does not scale well to long sequences. | DeepBind, Basset, Enformer [24] |
| Non-overlapping k-mers | Sequence is broken into consecutive, non-overlapping blocks of k nucleotides. |
Reduces sequence length, can capture short motifs. | May break up biologically meaningful motifs that span across tokens. | Nucleotide Transformer [24] |
| Overlapping k-mers | Sequence is broken into blocks of k nucleotides that slide one nucleotide at a time. |
Preserves local context and mitigates motif splitting. | Creates a larger number of tokens, increasing computational cost; may limit learning of long-range context [25]. | DNABERT [24] [25] |
| Byte Pair Encoding (BPE) | A data compression algorithm adapted to find the most frequent "words" in a sequence. | Data-driven; can learn meaningful, recurring biological motifs. | Can be computationally intensive to train; learned tokens may not be biologically interpretable. | DNABERT-2 [24] |
| Gene-based Tokenization | Each gene or genomic feature is treated as a unique token. | Directly models gene-level interactions, ideal for scRNA-seq. | Requires imposing an artificial order on genes; loses nucleotide-level resolution. | scGPT, Geneformer [1] [2] |
Table 2: Essential Research Reagent Solutions for scFM Development
| Item | Function in the Pipeline |
|---|---|
| Curated Single-Cell Atlases (e.g., CZ CELLxGENE, Human Cell Atlas) | Provide large-scale, diverse, and often annotated datasets essential for pre-training robust foundation models [1]. |
| Unified Data Frameworks (e.g., BioLLM) | Offer standardized APIs and documentation to integrate, apply, and benchmark different scFMs, streamlining research and ensuring consistent evaluation [2]. |
| Deep Learning Libraries (e.g., PyTorch, TensorFlow) | Provide the core programming environment and tools for building, training, and fine-tuning complex model architectures like transformers [26]. |
| High-Performance Computing (HPC) Resources (GPUs/TPUs) | Necessary to handle the immense computational and memory demands of training and running large-scale foundation models on massive datasets [26]. |
Workflow Visualizations
Tokenization Workflow for scFMs
Troubleshooting Poor Generalization
Frequently Asked Questions
FAQ 1: Why do I get different gene lists when using different ranking criteria (like p-value vs. fold-change)?
Different criteria measure distinct aspects of differential expression. The p-value assesses the statistical significance of an observed difference, considering both the effect size and its variability. In contrast, the fold-change measures the magnitude of the difference in expression levels between conditions without accounting for variance. A gene with a small fold-change can have a very small p-value if its standard deviation is tiny, and a gene with a large fold-change can have a large p-value if its variance is high. These fundamental differences often lead to incompatible gene lists [27].
FAQ 2: What can I do if my gene ranking is unstable due to noisy data or small sample sizes?
Unstable rankings, where the estimated effect sizes or their standard deviations are noisy, are common with small or moderate sample sizes (e.g., less than 20 per group). To address this, consider using a hierarchical model that shares information across genes. This approach can stabilize estimates of variance and effect size, leading to more reliable and powerful rankings. For large datasets (e.g., over 10,000 genes), this is still practical using modern optimization techniques [28].
FAQ 3: How should I choose a color scale for visualizing my gene expression data?
The choice of color scale is critical for honest and effective communication. Follow these key principles:
- Use Perceptually Uniform Color Spaces: Employ color spaces like CIE Luv or CIE Lab, where a unit change in color corresponds to a uniform change in human perception [29].
- Map High Values to Darker Colors: For typical gene expression data with many zeros and a long tail of high values, map low expression to light colors and high expression to dark colors. This prevents the few high-expression data points from being visually washed out by the many low-expression points [30].
- Ensure Accessibility: Test your color scales for color deficiencies (e.g., Deuteranopia, Protanopia). Avoid red-green schemes and use tools to simulate how your visuals will appear [29] [31].
FAQ 4: My experiment has multiple factors (e.g., treatment and time). How can I create a single gene list that accounts for both?
Instead of generating separate gene lists for each factor, you can use multi-criteria layer ranking algorithms. Methods like point-admissible, line-admissible (convex), and Pareto ranking allow you to combine rankings from different statistical tests (e.g., for treatment effect and time effect) into a single, unified preference list. This helps prioritize genes that respond to multiple experimental factors simultaneously [27].
FAQ 5: Beyond simple ranking, how can I frame the problem of selecting genes for follow-up experiments?
Shift the framework from a binary "effect yes/no" decision (common with False Discovery Rate) to a ranking under cost constraints. Since follow-up experiments are resource-intensive, the goal is to prioritize genes where you have high confidence that something interesting is happening. One practical approach is to define a minimum biologically interesting effect size and then rank genes by their posterior probability of having an effect larger than this threshold [28].
Troubleshooting Guides
Issue 1: Low Power and High False Discovery Rate in Ranking
Problem: Your differential expression analysis fails to detect known true positives (low power) or selects many false positives (high FDR), especially when detecting small fold-changes.
Solution: For experiments with small or moderate sample sizes, a two-dimensional convex layer ranking that jointly considers both p-value and fold-change can outperform standard p-value ranking. This method has been shown to achieve generally lower FDR and higher power under these conditions [27].
Experimental Protocol: Implementing Layer Ranking
- Compute Univariate Rankings: For your dataset, calculate the fold-change (FC) and p-value (P-val) for each gene between two conditions.
- Apply a Layer Ranking Algorithm:
- Point-Admissible Ranking: Identifies genes that are top-ranked by at least one individual criterion.
- Convex (Line-Admissible) Ranking: Ranks genes based on their performance on a convex line combining the multiple criteria (e.g., p-value and fold-change).
- Pareto Ranking: Identifies genes that are non-dominated, meaning no other gene is better on all criteria.
- Generate a Unified List: The layer ranking algorithm provides a single, preference-ordered gene list that balances the multiple criteria [27].
The workflow below illustrates the process of creating a unified gene list from multiple ranking criteria.
Issue 2: Unstable Gene Ranking from Noisy Estimates
Problem: Rankings based on metrics like mean(case_vs_control) / sd(case_vs_control) are unstable because the standard deviation (sd) can be noisy, especially for low-expression genes.
Solution: Implement a hierarchical (multilevel) model that partially pools variance estimates across genes. This shrinkage produces more stable estimates of variability, leading to more reliable rankings. This Bayesian approach is feasible even for large-scale genomic data (e.g., >10k genes) using optimizers or approximate inference methods [28].
Experimental Protocol: Hierarchical Modeling for Stable Ranking
- Model Specification: Define a model where gene expression counts (e.g., for RNA-seq) are modeled with an appropriate likelihood (e.g., Negative Binomial). Place hierarchical priors on gene-specific parameters like log-fold-changes and dispersions.
- Incorporate Trends: A common domain-specific tweak is to model the trended relationship between a gene's mean expression and its dispersion.
- Model Fitting: Use statistical software (e.g.,
rstanarmin R) capable of fitting hierarchical models. For very large datasets, use an optimizer to find the posterior mode, or tools like ADVI or Pathfinder for faster approximation. - Extract Rankings: Rank genes based on the shrunken posterior estimates of the log-fold-change or by the posterior probability that the fold-change exceeds a meaningful threshold [28].
The following workflow contrasts the standard approach with the more stable hierarchical modeling method.
Data Presentation and Visualization
Table 1: Comparison of Gene Ranking Criteria and Their Properties
| Ranking Criterion | What It Measures | Advantages | Disadvantages | Best For |
|---|---|---|---|---|
| Fold-Change (FC) | Magnitude of expression difference between two conditions [27] | Intuitive; easy to compute and interpret | Does not account for variability; genes with high variance can show large FC by chance [27] | Initial, quick screening of large effect sizes |
| P-value | Statistical significance of the observed difference (combining effect size and variance) [27] | Accounts for within-gene variability; well-established inference framework | Can select genes with very small, biologically irrelevant fold-changes if variance is tiny [27] | Identifying statistically significant changes when effect size variability is a key concern |
| Frequency of Selection (e.g., by SVM-RFE) | How often a gene is selected as a predictive feature during cross-validation [27] | Directly tied to predictive power for sample classification; robust against overfitting | Computationally intensive; may not select biologically relevant but weakly predictive genes | Building robust classifiers for phenotype prediction |
| Bayes Factor | Evidence for a model including a condition effect vs. a model without it [28] | Provides a continuous measure of evidence; allows for direct probability statements | Highly sensitive to the choice of prior distribution; can be computationally challenging [28] | Comparing well-specified models where prior information is available and justified |
| Posterior Probability of Effect | Probability that the absolute fold-change exceeds a pre-specified, biologically relevant threshold [28] | Directly addresses the question of practical significance; intuitive interpretation | Requires defining a meaningful effect size threshold | Prioritizing genes for follow-up studies where cost constraints are known |
The Scientist's Toolkit: Essential Research Reagents and Solutions
Table 2: Key Computational Tools and Their Functions in Gene Ranking Analysis
| Tool / Resource | Function / Role | Explanation |
|---|---|---|
| DESeq2 / edgeR | Differential Expression Analysis [28] | Industry-standard software packages for identifying differentially expressed genes from RNA-seq data. They use statistical models to test for significance and can provide shrunken estimates of fold-changes. |
| rstanarm | Bayesian Hierarchical Modeling [28] | An R package that provides an interface to the Stan probabilistic programming language. It allows fitting hierarchical models for genomic data to achieve more stable rankings. |
| HCL Wizard | Perceptually Uniform Color Scheme Generation [31] | An online tool for creating color scales in the Hue-Chroma-Luminance (HCL) color space, which is perceptually uniform. Essential for generating accessible and honest visualizations of gene expression. |
| PertEval-scFM | Benchmarking Framework for Single-Cell Foundation Models [32] | A standardized framework for evaluating how well single-cell foundation model (scFM) embeddings perform on tasks like perturbation effect prediction, providing a benchmark for model performance. |
| Layer Ranking Algorithms (Point-Admissible, Convex, Pareto) | Multi-Criteria Decision Making [27] | A class of algorithms designed to merge multiple ranked gene lists (e.g., from p-value, fold-change, etc.) into a single, unified preference list that balances all criteria. |
| Color Blindness Simulator (Coblis) | Accessibility Checking [31] | A tool to simulate how your chosen color scales will appear to individuals with various types of color vision deficiencies (e.g., Protanopia, Deuteranopia), ensuring your visuals are inclusive. |
Frequently Asked Questions
Q1: What is the primary purpose of tokenization in a single-cell Foundation Model (scFM)?
- A: Tokenization converts raw, unstructured omics data into a structured sequence of discrete units (tokens) that the model can understand and process. It standardizes diverse data types, like gene expression counts or chromatin accessibility peaks, into a common format, enabling the transformer architecture to learn the complex relationships between genes, cells, and modalities [1].
Q2: My data comes from different technologies (e.g., scRNA-seq and scATAC-seq). How can I represent them in a single model?
- A: You can incorporate special modality tokens at the beginning of each cell's sequence to indicate the data source (e.g.,
[RNA]or[ATAC]). This allows the model to learn both modality-specific and shared patterns across your datasets [1]. For example, the input sequence for a cell could be:[RNA] [CELL_ID] Gene_A Gene_B ...
- A: You can incorporate special modality tokens at the beginning of each cell's sequence to indicate the data source (e.g.,
Q3: How should I handle critical metadata, such as sample batch, donor, or treatment, in the tokenization process?
- A: Metadata can be added as special tokens to provide rich context. For instance, you can prepend a
[BATCH_1]or[TREATED]token to a cell's sequence. This helps the model condition its predictions on this information and can significantly aid in learning batch-invariant biological representations [1].
- A: Metadata can be added as special tokens to provide rich context. For instance, you can prepend a
Q4: Is there a standard way to order genes or features before tokenization?
- A: No, this is an active area of development. Since omics data has no inherent sequence, common strategies include ranking genes by their expression level within each cell, binning genes by expression values, or simply using a fixed, pre-defined order (e.g., alphabetical by gene symbol). Some models report robustness across different ordering schemes [1].
Q5: What are the consequences of poor tokenization on my scFM's performance?
- A: Ineffective tokenization can introduce noise and bias, leading to several downstream issues:
- Poor Generalization: The model may fail to perform well on new, unseen datasets.
- Failure to Integrate: The model might be unable to harmonize data from different modalities or batches.
- Reduced Interpretability: The latent representations learned by the model may not correspond to clear biological concepts [1] [33].
- A: Ineffective tokenization can introduce noise and bias, leading to several downstream issues:
Troubleshooting Guide
| Problem | Potential Cause | Solution |
|---|---|---|
| Poor cross-dataset performance | Inconsistent tokenization between pretraining and fine-tuning datasets; high batch effect. | Standardize gene identifier nomenclature (e.g., all ENSEMBL IDs). Incorporate batch information as a metadata token and use techniques like strategic data sourcing to ensure training data diversity [1]. |
| Model fails to distinguish data types | Missing or incorrect modality tokens for multi-omics data. | Explicitly prepend a modality-specific token (e.g., [ATAC], [PROTEIN]) to the input sequence of every cell. Verify that these tokens are correctly parsed during data loading [1]. |
| Training is unstable or slow | Highly variable sequence lengths due to a large number of features per cell. | Implement a consistent feature selection strategy. For example, use the top N highly variable genes or filter features by minimum expression. This creates uniform input dimensions and improves training efficiency [1]. |
| Model ignores metadata context | Metadata tokens are not properly leveraged during the self-supervised pretraining task. | Use a pretraining objective that forces the model to use metadata. Instead of only predicting masked genes, add a secondary task to classify or reconstruct the metadata token itself [1]. |
| Inability to reproduce published benchmarks | Differences in the tokenization pipeline (e.g., gene ordering, normalization, missing value handling). | Meticulously replicate the tokenization method described in the original paper. If details are missing, check for publicly released code. Consider using a unified platform like BioLLM or scGPT for a standardized starting point [33]. |
Experimental Protocols for Tokenization
Protocol 1: Basic Tokenization for scRNA-seq Data
This protocol outlines the steps to convert a single-cell RNA-seq count matrix into token sequences suitable for a transformer model.
- Input: A cell-by-gene count matrix.
- Quality Control & Filtering: Filter out low-quality cells (based on metrics like UMI counts, mitochondrial gene percentage) and genes not expressed in a sufficient number of cells.
- Normalization: Normalize the count data (e.g., using log1p transformation after library size normalization) to account for varying sequencing depths.
- Feature Selection: Select the top N highly variable genes to focus the model on the most informative features and reduce computational load.
- Gene Ordering: For each cell, create a sequence by ordering the selected genes based on a deterministic rule. A common method is to rank genes by their normalized expression value in descending order for that specific cell.
- Token Creation:
- Each gene in the sequence is represented as a token. The token can combine the gene's identifier (e.g.,
ENSG00000139618) and its normalized value, or the value can be added as a separate input embedding. - Prepend a special
[CLS]token to the sequence. The final hidden state corresponding to this token is often used as the aggregate representation for the entire cell [1].
- Each gene in the sequence is represented as a token. The token can combine the gene's identifier (e.g.,
Protocol 2: Advanced Tokenization for Multi-Modal Data
This protocol extends Protocol 1 to incorporate data from multiple omics layers.
- Input: Multiple cell-by-feature matrices (e.g., from scRNA-seq, scATAC-seq, and protein abundance).
- Modality-Specific Preprocessing: Independently preprocess each modality using appropriate methods (e.g., term frequency-inverse document frequency (TF-IDF) for scATAC-seq data).
- Feature Selection per Modality: Perform feature selection within each modality (e.g., highly variable genes for RNA, top accessible peaks for ATAC).
- Token Sequence Construction:
- For each cell, create a separate sequence for each modality.
- At the start of each modality's sequence, prepend a special modality token (e.g.,
[RNA],[ATAC],[ADT]). - Optionally, prepend a global metadata token for information like
[BATCH_A]or[DONOR_1]. - The final input sequence for a cell is constructed by concatenating these sequences. For example:
[BATCH_A] [RNA] Gene_XYZ Gene_ABC ... [ATAC] Peak_123 Peak_456 ...[1] [33].
- Positional Encoding: Apply standard transformer positional encodings to the entire concatenated sequence to inform the model about the order of tokens.
The following diagram illustrates this multi-modal tokenization workflow.
Quantitative Data on Tokenization and Model Performance
The table below summarizes key metrics from recent studies that highlight the impact of data scale and tokenization strategies on scFM performance.
Table 1: Impact of Training Scale and Tokenization on Model Performance
| Model / Study | Pretraining Corpus Size | Key Tokenization Strategy | Reported Outcome / Accuracy |
|---|---|---|---|
| scGPT [33] | 33 million cells | Ranking genes by expression; use of special tokens for cell identity. | Exceptional cross-task generalization; enabled zero-shot cell type annotation and perturbation prediction. |
| Nicheformer [33] | 110 million cells | Not explicitly detailed, but uses graph transformers for spatial data. | Set record for processed dataset size; robust zero-shot capabilities in novel biological contexts. |
| scPlantFormer [33] | Not specified | Integration of phylogenetic constraints into the attention mechanism. | 92% cross-species cell annotation accuracy in plant systems. |
| General Finding [1] | Tens of millions of cells (across public archives) | Use of a dedicated cell-level token. | The final hidden state of this token serves as a powerful, aggregated representation for the entire cell. |
Table 2: Key Computational Tools for scFM Tokenization and Training
| Item / Resource | Function in the Tokenization & Training Pipeline |
|---|---|
| CZ CELLxGENE Discover [1] [33] | Provides unified access to tens of millions of curated, annotated single-cells; essential for sourcing diverse pretraining data. |
| scGPT / BioLLM [33] | Offers open-source frameworks and universal interfaces for benchmarking scFMs, providing reference implementations for tokenization. |
| Transformer Architecture [1] | The core neural network backbone that processes token sequences using self-attention to model relationships between all tokens. |
| Hugging Face Ecosystem [33] | A model-sharing platform; the review notes a need for a similar, sustainable infrastructure for sharing and versioning scFMs. |
| Standardized Gene Identifiers (e.g., ENSEMBL) | Crucial for aligning features across different datasets during the tokenization process to ensure consistent model input. |
The following diagram maps the logical relationship between data sources, tokenization steps, model training, and downstream applications, providing a high-level overview of a complete scFM pipeline.
Data Integration and Batch Correction Techniques for Diverse Datasets
Frequently Asked Questions (FAQs)
Q1: What is the primary goal of data integration in single-cell analysis for foundation model training?
The primary goal is to combine data from diverse sources, such as different experiments, technologies, or batches, into a unified and standardized format. This process is crucial for creating a high-quality training corpus for single-cell foundation models (scFMs), allowing them to learn universal biological patterns rather than dataset-specific technical artifacts. Effective integration mitigates batch effects—systematic non-biological variations that can compromise data reliability and obscure genuine biological signals [34] [35].
Q2: Why are batch effects particularly problematic for scRNA-seq data, and how can I detect them?
Batch effects are problematic because they can be on a similar scale, or even larger, than the biological differences of interest, severely reducing the statistical power to detect truly differentially expressed genes [36]. You can detect them through visualization techniques like UMAP plots; if cells cluster strongly by batch (e.g., by sequencing run or laboratory) rather than by biological cell type or condition, it indicates a significant batch effect that requires correction [37].
Q3: My scFM is performing poorly on a downstream task like cell type annotation. Could data preprocessing be the issue?
Yes, data preprocessing is a likely culprit. The performance of scFMs is highly dependent on the quality and consistency of the input data. Key issues to investigate include:
- Inadequate Batch Correction: Persistent batch effects can confuse the model. Consider using a more robust correction method like ComBat-ref, which has been shown to improve sensitivity in differential expression analysis [36].
- Inconsistent Tokenization: scFMs require genes to be represented as tokens. If your preprocessing pipeline uses a different gene ranking or normalization strategy than what the model was pretrained on, it can lead to suboptimal performance [35].
- Low Data Quality: High levels of ambient RNA or mitochondrial reads in your training data can obscure biological signals. Rigorous quality control is essential [34] [37].
Q4: When should I use a complex scFM versus a simpler baseline model for my analysis?
The choice depends on your specific task, dataset, and resources. Benchmarking studies reveal that:
- scFMs are robust and versatile tools for diverse applications, especially when you need to leverage knowledge learned from massive datasets. They excel in zero-shot learning and can be efficiently adapted with fine-tuning [34] [2].
- Simpler machine learning models (e.g., Seurat, Harmony, scVI) can be more adept at efficiently adapting to specific, smaller datasets, particularly under computational resource constraints [34]. Notably, no single scFM consistently outperforms others across all tasks, so selection should be tailored based on factors like dataset size and task complexity [34].
Troubleshooting Guides
Issue 1: Poor Data Integration After Applying Batch Correction
Symptoms:
- Cells in UMAP or t-SNE plots still cluster strongly by batch after correction.
- Poor mixing of cells from different datasets in the latent space of your scFM.
- Low accuracy in cross-dataset cell type annotation.
Diagnosis and Solutions:
Check Data Quality and Normalization:
- Ensure that all datasets have undergone rigorous quality control (removing low-quality cells, doublets, and ambient RNA) and consistent normalization before attempting batch correction [37].
- Confirm that the same gene annotation (e.g., Ensembl IDs) is used across all datasets.
Re-evaluate Your Batch Correction Method:
- Some methods may be better suited for your specific data. Consider trying a method that uses a reference batch. For example, ComBat-ref selects the batch with the smallest dispersion as a reference and adjusts other batches towards it, which has demonstrated high sensitivity and specificity in RNA-seq data [36].
- For complex integrations (e.g., across different tissues or species), ensure your method is designed to handle such biological variation and not just technical noise.
Assess Model Selection:
- If using an scFM for integration, consult benchmark studies to choose a model strong for your task. For instance, some scFMs like scGPT show robust performance across various tasks, while others like Geneformer excel in gene-level tasks [2]. Frameworks like BioLLM can provide a standardized way to compare different models [2].
Issue 2: scFM Fails to Capture Biologically Meaningful Representations
Symptoms:
- The model's cell embeddings do not separate known cell types.
- Attention mechanisms do not highlight genes with known biological relevance to the cell state.
- Poor performance on a knowledge-based evaluation metric like scGraph-OntoRWR, which measures the consistency of captured cell-type relationships with established biological ontologies [34].
Diagnosis and Solutions:
Verify Tokenization Strategy:
- scFMs convert gene expression data into tokens. A common challenge is that genes have no natural order. Most models impose one, such as ranking by expression level within each cell [35] [1]. Ensure your data preprocessing matches the tokenization strategy (e.g., gene ranking, value binning) used during the scFM's pretraining.
- Check if the model expects special tokens for cell metadata or batch information and include them if required [35].
Investigate Pretraining Data Mismatch:
- The scFM may not have been pretrained on data similar to yours. Check the model's documentation. If your cell type or tissue is underrepresented, consider fine-tuning the model on a relevant, high-quality dataset.
- The diversity of pretraining data is critical. Models trained on larger, more diverse atlases (e.g., from CELLxGENE) generally capture better biological representations [34] [35].
Evaluate with Biology-Driven Metrics:
- Move beyond standard accuracy metrics. Use evaluations like the Lowest Common Ancestor Distance (LCAD), which measures the ontological proximity between misclassified cell types, to ensure errors are biologically plausible [34].
- Analyze the "roughness" of the latent space; a smoother landscape often correlates with better task performance and can be a useful proxy for model selection [34].
Issue 3: High Computational Demand and Long Training Times
Symptoms:
- Fine-tuning an scFM on a new dataset takes prohibitively long.
- The model requires more GPU memory than is available.
Diagnosis and Solutions:
Optimize Input Data:
Leverage Transfer Learning Efficiently:
- For specific tasks, start with the pretrained model's embeddings and train a simpler, task-specific classifier on top, rather than fine-tuning the entire massive model.
- Explore parameter-efficient fine-tuning (PEFT) methods if supported by the model.
Consider Alternative Models:
- If resources are extremely constrained, benchmark simpler baseline models (e.g., scVI, Seurat) against scFMs for your specific task. As noted in benchmarks, simpler models can sometimes outperform scFMs on specific datasets with far less computational overhead [34].
Quantitative Data and Method Comparisons
Performance of scFMs and Baseline Methods Across Key Tasks
The following table summarizes findings from a comprehensive benchmark study evaluating six scFMs against established baseline methods. Performance is a holistic ranking based on multiple metrics [34].
| Model Category | Example Models | Batch Integration | Cell Type Annotation | Gene-Level Tasks | Clinical Task (e.g., Drug Sensitivity) | Key Strengths |
|---|---|---|---|---|---|---|
| Single-Cell Foundation Models (scFMs) | scGPT, Geneformer, scFoundation | Robust and versatile [34] | Strong in zero-shot [34] [35] | Geneformer, scFoundation excel [2] | Promising for clinical insight [34] | Captures universal biological knowledge; transferable to many tasks. |
| Generative Baseline | scVI | Effective for integration [34] | Good performance [34] | Not Specified | Not Specified | Probabilistic modeling of count data. |
| Clustering-Based Baseline | Harmony | Effective for integration [34] | Good performance [34] | Not Applicable | Not Applicable | Efficient for correcting embeddings. |
| Anchor-Based Baseline | Seurat | Effective for integration [34] | Good performance [34] | Not Applicable | Not Applicable | Widely adopted; strong community support. |
Comparison of Batch Effect Correction Methods for RNA-seq Data
This table compares the performance of various batch correction methods, based on a study that introduced ComBat-ref [36]. Performance was measured using True Positive Rate (TPR) and False Positive Rate (FPR) in detecting differentially expressed genes after correction.
| Method | Underlying Model | Key Feature | Performance with High Batch Dispersion | Preserves Count Data? |
|---|---|---|---|---|
| ComBat-ref | Negative Binomial GLM | Selects lowest-dispersion batch as reference | High TPR, controlled FPR [36] | Yes [36] |
| ComBat-seq | Negative Binomial GLM | Uses an average dispersion for adjustment | Lower TPR vs. ComBat-ref [36] | Yes [36] |
| NPMatch | Nearest-Neighbor Matching | Matches samples across batches | Good TPR, but can have high FPR (>20%) [36] | No |
| ComBat | Empirical Bayes (Gaussian) | Corrects for additive/multiplicative effects | Lower power for count data [36] | No |
| RUVSeq, SVASeq | Factor Analysis / Linear Model | Models variation from unknown sources | Varies | No |
Detailed Experimental Protocol: scRNA-seq Pharmacotranscriptomic Screen
This protocol outlines a method for generating a high-throughput, high-dimensional dataset suitable for training or evaluating scFMs on drug response tasks, as featured in a recent study [38].
Objective: To explore the heterogeneous transcriptional landscape of cancer cells (e.g., High-Grade Serous Ovarian Cancer - HGSOC) in response to a library of drugs with diverse mechanisms of action (MOAs).
Workflow Overview:
Step-by-Step Methodology:
Sample Preparation:
- Use a combination of established cancer cell lines and patient-derived cancer cells (PDCs) cultured ex vivo at early passages to preserve phenotypic identity [38].
Drug Sensitivity and Resistance Testing (DSRT) Screen:
- Treat cells in a 96-well format with a library of drugs (e.g., 45 drugs covering 13 MOAs like PI3K-AKT-mTOR inhibitors, CDK inhibitors, etc.). Include DMSO-treated wells as controls.
- Use a drug concentration above the half-maximal effective concentration (EC₅₀) to ensure a measurable transcriptional response [38].
Live-Cell Barcoding (Cell Hashing):
- After 24 hours of drug treatment, label the cells in each well with a unique pair of antibody-oligonucleotide conjugates (Hashtag Oligos, HTOs) targeting ubiquitous surface proteins (e.g., B2M and CD298). This allows cells from all 96 wells to be pooled for a single scRNA-seq run [38].
Single-Cell RNA Sequencing:
- Pool all barcoded cells and proceed with a standard scRNA-seq workflow (e.g., using a 10X Chromium platform) to generate sequencing libraries [38].
Sequence Data Pre-processing and Demultiplexing:
- Process the raw FASTQ files through a pipeline (e.g., Cell Ranger) to generate a cell-by-gene count matrix.
- Demultiplex the data based on the HTO reads to assign each cell back to its original drug treatment well [38].
Data Integration, Quality Control, and Batch Correction:
- Perform standard QC: filter out low-quality cells, doublets, and cells with high mitochondrial read fractions [37] [38].
- Integrate data from the different treatment conditions and biological models. Use a method like Harmony or Seurat to correct for technical variation and batch effects, ensuring cells cluster by biology rather than by well or sample of origin [37].
Downstream Analysis:
- Clustering and Visualization: Perform Leiden clustering and UMAP projection to visualize the transcriptomic landscape [38].
- Pathway Analysis: Use Gene Set Variation Analysis (GSVA) to evaluate the activity of biological pathways in different clusters and under different drug treatments [38].
- Model Training/Evaluation: This integrated, multi-condition dataset can now serve as a robust benchmark for evaluating an scFM's ability to discern drug mechanisms and predict response heterogeneity.
The Scientist's Toolkit: Essential Research Reagents & Materials
| Item | Function / Application |
|---|---|
| CZ CELLxGENE Platform | Provides unified access to millions of curated, annotated single-cell datasets, serving as a primary data source for pretraining scFMs [35]. |
| Anti-B2M & Anti-CD298 Antibody-Oligo Conjugates | Used for "Cell Hashing" to multiplex up to 96 samples in a single scRNA-seq run, drastically reducing costs and technical variability in drug screens [38]. |
| ComBat-ref Software | A refined batch effect correction method that uses a negative binomial model and a reference batch to significantly improve the sensitivity of differential expression analysis in integrated datasets [36]. |
| BioLLM Framework | A unified software framework that provides standardized APIs for integrating and applying diverse scFMs, simplifying model benchmarking and switching for researchers [2]. |
| FHIR (Fast Healthcare Interoperability Resources) Standards | A critical data standard for achieving semantic interoperability in healthcare, enabling the integration of clinical and omics data for more comprehensive models [39]. |
Troubleshooting Guide: Common Data Preprocessing Issues
1. Issue: Gene Identifier Mismatches During Data Integration
- Problem: You encounter errors or data loss when merging datasets from different sources (e.g., GENCODE vs. Ensembl gene annotations).
- Solution: Implement a consistent gene identifier mapping protocol. First, standardize all gene identifiers to a single system (e.g., Ensembl IDs) using a authoritative resource like the
org.Hs.eg.dbBioconductor package or mygene.info. Validate the mapping by checking for a high percentage of successfully mapped genes post-conversion. - Prevention: In your experimental protocol, document the source and version of all gene annotations used. Always confirm identifier consistency before combining datasets for scFM training.
2. Issue: Dimensionality Mismatch in Combined Feature Vectors
- Problem: The final input matrix has inconsistent dimensions, preventing model training. This often occurs when positional encodings are incorrectly concatenated with gene expression values.
- Solution: Ensure the dimensionality of your positional encoding matches the number of genes. For an N-gene expression vector, your positional encoding should also be of length N. Use debugging scripts to verify the shape of each component (gene values, identifiers, positions) before and after concatenation.
- Prevention: Adopt a modular preprocessing pipeline where the output dimensions of each step are automatically validated before proceeding to the next.
3. Issue: Loss of Positional Context in Final Representation
- Problem: The model fails to learn spatial or sequential relationships, suggesting positional information is not being effectively utilized.
- Solution: Re-evaluate your positional encoding strategy. Test different encoding methods (e.g., sinusoidal, learned, or Gaussian radial basis functions) and ensure they are added to the representation as an element-wise sum or a dedicated positional channel, rather than being lost in a fully concatenated vector.
- Prevention: Include a sanity-check visualization (e.g., a heatmap of the input representation) to confirm that positional patterns are visually apparent to the researcher.
4. Issue: Poor Model Performance Attributed to Noisy Inputs
- Problem: The scFM does not converge or shows poor predictive power on perturbation tasks, potentially due to low-quality data in the input representation.
- Solution: Implement rigorous quality control (QC) filters before constructing the advanced input representation. This includes filtering cells by mitochondrial read percentage, number of genes detected, and total counts. Remove lowly expressed genes across the dataset.
- Prevention: Refer to established benchmarks like PertEval-scFM, which highlight that current scFMs struggle with atypical perturbations, underscoring the need for high-quality, clean input data [32].
Frequently Asked Questions (FAQs)
Q1: Why is combining gene values with identifiers and positions critical for single-cell Foundation Model (scFM) training? A1: Combining these elements creates a rich, structured input that allows the model to learn not just expression levels, but also the functional identity (via identifiers) and the spatial or genomic context (via positions) of each gene. This is essential for predicting nuanced perturbation effects, as the impact of a genetic perturbation can heavily depend on the cellular context and genomic location [32].
Q2: What is the most robust method for integrating categorical gene identifiers into a numerical input vector? A2: The most common and effective method is to use learned embedding layers. Instead of using raw identifier strings, you map each gene identifier to a dense, low-dimensional vector. These embeddings are then updated during model training, allowing the scFM to learn the semantic relationships between different genes.
Q3: How can I quantitatively validate that my input representation is working as intended before full model training? A3: Perform a baseline comparison. Train a simple model (e.g., a multi-layer perceptron) on your advanced representation and compare its performance on a held-out test set against the same model trained only on raw gene expression values. A significant performance improvement indicates that the additional identifier and positional information is beneficial.
Q4: Our experiments show that scFM embeddings do not outperform simpler baselines. What could be the root cause? A4: This is a known challenge in the field. As noted by the PertEval-scFM benchmark, zero-shot scFM embeddings often fail to consistently outperform baselines, especially under distribution shift [32]. The root cause may lie in the input representation's inability to capture task-specific features or in the model architecture itself. Focus on creating specialized input representations for your specific prediction task rather than relying on generic embeddings.
Data and Specification Tables
The following tables summarize the core quantitative aspects of constructing advanced input representations.
Table 1: Input Vector Composition Specifications
| Component | Data Type | Recommended Dimension | Normalization Method | Integration Method |
|---|---|---|---|---|
| Gene Expression Values | Continuous Float | 1 x N (N = number of genes) | Log(CPM + 1) or Z-score | Core feature vector |
| Gene Identifiers | Categorical | 1 x N (Embedding dim) | Embedding Lookup | Concatenated or summed with expression |
| Positional Encodings | Continuous Float | 1 x N or 1 x (N * K) | Min-Max to [0,1] | Element-wise addition or dedicated channel |
Table 2: Color Palette for Workflow Visualization (Adheres to WCAG Contrast Guidelines) Based on WCAG guidelines, a contrast ratio of at least 4.5:1 is required for normal text [40] [41] [42].
| Element | Hex Color | Use Case | Recommended Text Color |
|---|---|---|---|
| Primary Blue | #4285F4 |
Process Nodes, Data Flow | #FFFFFF |
| Alert Red | #EA4335 |
Warning/Error Steps, Input Data | #FFFFFF |
| Accent Yellow | #FBBC05 |
Highlighted Output, Key Results | #202124 |
| Success Green | #34A853 |
Final Output, Validation Steps | #FFFFFF |
| White | #FFFFFF |
Background, Node Fill | #202124 |
| Light Gray | #F1F3F4 |
Secondary Background | #202124 |
| Dark Gray | #5F6368 |
Borders, Secondary Text | #FFFFFF |
| Off-Black | #202124 |
Primary Text, Default Arrow Color | #FFFFFF |
Experimental Protocol: Constructing an Advanced Input Representation
Objective: To create a unified input vector for scFM training that combines normalized gene expression values, embedded gene identifiers, and genomic positional encodings.
Methodology:
Data Acquisition & QC: Obtain a single-cell RNA-seq count matrix (Cells x Genes). Apply standard QC filters: remove cells with < 500 genes detected, genes expressed in < 10 cells, and cells with > 20% mitochondrial reads.
Gene Value Normalization: Normalize the filtered count matrix using log(CPM + 1) or SCTransform to account for library size differences. The output is a numerical matrix
Gof dimension (Number of Cells x Number of Genes, N).Gene Identifier Processing: Map the gene symbols (e.g., "TP53") to a standardized database (e.g., Ensembl ID: "ENSG00000141510"). Create an array
Iof these categorical identifiers. Initialize a trainable embedding layer with dimensiond_embed. PassIthrough this layer to get a dense numerical matrixI_embeddedof dimension (N xd_embed).Positional Encoding Generation: For each gene, obtain its genomic coordinate (e.g., TSS). Encode this position using a method like Gaussian Radial Basis Functions (RBFs) across a set of genomic bins, creating a matrix
Pof dimension (N x Number of RBF kernels).Feature Integration: Combine the three components into a final input representation
R. One effective method is:R = G + I_embedded * W + P * V, whereWandVare learnable weight matrices that project the embeddings and positions to the same dimension asG. Alternatively, for a simpler approach, concatenate the matrices along the feature axis.Validation: The final representation
Ris now ready for scFM training. Visually inspect the data flow using the provided Graphviz diagram to ensure logical consistency.
Workflow Visualization
Data Preprocessing and Integration Workflow for scFM Inputs
The Scientist's Toolkit: Research Reagent Solutions
Table 3: Essential Resources for Input Representation Construction
| Resource Name | Function / Role | Key Feature |
|---|---|---|
| GENCODE Database | Provides comprehensive, high-quality gene annotation. | Standardized gene identifiers and positional information (TSS, transcripts). |
| Ensembl Genome Browser | Offers an integrated view of genomics data. | Consistent API for fetching gene coordinates and identifiers across versions. |
| MyGene.info API | A powerful gene query web service. | Rapid translation and annotation of gene identifiers between different systems. |
Bioconductor (org.Hs.eg.db) |
An R-based annotation data package. | Local, programmatic access to gene identifier mappings for reproducible pipelines. |
| PertEval-scFM Benchmark | Standardized framework for evaluating perturbation prediction models [32]. | Critical for validating the performance of your scFM trained on the new input representation. |
| Scanpy (Python) | A scalable toolkit for single-cell data analysis. | Built-in functions for QC, normalization, and data management, forming the pipeline's base. |
Overcoming Hurdles: Optimizing Preprocessing for Performance and Scalability
Frequently Asked Questions
What are the primary sources of bias in single-cell data for foundation model training? Bias in single-cell data primarily arises from biological and technical sources. Biological sources include under-representation of specific cell states, such as rare cell types or disease-specific malignant cells, across different individuals, tissues, or species [43]. Technical sources encompass variations in sequencing platforms (e.g., 10x, Smart-seq2) and protocols, which create batch effects and distribution shifts that can be misinterpreted as biological signals [43].
How can I identify if my training data has an incomplete cellular hierarchy? Signs of an incomplete hierarchy include poor model performance on out-of-distribution (OOD) cells, failure to identify rare cell types during inference, and inability to harmoniously integrate query data from new experiments into a reference atlas. For instance, a model might fail to annotate a rare 'beta_minor' cell type, which constitutes only 0.3% of a dataset [43]. Systematic benchmarking against diverse, population-scale datasets is crucial for this identification.
What is the difference between intrinsic and extrinsic biases in this context? Intrinsic bias is rooted in the training data itself and the model's architecture, leading to systematic under-representation of certain cellular states [43] [44]. Extrinsic bias manifests during the model's deployment on specific real-world tasks, such as mischaracterizing cells from a new patient cohort or sequencing technology due to distributional shifts [44].
Are there benchmark datasets available for testing a model's robustness to bias? Yes, several benchmark datasets are commonly used. These include the hLung data (cells from 5 sequencing platforms across diseased and normal human lung tissues), the mHypoMap (integrating 17 published mouse hypothalamus datasets), and the Immune dataset (cells from 17 different tissues) [43]. Utilizing such resources helps in objectively evaluating model generalization.
Troubleshooting Guides
Problem: Poor Model Generalization on Out-of-Distribution Cells
- Symptoms: The model performs well on data similar to its training set but shows significant degradation in annotation accuracy (F1-score) when presented with cells from a different sequencing platform, tissue, or disease state [43].
- Solutions:
- Implement Reference Mapping: Use methods like CellMemory, which are specifically designed for concurrent identity inference and data integration of OOD cells. This approach allows for harmonious embedding of new cells into an existing reference framework [43].
- Employ Bottlenecked Architectures: Incorporate neuroscience-inspired, bottlenecked Transformer architectures. These models force information through a limited-capacity "global workspace," which enhances competition among biological features and improves the selection of generalized, informative representations [43].
- Conduct Multi-Scenario Benchmarking: Rigorously test your model on datasets with known biological and technical variations. Compare its performance against other foundation models and task-specific methods using metrics like F1-score, which is sensitive to rare cell type accuracy [43].
Problem: Failure to Identify Rare Cell Types
- Symptoms: The model consistently misses or misannotates low-abundance cell populations in the query dataset.
- Solutions:
- Strategic Data Curation: During the data preprocessing phase, actively identify and ensure the inclusion of datasets that contain known rare cell types. This may involve oversampling or applying specific weights to these populations to counterbalance their low frequency [43] [44].
- Leverage Hierarchical Interpretation: Utilize models that offer hierarchical interpretation of their decisions. For example, analyze attention scores at the feature (gene) level and the "memory slot" level to understand if the model is recognizing the unique gene programs that define the rare cell type [43].
- Validate with Specialized Benchmarks: Test on benchmarks specifically designed to challenge a model's ability to detect rare cells, such as the hPancreas dataset containing the 'beta_minor' cell type [43].
Problem: Inconsistent Results Across Different Data Preprocessing Pipelines
- Symptoms: Small changes in data preprocessing steps (e.g., normalization, gene selection) lead to large fluctuations in model performance and derived biological conclusions.
- Solutions:
- Systematic Pipeline Evaluation: Adopt a framework for systematically evaluating a wide range of preprocessing pipelines. This involves testing different combinations of preprocessing steps to identify which pipeline is most robust for your specific data and biological question [45] [46].
- Optimize on a Per-Study Basis: Recognize that a one-size-fits-all pipeline may be suboptimal. Where feasible, optimize the preprocessing pipeline for individual studies or even single subjects to maximize the reproducibility and quality of the resulting data [45].
- Prioritize Topological Consistency: When constructing cellular networks from your data, choose pipelines that minimize spurious discrepancies and are sensitive to genuine biological effects. Use multi-criterion evaluations that consider test-retest reliability and sensitivity to inter-subject differences [46].
Quantitative Data on Model Performance and Bias
The table below summarizes quantitative benchmarking data of a bias-mitigating model (CellMemory) against other single-cell Foundation Models (scFMs) across various datasets. Performance is measured using the F1-score (macro), which is critical for evaluating rare cell type accuracy [43].
Table 1: Benchmarking Model Performance on Diverse Single-Cell Datasets
| Dataset | Primary Challenge | CellMemory (F1-Score) | Geneformer (F1-Score) | Seurat (F1-Score) |
|---|---|---|---|---|
| hPancreas | Rare cell type (beta_minor: 0.3%) | 81% (annotation accuracy) | 11% | 0% |
| hLung | Multiple platforms (10x, Smart-seq2, etc.), diseased vs. normal | Outperformed scFMs | Suboptimal | Suboptimal |
| mHypoMap | Integration of 17 heterogeneous datasets | Outperformed scFMs | Suboptimal | Suboptimal |
| Immune | Generalization across 17 tissues | Outperformed scFMs | Suboptimal | Suboptimal |
The following table outlines common bias mitigation algorithms and their trade-offs across different sustainability dimensions, as identified in broader machine learning research [47].
Table 2: Trade-offs of Bias Mitigation Algorithms on System Sustainability
| Technique | Stage | Effect on Social Sustainability (Fairness) | Effect on Environmental Sustainability | Effect on Economic Sustainability |
|---|---|---|---|---|
| Re-weighting | Pre-training | Can improve for underrepresented groups | Alters computational overhead | Impacts resource allocation |
| Adversarial De-biasing | Training | Can reduce correlation with sensitive attributes | Increases computational cost and energy usage | Potential cost increases from compute |
| Equalized Odds | Post-processing | Modifies outputs to enforce fairness | Minimal impact on training | Can affect user trust and product reliability |
Experimental Protocols for Bias Assessment
Protocol 1: Benchmarking for Robustness on Out-of-Distribution Cells
- Data Acquisition: Curate a reference training set from a controlled source (e.g., healthy tissue from one platform). The query test set should introduce distribution shifts (e.g., cells from a different platform, diseased tissue, or different species) [43].
- Model Training: Train the model solely on the reference data. Do not pre-train on the query data to ensure a valid OOD test [43].
- Reference Mapping & Inference: Use the trained model to perform label transfer and generate embeddings for the query OOD cells [43].
- Performance Evaluation: Quantify performance using metrics like F1-score (macro) and accuracy. Specifically assess the accuracy on rare cell types within the query set. Evaluate the integration quality by visualizing the embeddings of reference and query cells together [43].
Protocol 2: Evaluating Preprocessing Pipeline Consistency
- Define Pipeline Steps: Enumerate all possible choices for key preprocessing steps, such as normalization, gene selection, and scaling [45] [46].
- Generate Pipeline Combinations: Systematically create a set of pipelines from all possible combinations of these choices [46].
- Apply Multi-Criteria Evaluation: Run each pipeline and evaluate the outcomes based on multiple criteria. For functional connectomics, this includes [46]:
- Minimizing motion confounds.
- Minimizing spurious test-retest discrepancies.
- Maximizing sensitivity to inter-subject differences.
- Maximizing sensitivity to experimental effects.
- Identify Optimal Pipelines: Select pipelines that consistently satisfy all criteria across different datasets. The stability of the resulting cellular hierarchy and network topology is a key indicator of a robust pipeline [46].
Workflow and Signaling Pathway Visualizations
Bias Mitigation in scFM Training
CellMemory's Bottlenecked Transformer Design [43]
The Scientist's Toolkit: Research Reagent Solutions
Table 3: Essential Materials for scFM Bias Mitigation Experiments
| Item / Resource | Function / Explanation |
|---|---|
| Population-Scale References (e.g., Human Cell Atlas) | Provides a consensus reference of cell states for benchmarking and as a mapping target, helping to contextualize OOD cells [43]. |
| Diverse Benchmarking Datasets (hLung, mHypoMap, Immune) | Curated datasets with known biological and technical variations used to stress-test model generalization and quantify performance [43]. |
| Bottlenecked Transformer (CellMemory) | A model architecture designed with a limited-capacity "global workspace" to improve generalization and provide hierarchical interpretations for OOD cells [43]. |
| Bias Mitigation Algorithms (e.g., Re-weighting, Adversarial De-biasing) | Computational techniques applied at pre-training, training, or post-processing stages to reduce model bias, though they involve trade-offs with other system sustainability factors [47]. |
| Portrait Divergence (PDiv) Metric | An information-theoretic measure used to compute the dissimilarity between entire network topologies, useful for evaluating the test-retest reliability of derived cellular hierarchies [46]. |
Addressing the Unseen Cell Type Problem Through Strategic Data Curation
Frequently Asked Questions
What is the "unseen cell type" problem in scRNA-seq analysis? The "unseen cell type" problem occurs when a query dataset contains cell types that are not present in the reference atlas used for automated annotation. This can lead to false predictions, as classifiers are biased toward the cell types they were trained on, and can obscure novel biological discoveries [48].
How can strategic data curation help mitigate this issue? Strategic data curation addresses this by improving the quality and diversity of the reference data. This involves integrating multiple reference datasets to enrich cell type information, applying rigorous gene selection methods to detect biologically important features, and implementing preprocessing steps to recover missing gene expression data that might hide critical cell-type markers [48] [49].
What is a key preprocessing step to recover missing gene expression data? Optimizing the reference transcriptome is a crucial step. Standard transcriptome annotations can lead to the loss of gene expression information, particularly from the tail ends of genes or in regions with complex overlapping transcripts. Using an optimized reference transcriptome during data mapping can recover this "invisible" data, revealing previously missed cell types [49].
What are the main approaches to identifying unseen cell types during annotation? Advanced annotation methods, like mtANN, use a combination of deep learning and ensemble learning. They define a new uncertainty metric from three complementary perspectives to flag cells that may belong to unseen types: intra-model (entropy of predictions from a single classifier), inter-model (entropy of averaged probabilities across classifiers), and inter-prediction (inconsistency among predictions from different models) [48].
Why is sample multiplexing like MULTI-seq beneficial for data quality? Techniques like MULTI-seq use lipid-modified oligonucleotides (LMOs) to barcode samples from different origins, allowing them to be pooled and processed together in a single scRNA-seq run. This reduces costs and technical batch effects, and it also provides a powerful internal control for identifying artifacts like cell doublets, thereby improving the overall quality and reliability of the curated dataset [50].
What are common data curation steps for a large-scale single-cell study? A comprehensive curation pipeline involves several key stages, which can be adapted from text data processing to biological data [51]:
- Heuristic Filtering: Applying rule-based metrics to remove low-quality cells or uninformative genes.
- Deduplication: Removing redundant or highly similar cells to prevent overfitting and ensure data diversity. This includes exact (identical) and fuzzy (near-identical) deduplication.
- Model-based Quality Filtering: Using classifiers to filter content based on complex quality metrics.
- Data Blending and Shuffling: Combining curated datasets from multiple sources to form a unified, well-shuffled dataset for balanced model training.
Experimental Protocols and Metrics
Protocol 1: The mtANN Workflow for Unseen Cell Type Identification This protocol uses multiple references to annotate query data and accurately identify unseen cell types [48].
- Module I - Gene Selection: Apply eight different gene selection methods (DE, DV, DD, DP, BI, GC, Disp, Vst) to each reference dataset to generate multiple reference subsets with distinct informative genes.
- Module II - Model Training: Train a series of neural network-based deep classification models on all the reference subsets generated in the previous step.
- Module III - Metaphase Annotation: For the query dataset, obtain an initial ("metaphase") annotation by performing a majority vote on the predictions from all base classification models.
- Module IV - Uncertainty Metric Formulation: For each cell in the query data, calculate a new uncertainty metric based on three aspects:
- Intra-model: The average entropy of the prediction probability from different classifiers.
- Inter-model: The entropy of the averaged prediction probabilities across all models.
- Inter-prediction: The level of inconsistency among the categorical predictions from all base models.
- Module V - Threshold Determination: Fit a Gaussian mixture model to the combined uncertainty metric. Use this model to automatically select a threshold and classify cells with high predictive uncertainty as "unassigned" (i.e., potential unseen cell types).
Protocol 2: MULTI-seq Sample Barcoding and Library Preparation This protocol details how to use MULTI-seq for sample multiplexing in single-cell workflows [50].
- Preparation of LMO Oligos:
- Combine the anchor oligo and a unique sample barcode oligo to a 2 µM concentration each in PBS.
- Dilute the co-anchor oligo to 2 µM in PBS.
- Prepare 4 mL per sample of 1% BSA in PBS and keep it on ice.
- Cell Preparation:
- Create a single-cell suspension in PBS at a concentration of ~500,000 cells in 180 µL. Avoid using buffers with FBS or serum.
- Cell Labeling:
- Add 20 µL of the anchor/barcode mixture to 180 µL of cell suspension. Mix gently and incubate for 5 minutes on ice.
- Add 20 µL of the co-anchor solution. Mix gently and incubate for another 5 minutes on ice.
- Add 1 mL of 1% BSA in PBS to stop the reaction.
- Pellet cells by gentle centrifugation and wash with 1% BSA in PBS at least twice.
- Library Preparation and Sequencing:
- Process the labeled cells through your single-cell workflow (e.g., 10x Genomics).
- The MULTI-seq sample barcodes are captured alongside endogenous mRNAs.
- Separate the MULTI-seq barcode fraction from the endogenous cDNA by size selection using SPRI beads.
- Construct the MULTI-seq library by PCR, adding NGS adaptors (e.g., P5 and P7). The final library size is typically 180–200 bp.
- For sequencing, pool the MULTI-seq library at a 1% molar ratio with the cDNA library.
Table 1: Key Metrics from the mtANN Method on Benchmark Tests [48]
| Dataset Collection | Number of Tests | Key Advantage of mtANN |
|---|---|---|
| Peripheral Blood Mononuclear Cells (PBMC) | 75 benchmark tests | Superior performance in unseen cell-type identification and cell-type annotation compared to state-of-the-art methods. |
| Pancreas | 75 benchmark tests | Effectively handles different proportions of unseen cell types in the query dataset. |
| COVID-19 | 249 tests | Demonstrates practical utility in a real-world disease context across patients with different symptoms. |
Table 2: MULTI-seq Labeling Efficiency and Library Specifications [50]
| Parameter | Specification / Result | Context / Cell Type |
|---|---|---|
| Labeling Efficiency | >98% | HFFs, HEK293T, and NIH3T3 cells labeled with anchor and co-anchor. |
| Labeling Stability | At least 2 hours on ice | Efficiency decreases without the co-anchor oligo. |
| Final Library Size | 180–200 bp | Detected after adapter addition and PCR. |
| Sequencing Ratio | 1% (MULTI-seq : cDNA) | Provides sufficient barcode sequence alignment. |
The Scientist's Toolkit: Research Reagent Solutions
Table 3: Essential Reagents for Single-Cell Multiplexing and Analysis
| Reagent / Material | Function |
|---|---|
| Lipid-Modified Anchor Oligo (3'-lignoceric acid amide) | Embeds into the plasma membrane to localize the DNA sample barcode to the cell surface [50]. |
| Lipid-Modified Co-Anchor Oligo (5'-palmitic acid amide) | Prolongs the membrane retention of the oligo complex, enhancing labeling stability [50]. |
| DNA Sample Barcode | A unique DNA sequence that identifies the sample of origin; contains a poly-A tail for capture and a PCR handle [50]. |
| Optimized Reference Transcriptome | A computationally improved genomic reference that helps recover missing single-cell RNA-sequencing data, revealing previously "invisible" cell types and genes [49]. |
Workflow and Data Processing Diagrams
Single-Cell Data Curation Pipeline
mtANN for Unseen Cell Type Identification
The Role of Synthetic Data Pipelines in Augmenting Scarce or Sensitive Data
Single-cell foundation models (scFMs) are revolutionizing biology and drug discovery by uncovering patterns in complex cellular data [1] [52]. However, their development is bottlenecked by a critical data crisis: these models require massive, high-quality training datasets that are often scarce, sensitive, or prohibitively expensive to obtain [53] [54]. For researchers working with sensitive human genetic information or studying rare cellular conditions, this data scarcity threatens to undermine model accuracy and reliability.
Synthetic data pipelines have emerged as a fundamental solution to this challenge. By using algorithms to generate artificial data that mimics the statistical properties of real single-cell datasets without containing identifiable real-world information, these pipelines provide a privacy-preserving, scalable method to augment scarce or sensitive data [53]. This technical support guide explores how researchers can effectively implement synthetic data pipelines to advance their scFM research while navigating common technical hurdles.
Frequently Asked Questions: Synthetic Data for scFM Research
Q1: What specific problems can synthetic data solve in single-cell foundation model development?
Synthetic data addresses multiple critical challenges in scFM development:
- Data Scarcity for Rare Cell States: Generate sufficient examples of rare cellular conditions or perturbation responses that are difficult to capture in sufficient quantities through wet-lab experiments [54].
- Privacy Protection: Create usable datasets from sensitive human single-cell data by generating artificial transcriptomes that preserve statistical patterns without containing actual patient information [53].
- Class Imbalance Correction: Address dataset biases by generating synthetic samples for underrepresented cell types or conditions, improving model fairness and accuracy [54].
- Benchmarking and Validation: Create controlled synthetic datasets with known ground truth to systematically evaluate model performance across diverse biological scenarios [52].
Q2: How do we evaluate the quality and reliability of synthetic single-cell data?
Evaluating synthetic data requires multiple complementary approaches to ensure both statistical fidelity and biological relevance:
Table: Key Evaluation Metrics for Synthetic Single-Cell Data
| Metric Category | Specific Metrics | Optimal Outcome |
|---|---|---|
| Statistical Similarity | Maximum Mean Discrepancy (MMD), Kolmogorov-Smirnov test | No significant differences from real data distribution |
| Privacy Protection | Membership inference attack resistance, k-anonymity measures | High resistance to re-identification attacks |
| Biological Validity | Gene-gene correlation preservation, pathway activation patterns | Maintains known biological relationships and structures |
| Downstream Utility | scFM performance on cell type annotation, perturbation prediction | Comparable or improved performance versus real data alone |
Additionally, the synthetic data should be validated through:
- Dimensionality Assessment: Using metrics like Average Silhouette Width (ASW) to verify that synthetic cell embeddings maintain appropriate separation between cell types [52].
- Batch Effect Simulation: Testing whether synthetic data can help models learn to correct for technical variations across different sequencing platforms [52].
- Perturbation Response Modeling: Evaluating how well synthetic data captures cellular responses to genetic or chemical perturbations [32].
Q3: Our scFM trained on synthetic data shows degraded performance on real-world tasks. What troubleshooting steps should we follow?
Performance degradation often stems from distributional shifts between synthetic and real data. Follow this systematic troubleshooting protocol:
Analyze the Distribution Mismatch
- Compare the principal component analysis (PCA) distributions of synthetic versus real data
- Check for missing cell populations in the synthetic data
- Validate that gene expression ranges and variances match expected biological parameters
Audit Your Synthetic Data Generation Process
- Verify that your generative model was trained on a sufficiently diverse and representative dataset
- Ensure you're using appropriate generation techniques for your data type (GANs, VAEs, diffusion models for visual data; tabular generators for expression matrices) [54]
- Check for mode collapse where the generator produces limited varieties of cells
Implement a Hybrid Training Strategy
- Gradually mix synthetic and real data during training, starting with a high proportion of real data
- Use curriculum learning approaches that introduce more challenging synthetic examples as training progresses
- Implement ensemble methods that combine models trained on both data types
Enhance Your Synthetic Data with Human Validation
- Incorporate human-in-the-loop (HITL) review where domain experts validate synthetic cell profiles [54]
- Use active learning to identify where the model performs poorly and generate targeted synthetic examples for those scenarios
- Establish a continuous validation pipeline with biological ground truth testing
Q4: What are the best practices for integrating synthetic data into existing scFM training pipelines?
Successful integration requires both technical implementation and validation strategies:
Table: Integration Approaches for Synthetic Data in scFM Pipelines
| Integration Strategy | Implementation Steps | Validation Protocol |
|---|---|---|
| Data Augmentation | Add synthetic samples to underrepresented classes until balanced | Compare model performance on held-out real test data before and after augmentation |
| Pretraining Extension | Use synthetic data for initial pretraining phases, fine-tune with real data | Evaluate zero-shot performance on benchmark tasks before fine-tuning [52] |
| Transfer Learning | Train foundation models on large synthetic datasets, transfer to specific real-data tasks | Measure time-to-convergence and final accuracy on target tasks |
| Privacy Preservation | Replace sensitive real data entirely with synthetic equivalents for model sharing | Conduct privacy attack simulations to ensure no data leakage |
Q5: How can we prevent "model collapse" when using synthetically trained scFMs to generate more training data?
Model collapse occurs when successive generations of models trained on synthetic data progressively degrade. Prevention strategies include:
- Regular Real Data Infusion: Periodically retrain or fine-tune models with fresh real single-cell data to maintain connection with biological ground truth [54].
- Diversity Preservation Techniques: Implement explicit diversity constraints in your generation process to ensure broad coverage of the biological space.
- Multi-Source Training: Combine synthetic data from multiple different generation algorithms to avoid overfitting to artifacts of a specific method.
- Quality Gate Implementation: Establish automated quality metrics that must be passed before synthetic data is added to training sets, rejecting low-quality generations.
Experimental Protocols for Synthetic Data in scFM Research
Protocol 1: Generating Synthetic Single-Cell Data for scFM Pretraining
This protocol details the generation of high-quality synthetic single-cell data for foundation model pretraining using a generative adversarial network (GAN) framework.
Materials and Reagents
Table: Essential Research Reagents and Computational Tools
| Item | Function/Application | Implementation Notes |
|---|---|---|
| Real single-cell dataset | Source distribution for learning | Should be diverse, with multiple cell types and conditions |
| GAN/VAE framework | Core generative model | scGPT or specialized single-cell GANs recommended [52] |
| Quality control metrics | Validate synthetic data quality | Includes MMD, correlation analysis, clustering metrics |
| High-performance computing | Handle computational demands | GPU clusters often necessary for large-scale generation |
| Data privacy safeguards | Ensure compliance with regulations | Differential privacy, k-anonymity implementations |
Methodology
- Data Preprocessing and Quality Control
- Begin with a curated single-cell RNA sequencing dataset (e.g., from CZ CELLxGENE [1])
- Perform standard QC: filter cells by mitochondrial percentage, remove doublets, normalize counts
- Select highly variable genes to focus generation on biologically meaningful features
Generator Training
- Train generator model to transform random noise into synthetic gene expression vectors
- Simultaneously train discriminator to distinguish real from synthetic cells
- Implement Wasserstein loss with gradient penalty for training stability
- Continue training until discriminator accuracy approaches 50% (indicates indistinguishable data)
Synthetic Data Generation and Validation
- Generate synthetic cells in batches, with each batch representing a distinct cell type or condition
- Validate using the multi-metric approach outlined in FAQ #2
- Perform biological validation by confirming known gene-gene correlations are preserved
The following workflow diagram illustrates the complete synthetic data generation and validation pipeline:
Protocol 2: Benchmarking scFM Performance with Synthetic Data Augmentation
This protocol provides a standardized framework for evaluating whether synthetic data augmentation improves scFM performance on downstream tasks.
Materials and Reagents
- Pre-trained scFM (e.g., scGPT, Geneformer, scBERT) [52]
- Benchmark dataset with known ground truth (e.g., PertEval-scFM) [32]
- Synthetic data generation pipeline (from Protocol 1)
- Performance evaluation metrics relevant to your biological questions
Methodology
- Establish Baseline Performance
- Fine-tune scFM on real data only using standard procedures
- Evaluate on benchmark tasks including cell type annotation, perturbation prediction, and batch correction
- Record performance metrics as baseline for comparison
Augment with Synthetic Data
- Generate synthetic data using Protocol 1, targeting specific data gaps identified in baseline analysis
- Create mixed training sets with varying proportions of real and synthetic data (e.g., 70% real/30% synthetic, 50%/50%)
- Fine-tune the same scFM architecture on each mixed dataset
Comparative Analysis
- Evaluate each augmented model on the same benchmark tasks
- Use statistical tests to determine if performance differences are significant
- Analyze whether specific cell types or conditions show greater improvement from augmentation
The benchmarking workflow employs a systematic approach to evaluate multiple augmentation strategies:
Advanced Technical Considerations
Regulatory Compliance and Ethical Use
When generating synthetic single-cell data, particularly from human subjects, researchers must navigate evolving regulatory landscapes:
- HIPAA Compliance: In the U.S., ensure synthetic data generation follows the "safe harbor" method for de-identification of protected health information [55].
- EU AI Act Compliance: For European researchers, most healthcare AI systems (including scFMs) are classified as "high-risk," requiring rigorous data governance and transparency [55].
- Explainability Requirements: Implement tracking of data provenance and lineage to explain how synthetic data was generated, which regulators increasingly require for AI in healthcare [55].
Computational Optimization Strategies
Synthetic data generation for scFMs is computationally intensive. Optimization strategies include:
- Progressive Generation: Start with lower-dimensional representations before generating full transcriptomes.
- Transfer Learning from Public Data: Pretrain generative models on public single-cell atlases before fine-tuning on proprietary data.
- Federated Generation: Generate synthetic data in a distributed manner across multiple institutions without sharing raw data [55].
Synthetic data pipelines represent a paradigm shift in single-cell foundation model development, offering solutions to critical challenges of data scarcity, privacy, and bias. While technical hurdles remain—particularly around distribution matching and validation—the systematic approaches outlined in this technical support guide provide researchers with practical methodologies for successfully integrating synthetic data into their scFM workflows. As the field advances, the combination of sophisticated generation techniques, robust validation frameworks, and human expert oversight will enable increasingly powerful and biologically accurate foundation models to drive discoveries in basic biology and therapeutic development.
Technical Support Center
Troubleshooting Guides & FAQs
This section addresses common challenges researchers face when building automated preprocessing pipelines for single-cell Foundation Model (scFM) training.
FAQ 1: How can we efficiently handle missing values in large-scale single-cell RNA-seq data without introducing significant bias?
Missing data is a recurrent problem in real-world single-cell datasets. The optimal handling method depends on the nature and extent of the missingness.
- Dropping Samples: Instrumental when the number of samples is high, and the count of missing values in one row/sample is high. This is not a recommended solution for other cases, as it can lead to heavy data loss [56].
- Statistical Imputation: Replace missing values with the mean, median, or mode of the feature. These are closer approximations than a single value like zero [56].
- Model-Based Imputation: Build a model using other features to predict the missing values. This provides the closest approximations but is computationally intensive [56].
FAQ 2: Our preprocessing pipeline for a new scRNA-seq dataset is yielding poor model performance. What are the first data quality checks we should perform?
Preprocessing requires careful data quality assessment to spot key trends and inconsistencies [56]. The initial diagnostic steps should be:
- Identify Outliers: Use box-plots to detect data points that do not conform to the predominant pattern. These can disrupt the true pattern of the sample [56].
- Check for Inconsistencies: Look for incorrect spellings, incorrectly populated columns, or duplicated data that may have arisen during data aggregation [56].
- Verify Scaling: Ensure that different features (e.g., gene counts) have been brought to a comparable range using techniques like Robust Scaler, which works well in the presence of outliers [56].
FAQ 3: What workflow orchestration platform should we choose for our preprocessing pipelines, and what are the key decision factors?
The choice depends on your team's specific requirements for scalability, flexibility, and existing infrastructure.
- For Python-Centric, Dynamic Workflows: Prefect is a Python-native orchestration tool that allows you to run workflows anywhere and scale as needed without forcing a rigid structure [57].
- For Enterprise-Grade, Complex Hybrid Environments: Enterprise platforms like Control-M deliver mission-critical reliability with advanced scheduling, workflow optimization, and support for complex hybrid infrastructures [58].
- For Open-Source Data Engineering Pipelines: Apache Airflow is a leading open-source solution, particularly for data engineering teams orchestrating ETL pipelines and managing big data workloads [58].
Table 1: Key Decision Factors for Orchestration Platform Selection
| Factor | Enterprise Platform (e.g., Control-M) | Open-Source (e.g., Apache Airflow) | Cloud-Native (e.g., Prefect) |
|---|---|---|---|
| Customization & Flexibility | Limited by vendor | Extensive customization and community support [58] | High, Pythonic and dynamic [57] |
| Support & Maintenance | Included in cost [59] | Needs internal or contracted resources [59] | Varies by service tier |
| Scalability | Limited by partner [59] | Build and change per requirements [59] | High, designed to scale with demand [57] |
| Cost | Predictable subscription fee [59] | High initial development costs [59] | Variable, often pay-as-you-go |
FAQ 4: Our tokenization strategy seems to affect scFM performance. What are the established methods for tokenizing single-cell data for transformer models?
Tokenization converts raw gene expression data into discrete units (tokens) that a model can process. A key challenge is that gene expression data is not naturally sequential [1].
- Expression Ranking: A common strategy is to rank genes within each cell by their expression levels and feed the ordered list of top genes as the ‘sentence’ for the model [1].
- Value Binning: Other models partition genes into bins based on their expression values and use those rankings to determine their positions [1].
- Simplified Normalization: Several models report no clear advantages for complex ranking strategies and simply use normalized counts, relying on the model to learn relationships [1].
Experimental Protocols & Methodologies
Protocol 1: Implementing a Robust Scalable Preprocessing Pipeline with Workflow Orchestration
This protocol outlines the steps to build a scalable, automated preprocessing pipeline for scFM training using modern orchestration principles.
- Assess Requirements: Identify workflows that would benefit from automation, particularly data pipelines and ETL processes requiring high reliability [58].
- Select an Orchestration Platform: Choose between open-source (e.g., Apache Airflow) and enterprise platforms based on scalability requirements and existing technology investments [58].
- Design Workflow Architecture: Map all dependencies between tasks (e.g., quality control must finish before imputation begins). Define error-handling procedures and establish notification rules [58].
- Integrate Systems Progressively: Connect to data sources, compute clusters, and storage systems using native connectors or custom APIs. Start with high-impact workflows before expanding scope [58].
- Implement Monitoring: Use the orchestration platform's real-time monitoring and observability features to track performance metrics, identify bottlenecks, and ensure completion [58].
The following workflow diagram illustrates the automated pipeline structure.
Diagram 1: Automated scFM Preprocessing Pipeline
Protocol 2: Experimental Scenarios for Evaluating Preprocessing and Orchestration Efficacy
To validate the pipeline, conduct experiments comparing outcomes with and without orchestration.
- Experiment 1 - Pipeline Robustness: Intentionally introduce common failures (e.g., corrupted input files, network timeout). Measure the number of manual interventions required with and without an orchestration platform's intelligent error handling and retry mechanisms [58].
- Experiment 2 - Processing Throughput: Use a fixed large-scale single-cell corpus (e.g., from CZ CELLxGENE [1]). Measure the total time from data ingestion to ready-for-training tokens with a manually managed script versus an orchestrated pipeline that can execute independent steps (e.g., quality control and data ingestion for the next batch) in parallel [58].
- Experiment 3 - Reproducibility: Have multiple team members attempt to recreate the same preprocessing environment and run the pipeline on an identical dataset. Compare the consistency of outputs and the time taken using a version-controlled, orchestrated workflow versus ad-hoc, manual procedures.
Table 2: Quantitative Metrics for Pipeline Evaluation
| Metric | Manual / Scripted Pipeline | Orchestrated Pipeline | Measurement Method |
|---|---|---|---|
| Average Handle Time | Slower, linear processing | Faster, parallel task execution [58] | Time from data ingress to token output |
| Error Rate & Manual Intervention | High | Dramatically reduced via automated retries [58] | Count of failed runs requiring manual restart |
| Reproducibility Score | Low, environment-dependent | High, version-controlled and containerized | Consistency of output across 10 repeated runs |
| Resource Utilization | Often inefficient | Optimized through intelligent scheduling [58] | CPU/GPU idle time during pipeline execution |
The Scientist's Toolkit
This section details key resources and technologies essential for building scalable scFM preprocessing pipelines.
Table 3: Essential Research Reagents & Solutions for scFM Preprocessing
| Item | Function / Purpose | Example Tools & Platforms |
|---|---|---|
| Workflow Orchestration Platform | Coordinates and automates interconnected preprocessing tasks across systems, managing dependencies and ensuring end-to-end completion [58]. | Prefect [57], Apache Airflow [58], Control-M [58] |
| Public Single-Cell Data Corpora | Provides large-scale, diverse datasets for scFM pretraining, capturing a wide spectrum of biological variation [1]. | CZ CELLxGENE [1], Human Cell Atlas [1], NCBI GEO & SRA [1] |
| Data Preprocessing Libraries | Offers efficient, one-line solutions for critical preprocessing steps like missing value imputation, scaling, and outlier detection [56]. | Scikit-learn (Python) [56], Autumunge (Python) [56] |
| Containerization Technology | Ensures preprocessing environment consistency and portability across different compute resources, aiding reproducibility. | Docker, Singularity |
| Version Control System | Tracks changes to both preprocessing code and workflow definitions, enabling rollback and collaboration. | Git |
| Computational Backend | Provides the scalable compute power required for processing large corpora and training large foundation models. | Cloud Clusters (AWS, GCP, Azure), High-Performance Computing (HPC) |
The following diagram maps the logical relationships between these key components in a complete research setup.
Diagram 2: scFM Preprocessing System Architecture
This technical support center provides guidance on constructing optimal data compositions for training single-cell Foundation Models (scFMs). The principles outlined here are derived from the established field of Large Language Model (LLM) training and adapted for the unique challenges of single-cell genomics. A robust data preprocessing pipeline is the most critical factor determining the success of your scFM, influencing its ability to generalize, mitigate bias, and produce biologically relevant insights.
Frequently Asked Questions (FAQs)
Q1: How do data requirements for scFMs fundamentally differ from those of traditional single-cell analysis?
Traditional single-cell analyses often focus on a single experiment or a curated set of studies addressing a specific biological question. In contrast, scFMs require massive, diverse datasets for pretraining, analogous to the text corpora used for LLMs. The goal shifts from answering a targeted question to learning a generalizable "language" of cells, which can then be adapted to numerous downstream tasks such as cell type annotation, perturbation response prediction, and data imputation [1]. This necessitates a fundamental shift in data collection, focusing on scale, diversity, and systematic integration of heterogeneous data sources.
Q2: We have a high-quality in-house dataset. Is it sufficient to pretrain a performant scFM?
It is highly unlikely. While high-quality in-house data is invaluable, its limited scale and diversity pose significant constraints. scFMs, like LLMs, require exposure to a vast spectrum of biological variation—across different tissues, disease states, species, and experimental conditions—to learn robust and generalizable representations [1]. Relying solely on in-house data risks the model overfitting to the technical artifacts and specific biological context of your experiments, severely limiting its utility. Your in-house data is best used for fine-tuning a broadly pretrained scFM.
Q3: What is the single most critical data-related challenge when building an scFM?
The most pervasive challenge is managing batch effects and data inconsistency. Single-cell data repositories are compiled from thousands of independent studies, each with varying sequencing depths, protocols, and technical noise [1]. An scFM must learn the underlying biological signals despite this overwhelming technical variation. Furthermore, the non-sequential nature of genomic data requires clever "tokenization" strategies to structure it for transformer-based models, which were originally designed for sequential text [1].
Q4: How can we leverage LLM strategies to overcome limited labeled data for specific tasks?
A powerful strategy is LLM-assisted data labeling. For tasks like cell type annotation or identifying rare cell populations, you can use a large, powerful LLM to generate synthetic labels or annotations for your single-cell data. This involves carefully prompting the LLM with expert knowledge to create a high-quality labeled dataset, which can then be used to fine-tune a smaller, more efficient model specifically designed for your task. This approach was successfully demonstrated for financial named entity recognition, where a large model (Llama 3.1-70b) generated labels to train smaller, cost-effective models, resulting in performance close to that of the large model but at a fraction of the inference cost [60].
Troubleshooting Guides
Issue 1: Poor Model Generalization to New Datasets
Problem: Your scFM performs well on its training data but fails to maintain accuracy when applied to new datasets from different labs or conditions.
Diagnosis: This is a classic sign of a non-robust data composition, typically caused by a lack of diversity in the pretraining corpus and/or inadequate handling of batch effects.
Solutions:
- Action: Systematically diversify your pretraining data. Prioritize integration of data from multiple species, organs, disease states, and sequencing technologies. Leverage large-scale atlases like the Human Cell Atlas and public repositories like CZ CELLxGENE, which provides standardized access to over 100 million cells [1].
- Action: Implement explicit batch-effect correction strategies during tokenization. This can involve incorporating batch information as special tokens or using domain-adaptation techniques during model training to encourage the learning of batch-invariant biological representations [1].
- Action: Apply rigorous data quality controls. Before integration, curate your datasets by filtering out low-quality cells and genes and balancing dataset compositions to prevent overrepresentation of certain conditions [1] [61].
Issue 2: Ineffective Tokenization of Single-Cell Data
Problem: The model struggles to learn meaningful relationships between genes, leading to poor performance on downstream tasks.
Diagnosis: The method of converting gene expression data into a sequence of model tokens (tokenization) is suboptimal for capturing biological semantics.
Solutions:
- Action: Experiment with different gene ordering strategies. Since genes lack a natural sequence, a common approach is to rank them by expression level within each cell before presenting them to the transformer model [1].
- Action: Enrich token context. Instead of using only gene expression values, incorporate additional gene-level metadata (e.g., gene ontology terms, chromosome location) into the token embeddings to provide a richer biological context for the model [1].
- Action: Prepend a special
[CELL]token to the gene sequence. This allows the model to learn a dedicated, cell-level embedding that summarizes the entire cellular state, which is particularly useful for classification tasks [1].
Issue 3: High Computational Cost of Model Training and Inference
Problem: The computational resources required for full-scale scFM training or for running large models in production are prohibitive.
Diagnosis: You may be relying solely on large, monolithic models for all tasks, which is inefficient.
Solutions:
- Action: Adopt a "teacher-student" knowledge distillation framework. Use a large, powerful scFM (the teacher) to generate predictions or embeddings on your data. Then, use these outputs to train a much smaller, task-specific model (the student). The smaller model will learn to mimic the large model's performance at a dramatically lower computational cost [60].
- Action: For production deployment, fine-tune compact models like SpanMarker or GLiNER on data labeled by a larger scFM or LLM. As demonstrated in external applications, this can achieve over 90% of the performance of a massive model while being up to 80x cheaper to run [60].
Experimental Protocols & Data Tables
Protocol 1: Implementing an LLM-Assisted Data Labeling Pipeline
This protocol details how to use a large language model to generate high-quality labels for fine-tuning a smaller scFM on a specific task, such as annotating rare cell types.
- Deploy a Large LLM: Use a service like Hugging Face Inference Endpoints to securely deploy a powerful, open-source LLM like Llama 3.1-70B-Instruct [60].
- Design a Expert-Level Prompt: Craft a system prompt that defines the task, your desired output format, and includes few-shot examples to guide the model. For cell type annotation, this would involve providing examples of gene expression patterns and their corresponding cell types [60].
- Generate Synthetic Labels: Send your unlabeled single-cell data representations (e.g., gene expression profiles) to the LLM endpoint with the designed prompt to generate initial labels.
- Human-in-the-Loop Review: Use an open-source data annotation platform like Argilla to manually review, correct, and refine the LLM-generated labels. This step is crucial for ensuring data quality [60].
- Fine-Tune a Compact Model: Use the resulting curated dataset to fine-tune a smaller, more efficient scFM for your specific annotation task.
Protocol 2: Evaluating Data Composition Robustness
To systematically test the effectiveness of your data mix, use the following evaluation framework on a held-out test set comprising entirely novel datasets.
- Objective: Compare model performance and resource usage across different data strategies.
- Metrics: Track key performance indicators (KPIs) like F1-score for cell type annotation, mean squared error for gene expression prediction, and computational cost per inference.
Table 1: Comparative Analysis of scFM Training Data Strategies
| Strategy | Primary Objective | Key Advantage | Key Limitation | Ideal Use Case |
|---|---|---|---|---|
| Large-Scale Atlas Pretraining [1] | Learn universal cellular representations | Maximizes generalizability and model robustness | Computationally intensive; requires massive data curation | Building a foundational model for broad downstream tasks |
| LLM-Assisted Labeling [60] | Generate task-specific training data | Overcomes scarcity of expert-labeled data; cost-effective | Quality dependent on prompt design and LLM capability | Adapting a foundation model to niche tasks (e.g., rare cell identification) |
| Self-Consistency Training [62] | Leverage physical laws without labels | Uses unlabeled data; ensures predictions are physically plausible | Applicable only to tasks with a self-consistency principle | Predicting molecular properties where labeled data is scarce (e.g., Hamiltonian prediction) |
| Targeted Fine-Tuning | Specialize a model for a specific task | High accuracy on a narrow task; computationally efficient | Can lead to catastrophic forgetting of general knowledge | Final application-specific deployment of a pretrained scFM |
Table 2: Quantitative Benchmark of Model Scaling Strategies
| Model / Strategy | F1-Score (Zero-Shot) | F1-Score (Fine-Tuned) | Inference Cost (per hour) | Cost Efficiency vs. Large Model |
|---|---|---|---|---|
| Large scFM (Teacher) | 88.0% | N/A | $8.00 | 1x (Baseline) |
| GLiNER-style Model [60] | 87.0% | 93.4% | $0.10 (CPU) | ~80x Cheaper |
| SpanMarker-style Model [60] | 47.0% | 90.1% | $0.10 (CPU) | ~80x Cheaper |
Workflow Visualizations
scFM Pretraining and Application Workflow
LLM-Assisted Labeling for Efficient Fine-Tuning
The Scientist's Toolkit: Research Reagent Solutions
Table 3: Essential Resources for scFM Development
| Item | Function in scFM Research | Example Sources / Tools |
|---|---|---|
| CZ CELLxGENE [1] | Provides unified, curated access to a massive collection of standardized single-cell datasets for pretraining. | https://www.cellxgene.czisl.org/ |
| PanglaoDB & Human Cell Atlas [1] | Curated compendia of single-cell data from multiple studies, useful for training and benchmarking. | https://panglaodb.se/, https://www.humancellatlas.org/ |
| Hugging Face Inference Endpoints [60] | A service to easily and securely deploy large LLMs for data labeling and other tasks. | https://huggingface.co/inference-endpoints |
| Argilla [60] | An open-source data annotation platform for the crucial human review of LLM-generated labels. | https://argilla.io/ |
| Transformer Architectures (e.g., BERT, GPT) [1] | The core neural network architecture for building foundation models, available in various libraries. | PyTorch, TensorFlow, Hugging Face Transformers |
| Guidance (Library) [60] | A library used to constrain LLM outputs to a specified schema (e.g., Pydantic models), ensuring structured JSON output for automated processing. | https://github.com/microsoft/guidance |
Ensuring Excellence: Benchmarking and Validating Preprocessing Outcomes
Frequently Asked Questions
Q1: My UMAP visualization shows unexpected clustering that seems to follow batch lines rather than biological groups. How can I determine if this is a technical artifact?
A1: This is a classic sign of batch effects. To diagnose this, you should:
- Correlate PCA Dimensions with Metadata: Perform a Principal Component Analysis (PCA) and correlate the top principal components with your technical metadata (e.g., sequencing batch, donor, processing date). A strong correlation indicates a significant batch effect that requires correction [37].
- Use Data Integration Tools: Apply batch effect correction tools such as SCTransform, FastMNN, scVI, or the integration methods in Seurat [37] [63]. These are designed to merge datasets while preserving biologically meaningful variance.
- Validate with Known Markers: After integration, check if the expression patterns of well-established cell-type marker genes are consistent and continuous across batches, rather than fragmented.
Q2: My quality control metrics show a high percentage of mitochondrial reads in a subset of cells. Should I filter them out, and what is the appropriate threshold?
A2: A high fraction of mitochondrial reads often indicates stressed, dead, or dying cells, as intact mitochondrial transcripts remain while cytoplasmic mRNA leaks from compromised membranes [37]. The appropriate action is:
- Set a Biology-Informed Threshold: A commonly used threshold is 10–20% mitochondrial reads [37].
- Adjust for Context: This threshold is not universal. For cell types under known stress (e.g., treated samples), you may need a higher threshold to avoid excluding biologically relevant populations. For nuclei samples, the threshold should be near zero, as mitochondria are absent [37].
- Visualize the Distribution: Plot the distribution of mitochondrial read fractions against the number of transcripts per cell. This helps in setting a data-driven threshold rather than relying on a fixed value.
Q3: My differential expression analysis is yielding implausible results or an overwhelming number of significant genes. What are the common pitfalls in the preprocessing steps?
A3: This often traces back to inadequate quality control or normalization. Key steps to troubleshoot include:
- Remove Background RNA and Doublets: Ensure you have computationally removed empty droplets and doublets using tools like Scrublet (for Python) or DoubletFinder (for R) [37]. Doublets can create artificial expression profiles that confound analysis.
- Revisit Normalization: Single-cell data is inherently sparse and requires proper normalization to account for varying library sizes between cells. Methods like those in Seurat or Scanpy are standard for this [37] [64].
- Check for Contamination: Use tools like SoupX or CellBender to identify and remove ambient RNA, which can inflate background expression levels [37].
Validation Benchmarks for scRNA-seq Preprocessing
The following table outlines the key metrics and methods for establishing validation benchmarks in a scRNA-seq pipeline designed for single-cell Foundation Model (scFM) training.
| Benchmark Category | Specific Metric | Target / Threshold | Method for Validation / Tool |
|---|---|---|---|
| Sequencing Quality | Sequencing Quality Scores | Q30 ≥ 85% [37] | FASTQC, MultiQC [37] |
| Read Alignment Rate | Typically > 70-80% | STAR, kallisto, bustools [37] | |
| Cell-level QC | Genes detected per cell | Cell-type & protocol dependent; filter low [64] | Knee plots, classifier filters [37] |
| Mitochondrial Read Fraction | <10-20% (adjust based on biology) [37] | Distribution analysis in Seurat/Scanpy | |
| Doublet Rate | Method-dependent; ~1-10% [37] | Scrublet, DoubletFinder [37] | |
| Batch Effect | Mixing of Batches in Embeddings | No systematic separation by batch in UMAP [37] | Visual inspection, PCA correlation tests |
| Conservation of Biological Variance | Preserved cluster identity and known marker expression after integration [37] | Seurat, SCTransform, FastMNN, scVI [37] | |
| Biological Plausibility | Cell-Type Annotation Accuracy | Concordance with established marker genes and reference atlases [63] | Automated (Nygen, BBrowserX) & manual annotation |
| Marker Gene Expression | Cell-type specific markers are highly and exclusively expressed in the correct cluster [64] | Dot plots, violin plots, heatmaps | |
| Differential Expression Results | Statistically significant and biologically interpretable gene lists [64] | Welch's t-test, MAST, Wilcoxon rank-sum test |
Experimental Protocols for Key Validation Steps
Protocol 1: Systematic Quality Control and Filtering
- Objective: To remove low-quality cells, doublets, and ambient RNA, ensuring downstream analysis is performed on a high-quality cell population.
- Methodology:
- Calculate QC Metrics: For each cell barcode, compute:
nCount_RNA: Total number of transcripts (UMIs).nFeature_RNA: Number of unique genes detected.percent.mt: Percentage of transcripts mapping to the mitochondrial genome.
- Filter Empty Droplets: Use knee plots or classifier filters (e.g., in CellRanger) to set a minimum transcript threshold and distinguish real cells from background [37].
- Remove Low-Quality Cells: Filter out cells with low
nFeature_RNA(indicating poor capture) and highpercent.mt(indicating apoptosis or stress). Thresholds are experiment-specific but a good starting point isnFeature_RNA > 200andpercent.mt < 10-20%[37]. - Scrub Doublets: Use Scrublet or DoubletFinder to simulate artificial doublets and score each cell based on its proximity to these simulations. Remove cells with high doublet scores [37].
- Calculate QC Metrics: For each cell barcode, compute:
- Validation: Post-filtering, the distribution of QC metrics (
nFeature_RNA,nCount_RNA,percent.mt) should be tight and unimodal, indicating a homogeneous population of high-quality cells.
Protocol 2: Batch Effect Correction and Data Integration
- Objective: To merge multiple scRNA-seq datasets without technical variation obscuring biological signals.
- Methodology:
- Preprocessing: Normalize and log-transform the gene expression matrix for each batch individually. Identify highly variable genes (HVGs) within each batch.
- Select Integration Features: Identify a set of integration anchors—features that are variable across datasets but not driven by batch effects.
- Apply Integration Algorithm: Use a tool like Seurat's CCA integration, SCTransform, or FastMNN to find a shared subspace where the batch effects are minimized [37] [63].
- Visualize: Generate a UMAP plot on the integrated data.
- Validation:
- Statistical Fidelity: Cells of the same type from different batches should be intermingled on the UMAP, with no clear separation based on batch identity [37].
- Biological Plausibility: Known cell-type marker genes should show consistent expression across batches within the same cluster.
Protocol 3: Automated and Manual Cell Type Annotation
- Objective: To assign biological identities to the clusters identified in the analysis.
- Methodology:
- Find Cluster Markers: Perform differential expression analysis to identify genes that are significantly upregulated in each cluster compared to all others.
- Reference-Based Annotation (Automated): Input the normalized expression matrix into an AI-powered annotation tool like Nygen Insights or BBrowserX, which compares the data to curated reference atlases and provides cell-type predictions with confidence scores [63].
- Marker-Based Annotation (Manual): Cross-reference the list of significant marker genes for each cluster with canonical cell-type markers from literature and databases.
- Validation: The final annotation is validated by ensuring that the marker genes used for manual annotation are highly and specifically expressed in the assigned cluster, as visualized via dot plots or violin plots.
scRNA-seq Preprocessing and Validation Workflow
The Scientist's Toolkit: Essential Research Reagents and Solutions
| Tool / Reagent | Function / Explanation |
|---|---|
| Parse Biosciences' Trailmaker | A cloud-based platform for directly processing FASTQ files from Parse's combinatorial barcoding assays, handling alignment and initial QC [37] [63]. |
| CellRanger (10x Genomics) | The standard pipeline for processing FASTQ files from 10x Genomics assays into count matrices, performing barcode/qc, alignment, and UMI counting [37]. |
| Seurat | An comprehensive R toolkit for single-cell analysis, widely used for QC, normalization, integration, clustering, and differential expression [37] [63]. |
| Scanpy | A Python-based toolkit comparable to Seurat, designed for efficient analysis of large-scale single-cell data, including all standard preprocessing steps [63]. |
| Scrublet | A Python tool designed to identify and remove doublets from single-cell RNA-seq data by simulating artificial doublets [37]. |
| SoupX | An R package that estimates and subtracts the background "soup" of ambient RNA present in droplet-based scRNA-seq data [37]. |
| Nygen Analytics | A cloud platform with AI-powered features for automated cell annotation and biological insight generation, facilitating validation [63]. |
| BBrowserX | An analysis platform that provides access to the BioTuring Single-Cell Atlas, enabling cross-dataset comparison and validation of cell identities [63]. |
Frequently Asked Questions (FAQs)
Q1: What is the core purpose of the BioLLM framework in single-cell research? BioLLM is a unified framework designed to address the significant challenges posed by the heterogeneous architectures and coding standards of various single-cell Foundation Models (scFMs). It provides a standardized interface and APIs that enable seamless integration, streamlined model switching, and consistent benchmarking of diverse scFMs, allowing researchers to efficiently compare model performance and access different models without architectural inconsistencies [2].
Q2: What are the common data preprocessing errors that affect model integration in BioLLM? A frequent issue is tokenization inconsistency, where the method of converting raw gene expression data into model tokens (e.g., by ranking genes by expression level or binning expression values) does not align with the pretraining setup of the scFM. This leads to a input representation mismatch and degraded performance. Furthermore, inadequate quality control of the input single-cell RNA sequencing (scRNA-seq) data, such as failing to filter out low-quality cells or genes with zero counts across many cells, can introduce significant noise and bias the model's predictions [35].
Q3: My model's performance drops significantly during zero-shot evaluation in BioLLM. What could be the cause? This often stems from a pretraining and evaluation data domain gap. If the model was pretrained on data from specific tissues (e.g., immune cells) and is being evaluated on a different biological context (e.g., plant cells), its performance may lag behind models with more relevant pretraining. scGPT, for instance, has demonstrated robust performance across a variety of tasks in such settings [2]. Ensure you are utilizing the framework's standardized benchmarking tools to compare models on a level playing field and select the scFM whose pretraining corpus best matches your target data domain.
Q4: How does BioLLM handle the integration of models with different underlying architectures? BioLLM employs standardized APIs that act as an abstraction layer. This means that regardless of whether the underlying scFM uses a transformer, BERT, or another architecture, it can be integrated via a common interface. This eliminates architectural and coding inconsistencies, providing researchers with streamlined access and the ability to switch between models like scGPT, Geneformer, and scFoundation without altering their core analysis pipeline [2].
Q5: What is the recommended workflow for a fair comparative analysis of scFMs using BioLLM? The recommended workflow involves a structured, multi-stage process to ensure a fair and reproducible comparison, from initial setup to final performance reporting. The diagram below illustrates the key stages.
Detailed Experimental Protocol for Comparative Analysis
- Task Definition: Clearly define the downstream biological task (e.g., novel cell type annotation, in-silico perturbation prediction, batch effect correction) [33].
- Model Selection: Choose a set of scFMs available in BioLLM for comparison. The selection should be based on the task and documented pretraining strengths. For example, scGPT is a strong all-rounder, while Geneformer excels in gene-level tasks [2].
- Data Curation and Preprocessing:
- Obtain a standardized, high-quality evaluation dataset not seen during the models' pretraining.
- Apply a consistent preprocessing pipeline: perform quality control (filtering low-quality cells/genes), normalize gene expression counts, and select highly variable genes.
- Crucially, apply the correct tokenization strategy for each model as defined by the BioLLM framework for that specific scFM (e.g., ranking genes by expression for one model, using binning for another) [35].
- Benchmarking Execution:
- Utilize BioLLM's unified APIs to load each model.
- Evaluate each model in zero-shot (or few-shot) settings on the defined task.
- If applicable, perform parameter-efficient fine-tuning on a held-out training split of your data and then evaluate on a test split. BioLLM supports these training modes [2].
- Performance Quantification: Use the framework's built-in metrics to score model performance. This typically includes task-specific accuracy (e.g., cell type annotation accuracy) as well as general metrics like the area under the receiver operating characteristic curve (AUROC) for classification tasks.
- Results Reporting: Document the performance metrics for all models and tasks in a structured table to facilitate direct comparison. The table below provides a template based on findings from the literature.
Table 1: Example Performance Benchmark of scFMs Across Common Tasks (Adapted from Literature)
| Model | Zero-shot Annotation Accuracy (%) | Fine-tuning Performance (AUROC) | Perturbation Prediction Score | Notable Strengths |
|---|---|---|---|---|
| scGPT | High (e.g., >90% on diverse atlas) | High (e.g., >0.95) | Robust | Strong overall performer across all tasks [2] |
| Geneformer | Moderate | High | Moderate | Excels in gene-level tasks; effective pretraining [2] |
| scFoundation | Moderate | High | Moderate | Strong capabilities in gene-level tasks [2] |
| scBERT | Lower | Lower | Lower | Limited by smaller size and training data [2] |
Troubleshooting Guides
Issue 1: Tokenization and Input Representation Errors
Problem: The model fails to load or throws a shape or value error during inference. This is frequently a tokenization issue.
- Symptoms: Runtime errors related to tensor dimensions; model producing nonsensical or highly inaccurate outputs.
- Solution:
- Verify Tokenizer Configuration: Ensure you are using the tokenizer and input format specified by the specific scFM within BioLLM. Do not assume a one-size-fits-all approach.
- Check Gene Ordering: Some models require genes to be input in a specific order (e.g., by average expression). Confirm that your input data's gene sequence matches the model's expectation [35].
- Validate Special Tokens: Ensure that necessary special tokens (e.g.,
[CLS],[BOS], padding tokens) are correctly added to your input sequence as per the model's documentation in BioLLM.
Issue 2: Performance Degradation After Model Switching
Problem: You switch from one scFM to another within BioLLM, and performance drops unexpectedly, even on the same task and data.
- Symptoms: A significant decrease in metrics like accuracy or AUROC when a different model is selected.
- Solution:
- Consult the Benchmarking Table: First, refer to the framework's documentation or published benchmarks (like Table 1 above). The performance drop may be expected if the new model is less capable for your specific task [2].
- Re-evaluate Hyperparameters: Model-specific fine-tuning hyperparameters (learning rate, number of epochs) are not always transferable. Use BioLLM's benchmarking tools to perform a quick hyperparameter search for the new model.
- Inspect Pretraining Domain: Confirm that the new model's pretraining data is relevant to your biological context. A model pretrained only on human cancer cells may perform poorly on data from plant or mouse models [2] [33].
Issue 3: Inconsistent Benchmarking Results
Problem: Results from your evaluation are not reproducible, or differ from published benchmarks for the same model.
- Symptoms: High variance in performance metrics across repeated runs; scores that deviate significantly from literature values.
- Solution:
- Set Random Seeds: Enforce reproducibility by setting random seeds for all components of your pipeline (Python, NumPy, PyTorch/TensorFlow) at the beginning of your script.
- Confirm Data Splits: Ensure you are using the exact same training/validation/test splits as the benchmark you are comparing against. Using different splits is a common source of discrepancy.
- Validate Evaluation Metrics: Double-check that you are calculating evaluation metrics (e.g., accuracy, F1-score, AUROC) in the same way as the benchmark study. Standardized evaluation frameworks are critical for this consistency [65].
The Scientist's Toolkit: Essential Research Reagents
Table 2: Key Computational "Reagents" for scFM Training and Evaluation
| Item / Resource | Function / Purpose | Example Tools / Libraries |
|---|---|---|
| Standardized Preprocessing Pipelines | Ensures consistent quality control, normalization, and feature selection across datasets, which is critical for fair model comparison. | Scanpy, Seurat |
| Tokenization Schemes | Converts raw, non-sequential gene expression data into a structured sequence of tokens that the transformer-based model can process. | Gene ranking, expression binning [35] |
| Benchmarking Datasets | High-quality, curated datasets used for evaluating model performance on specific tasks like cell type annotation or perturbation prediction. | CZ CELLxGENE Discover [33], PanglaoDB [35] |
| Evaluation Metrics | Quantitative measures to assess and compare model performance across different tasks and datasets. | Accuracy, AUROC, Normalized Metrics (to mitigate answer-length bias) [65] |
| Unified API Framework | The core of BioLLM, providing a standardized interface to integrate, access, and switch between different scFMs seamlessly [2]. | BioLLM |
Experimental Protocol: Implementing a Custom Benchmarking Study
This protocol provides a step-by-step methodology for using BioLLM to conduct a novel comparative evaluation of scFMs on a user-defined task, such as cross-species cell annotation.
Objective: To benchmark the performance of scGPT, Geneformer, and scBERT on annotating cell types in a novel plant single-cell dataset using the BioLLM framework.
Workflow Overview:
Step-by-Step Methodology:
Data Acquisition and Initialization:
- Input: Obtain a novel plant scRNA-seq dataset with held-out ground truth labels for a subset of cells.
- Setup: Install the BioLLM package and confirm access to the required scFMs (scGPT, Geneformer, scBERT) as defined in the framework's documentation [2].
Data Preprocessing:
- Quality Control: Filter the dataset to remove cells with an unusually low number of detected genes and genes that are detected in very few cells.
- Normalization: Normalize the gene expression counts for each cell by the total counts, followed by a log-transformation. This helps to mitigate technical variation.
- Data Splitting: Split the dataset into a reference set (with labels) and a query set (where labels are withheld for prediction), ensuring balanced cell type representation.
Model Configuration via BioLLM:
- API Calls: Use BioLLM's standardized functions to load each model. The code structure will be consistent, but the framework will handle the underlying architectural differences.
- Example Pseudo-Code:
Execution of Zero-shot Evaluation:
- Inference: For each model, use the BioLLM inference API to predict the cell types for the query set based on the reference set. The framework manages the model-specific forward pass.
- Metric Calculation: Use BioLLM's built-in evaluation suite to compute the annotation accuracy for each model by comparing predictions to the held-out ground truth.
Data Analysis and Interpretation:
- Quantitative Analysis: Compile the accuracy results into a summary table. Perform statistical tests to determine if performance differences between models are significant.
- Qualitative Analysis: Use dimensionality reduction (e.g., UMAP) to visualize the model's latent space and inspect any cell populations that were frequently misannotated, which can provide biological insights into model limitations.
Zero-Shot vs. Fine-Tuning Performance as a Metric for Preprocessing Quality
Troubleshooting Guide: Diagnosing Preprocessing Issues via Model Performance
This guide helps you diagnose data preprocessing problems in your single-cell Foundation Model (scFM) pipeline by analyzing the performance gap between zero-shot and fine-tuned models.
Q1: A large performance gap exists between zero-shot and fine-tuned models. Does this definitely indicate a preprocessing problem?
A large gap is expected, as fine-tuned models consistently outperform zero-shot models. [66] [67] However, an unusually large gap, or poor zero-shot performance on simple tasks, can signal preprocessing issues. You should investigate further if you observe:
- Poor Zero-shot Embedding Quality: Cell embeddings fail to separate known cell types in UMAP visualizations. [52]
- Fine-tuning Fails to Improve Performance: The model shows minimal improvement even after extensive fine-tuning, suggesting it cannot learn meaningful patterns from the preprocessed data. [66]
Q2: My zero-shot model performs well on internal validation data but poorly on external datasets. What preprocessing factors should I check?
This often indicates a failure to generalize, frequently caused by batch effects or data distribution shifts that preprocessing failed to address. [52] [32] Focus your checks on:
- Batch Effect Correction: Verify that your preprocessing pipeline includes and correctly applies methods to remove technical variation from different experiments or technologies. [52]
- Data Quality and Consistency: Ensure the data quality and filtering criteria for your external dataset match those used during the model's pretraining. Inconsistencies can severely impact zero-shot performance. [1] [52]
Q3: After preprocessing, my fine-tuned model is overfitting. Could the preprocessing be at fault?
Yes, overly aggressive preprocessing can cause overfitting. This happens when the preprocessing step removes biologically meaningful variation, forcing the model to learn from noise. To diagnose:
- Compare with Simplifier Preprocessing: Re-run your pipeline with less aggressive filtering and normalization. If overfitting reduces, your original preprocessing was likely too strict.
- Analyze Input Gene Diversity: Check if preprocessing has narrowed the input gene set too severely. Models like scGPT show that embedding quality can improve with longer, more diverse gene input sequences. [52]
Performance Data and Experimental Protocols
The following tables summarize key quantitative findings from benchmarking studies, which can serve as references for evaluating your own model's performance.
Table 1: Comparison of LLM Approaches for an NLP Task (Entity Extraction from Tweets) [67]
| Learning Technique | Reported Accuracy | Key Characteristics |
|---|---|---|
| Zero-Shot Learning | 19% | No task-specific examples; high ambiguity in prompt leads to poor performance. |
| Few-Shot Learning | 97% | Provided with ~100 concrete examples in prompt; highly sensitive to prompt quality and example selection. |
| Fine-Tuning | 91% | Retrained on a dataset of 100 examples; creates a dedicated model for the task. |
Table 2: Benchmarking of Single-Cell Foundation Models (scFMs) on Cell Embedding Quality [52]
| Model | Zero-Shot Performance (ASW) | Fine-Tuned Performance | Key Findings |
|---|---|---|---|
| scGPT | Consistently outperforms other models | Significantly enhanced | Captures complex cellular features; embedding quality improves with longer input gene sequences. |
| Geneformer | Distinguishes certain cell types | Information not provided | Shows strong capabilities in gene-level tasks. |
| scBERT | Exhibits particularly poor performance | Information not provided | Smaller model size and limited training data likely contribute to lower performance. |
Detailed Experimental Protocol: Evaluating Preprocessing via Embedding Quality
This protocol outlines how to use cell-type clustering of zero-shot embeddings to assess preprocessing efficacy. [52]
Objective: To evaluate whether a data preprocessing pipeline produces biologically coherent representations for scFMs.
Methodology:
- Apply Preprocessing: Run your raw single-cell RNA sequencing dataset through the preprocessing pipeline you wish to evaluate.
- Generate Zero-Shot Embeddings: Pass the preprocessed data through a pre-trained scFM (e.g., scGPT, Geneformer) without any fine-tuning to extract cell embeddings. [52]
- Cluster and Visualize:
- Perform clustering (e.g., using Leiden or Louvain algorithms) on the generated cell embeddings.
- Create a UMAP visualization colored by the resulting clusters and by known cell-type labels.
- Quantitative Assessment:
- Calculate the Average Silhouette Width (ASW) of the embeddings using the known cell-type labels. A higher ASW indicates better separation of cell types. [52]
- Compare the clustering results against the ground-truth cell-type annotations.
Interpretation: A successful preprocessing pipeline will result in embeddings where clusters closely align with known biological cell types, yielding a high ASW. Misalignment suggests the preprocessing may have removed biological signal or failed to correct for technical noise.
The Scientist's Toolkit: Essential Research Reagents & Materials
Table 3: Key Resources for scFM Research and Development
| Item / Resource | Function / Description | Example Tools / Platforms |
|---|---|---|
| Unified scFM Framework | Standardizes model interfaces and evaluation; enables seamless switching and benchmarking of different scFMs. | BioLLM framework [52] |
| Benchmarking Suite | Provides standardized frameworks and metrics for systematic evaluation of scFMs on specific tasks. | PertEval-scFM [32] |
| Curated Data Repositories | Provide large-scale, diverse single-cell datasets essential for pretraining and evaluating scFMs. | CZ CELLxGENE; Human Cell Atlas; Gene Expression Omnibus (GEO) [1] |
| Pre-trained Model Checkpoints | Off-the-shelf models that can be used directly for zero-shot inference or as a starting point for fine-tuning. | scBERT, Geneformer, scGPT, scFoundation [52] |
Workflow and Diagnostic Diagrams
The following diagrams illustrate the core diagnostic workflow and the relationship between preprocessing and model performance.
Diagnosing Preprocessing Quality Workflow
How Preprocessing Influences Performance Metrics
Frequently Asked Questions
Q1: Why does my scFM model produce biologically irrelevant cell embeddings? The quality of cell embeddings is highly dependent on the input data quality and the model's architectural strengths. Models can struggle with noisy data or batch effects. For instance, scGPT has demonstrated a consistent ability to generate biologically relevant embeddings that separate cell types effectively, while other models like scBERT may produce less distinct clusters [52]. Ensuring proper data preprocessing and selecting a model known for strong embedding performance is crucial.
Q2: How can I correct for batch effects using an scFM in a zero-shot setting? Our evaluation indicates that performance varies significantly by model. In a zero-shot setting, scGPT has been shown to outperform other foundation models and even traditional PCA in mitigating batch effects, as measured by average silhouette width (ASW) scores that incorporate both cell-type and batch information [52]. If batch effect correction is a primary goal, scGPT is the recommended starting point. For the most robust correction, fine-tuning the model on your specific data is advised [52].
Q3: My perturbation effect predictions are inaccurate. Are scFMs unsuitable for this task? Current research suggests that zero-shot scFM embeddings do not consistently provide improvements over simpler baseline models for predicting transcriptional responses to perturbations, particularly when the data distribution shifts or for strong/atypical effects [32]. This appears to be a general limitation of current-generation scFMs for this specific task. You may need to investigate specialized models or ensure your training data encompasses a broader range of cellular states.
Q4: Does the number of input genes (sequence length) impact my results? Yes, the input gene sequence length can significantly impact embedding quality, and this effect varies by model. Studies show that scGPT's performance generally improves with longer input sequences, allowing it to capture richer information. In contrast, scBERT's performance has been observed to decline as input length increases, and Geneformer and scFoundation may show minimal correlation or a slight negative trend [52]. You should optimize the input length for your chosen model.
Q5: How do I choose the right scFM for my computational budget and task? The choice involves a clear trade-off between computational cost and performance across different tasks. The table below summarizes key quantitative findings to guide your selection.
Table 1: Performance and Resource Trade-offs of Leading scFMs
| Model | Cell Embedding Quality (ASW) | Batch Effect Correction | Impact of Input Length | Computational Efficiency (Memory & Time) |
|---|---|---|---|---|
| scGPT | Consistently superior [52] | Best performance [52] | Positive correlation [52] | High [52] |
| Geneformer | Strong on gene-level tasks [52] | Distinguishes certain cell types [52] | Slight negative correlation (in some cases) [52] | High [52] |
| scFoundation | Strong on gene-level tasks [52] | Distinguishes certain cell types [52] | Slight negative correlation (in some cases) [52] | Lower [52] |
| scBERT | Lags behind other models [52] | Poor performance [52] | Negative correlation [52] | Lower [52] |
Troubleshooting Guides
Issue: Poor Cell Type Separation in Embeddings
Problem: After generating cell embeddings with your scFM, visualization (e.g., UMAP) shows poor separation of known cell types.
Diagnosis Steps:
- Verify Data Preprocessing: Ensure your input data has undergone rigorous quality control. The framework BioLLM provides a decision-tree-based preprocessing interface for this purpose [52].
- Check Model Suitability: Consult performance benchmarks. If you are using a model like scBERT, know that it may inherently produce less distinct embeddings compared to scGPT [52].
- Investigate Input Length: Experiment with the number of top-expressed genes used as input. For scGPT, try increasing the input gene sequence length, as this has been shown to improve embedding accuracy [52].
Resolution:
- Primary Solution: Switch to a model with proven superior embedding capabilities, such as scGPT, and ensure you use its recommended input gene length [52].
- Alternative Solution: If model switching is not possible, implement a fine-tuning step on your dataset using available cell-type labels. Supervised fine-tuning has been proven to significantly enhance the quality of cell embeddings for all models [52].
Issue: High Computational Resource Consumption
Problem: The model training or inference is too slow, or memory usage is prohibitively high.
Diagnosis Steps:
- Profile Resource Usage: Identify the bottleneck—is it GPU memory or computation time?
- Benchmark Against Known Metrics: Compare your resource usage with published data. Evaluations show that scGPT and Geneformer offer superior efficiency in terms of memory and computational time compared to scBERT and scFoundation [52].
Resolution:
- Model Selection: For large-scale analyses, prioritize models known for high computational efficiency, such as scGPT or Geneformer [52].
- Input Optimization: Reduce the input gene sequence length, as this can decrease memory and compute requirements for all models. Be aware that this may impact performance, especially for scGPT [52].
- Framework Utilization: Use a standardized framework like BioLLM, which provides optimized, standardized APIs for model access and can help streamline operations [52].
Experimental Protocols for scFM Evaluation
Protocol 1: Evaluating Cell Representation Capacity
Objective: To assess the biological relevance of cell embeddings generated by an scFM in a zero-shot setting.
Methodology:
- Input: Processed single-cell RNA-seq data (count matrix).
- Embedding Extraction:
- Evaluation Metric:
- Calculate the Average Silhouette Width (ASW) using known cell-type labels. A high ASW indicates quality embeddings that capture biological differences [52].
- Visualization:
- Generate UMAP plots from the embeddings to visually inspect cell-type separation [52].
Table 2: Key Research Reagent Solutions for scFM Analysis
| Item / Resource | Function in Experiment | Specific Examples / Notes |
|---|---|---|
| Standardized Framework | Provides unified APIs for model integration, switching, and consistent benchmarking. | BioLLM [52] |
| Benchmarking Suite | Offers a standardized framework for evaluating specific tasks like perturbation prediction. | PertEval-scFM [32] |
| Pre-training Data Corpora | Large, diverse collections of single-cell data for training or validating model generalizability. | CZ CELLxGENE, Human Cell Atlas, PanglaoDB [1] |
| Evaluation Metric | Quantifies the quality of clustering in the latent embedding space. | Average Silhouette Width (ASW) [52] |
| Visualization Tool | Reduces dimensionality of embeddings for visual assessment of cell-type separation. | UMAP (Uniform Manifold Approximation and Projection) [52] |
Protocol 2: Benchmarking Perturbation Effect Prediction
Objective: To test an scFM's ability to predict transcriptional changes after a genetic or chemical perturbation in a zero-shot setting.
Methodology:
- Input: Control and perturbed single-cell gene expression profiles.
- Prediction:
- Evaluation:
- Compare the model's predicted expression changes against the ground-truth experimental data from the perturbed cells.
- Assess performance both on in-distribution data and under distribution shift to test robustness [32].
Workflow Visualization
The following diagram illustrates the core analytical workflow for evaluating single-cell Foundation Models, as implemented in frameworks like BioLLM.
Standardized scFM Evaluation Workflow
This workflow highlights the critical steps from raw data to comparative analysis, emphasizing standardized preprocessing and multiple, simultaneous evaluation metrics.
The Scientist's Toolkit
Table 3: Essential Computational Tools & Frameworks for scFM Research
| Tool / Framework | Primary Function | Application Context |
|---|---|---|
| BioLLM | A unified framework with standardized APIs for integrating and applying diverse scFMs [52]. | General model benchmarking, seamless model switching, and consistent evaluation across tasks like cell-type annotation and drug response prediction [52]. |
| PertEval-scFM | A standardized benchmark for evaluating scFMs on perturbation effect prediction [32]. | Specifically designed to assess model performance in predicting transcriptional responses to genetic or chemical perturbations in a zero-shot setting [32]. |
| scGPT | A specific single-cell Foundation Model based on a generative transformer architecture [52]. | Recommended for tasks requiring high-quality cell embeddings and effective batch-effect correction [52]. |
| Geneformer | A single-cell Foundation Model recognized for strong performance on gene-level tasks [52]. | Applied in analyses focused on gene regulatory networks and gene-level inferences [52]. |
Frequently Asked Questions (FAQs)
Q1: My single-cell foundation model (scFM) achieves high technical scores on benchmark tasks, but fails to generate novel biological insights for my specific disease model. What could be wrong?
This is a classic sign of a model that is overfitting to general technical benchmarks but lacks the specific, high-quality data required for novel discovery. A recent benchmark study, PertEval-scFM, found that zero-shot scFM embeddings did not consistently outperform simpler baseline models for the critical discovery task of perturbation effect prediction [32]. The issue often lies in the training data composition and preprocessing. If the model was pretrained on a broad, general corpus of single-cell data, it may not capture the nuanced cellular states relevant to your specific research question [1]. Furthermore, inconsistencies in data quality and technical noise from the diverse sources of public data used for pretraining can prevent the model from learning the underlying biological signals necessary for discovery [1].
Q2: What is a "closed-loop" framework for scFMs, and how can it improve my discovery outcomes?
A "closed-loop" framework is an iterative process that enhances a standard scFM by incorporating experimental perturbation data during model fine-tuning [68]. This directly addresses the utility gap by allowing the model to learn from real experimental results, thereby refining its predictive capabilities.
The workflow is as follows [68]:
- Start with a foundation model pretrained on a broad single-cell corpus.
- Fine-tune it on your specific control and experimental data (e.g., diseased vs. healthy cells).
- Use this model for in silico perturbation (ISP) to generate predictions (e.g., which gene knockout might rescue a disease state).
- Crucially, conduct wet-lab experiments to validate these top predictions.
- Feed the experimental results (the "closed-loop" data) back into the model for further fine-tuning.
This approach has been shown to dramatically improve prediction accuracy. In one study, it increased the Positive Predictive Value (PPV) for perturbation effects three-fold, from 3% to 9%, while also boosting sensitivity and specificity [68].
Q3: What are the most critical data preprocessing steps to ensure my scFM is useful for drug target discovery?
For high-stakes tasks like drug target discovery, preprocessing must go beyond standard practices to ensure biological fidelity. Key steps include:
- Tokenization Strategy: Choose a tokenization method (e.g., ranking genes by expression, binning) that preserves the biological relationships you aim to study [1].
- Aggressive Batch Effect Mitigation: Technical variation between datasets can obscure true biological signals. Use specialized normalization or incorporate batch information as special tokens during training [1].
- Rigorous Outlier Handling: Identify and correct for outliers that may represent technical artifacts rather than rare cell states, as these can skew model representations [18] [69].
- Data Quality over Quantity: Prioritize high-quality, well-annotated datasets for fine-tuning, even if they are smaller. A model fine-tuned on a small set of pristine, relevant data will likely outperform a model trained on massive, noisy data for a specific discovery task [1] [68].
Troubleshooting Guides
Problem: Poor Performance on Perturbation Effect Prediction
Symptoms: Your scFM cannot accurately predict transcriptional responses to genetic or chemical perturbations. Its predictions do not align with subsequent experimental validation.
Investigation & Resolution Protocol:
Step 1: Benchmark Against Baselines Compare your model's performance against simpler baseline methods, such as differential expression analysis, using a standardized framework like PertEval-scFM [32]. This will quantify the performance gap. The table below summarizes potential outcomes based on the benchmark findings [32]:
Table: Benchmarking scFM Performance for Perturbation Prediction
Scenario Model Performance vs. Baseline Suggested Interpretation 1 Underperforms or matches baseline The current scFM embeddings do not provide an advantage for this specific task. 2 Outperforms on common perturbations but fails on strong/atypical ones The model struggles with distribution shift and may be overfitted to its training data. 3 High negative predictive value but low positive predictive value The model is good at identifying what won't work but poor at proposing what will. Step 2: Implement a Closed-Loop Fine-Tuning Pipeline If your model aligns with Scenario 1 or 3 above, move beyond "open-loop" prediction. Integrate any existing experimental perturbation data you have, even a small amount, to fine-tune the model. Research shows that even 10-20 perturbation examples can lead to substantial improvements in prediction accuracy [68].
Step 3: Audit Training Data Composition Analyze the datasets used to pretrain or fine-tune your model. A lack of diversity in cell types, conditions, or perturbation types can limit the model's generalizability. Actively seek out or generate data to fill these compositional gaps [70] [1].
Problem: Model Fails to Generalize to Rare Disease Cell States
Symptoms: The scFM performs well on common cell types but generates unreliable or nonsens predictions when applied to cells from a rare disease model or a poorly characterized cell lineage.
Investigation & Resolution Protocol:
Step 1: Engineer a Task-Specific In Silico HSC Model For diseases like RUNX1-Familial Platelet Disorder, create a dedicated model by fine-tuning a general scFM (e.g., Geneformer) on scRNA-seq data from engineered human Hematopoietic Stem Cells (HSCs) that carry the relevant mutation [68].
Step 2: Perform In Silico Perturbation (ISP) Screening Use the fine-tuned model to run a virtual screen. Simulate knocking out or overexpressing thousands of genes to identify those that shift the diseased HSCs toward a healthy, control-like state [68].
Step 3: Triangulate Predictions with Complementary Methods Increase confidence in the ISP results by integrating predictions from other methods. For example, cross-reference the list of genes from ISP with those identified by traditional differential expression analysis. Genes highlighted by both methods constitute high-confidence candidates [68].
Step 4: Experimental Validation and Loop Closure The most critical step. Take the top candidate genes and test them in a wet-lab experiment. The results from this validation are then used to further fine-tune the model, "closing the loop" and enhancing its predictive power for the next round of discovery [68].
Key Experimental Protocols
Protocol: Closed-Loop Framework for Target Discovery
Objective: To iteratively improve an scFM's accuracy in predicting therapeutic targets for a genetic disorder.
Methodology:
- Foundation Model Selection: Start with a pretrained scFM, such as Geneformer [68].
- Initial Fine-Tuning: Fine-tune the model to distinguish between diseased and control cells using your specific scRNA-seq dataset [68].
- Open-Loop ISP & Candidate Prioritization: a. Perform in silico perturbation across the genome. b. Prioritize genes whose perturbation shifts the diseased state toward control. c. Cross-reference with differential expression results to shortlist high-confidence targets [68].
- Experimental Validation: a. Select candidate genes with available inhibitors or activators. b. Test these candidates in your cellular disease model (e.g., using CRISPRi/a or small molecules) and measure the outcome with scRNA-seq or functional assays [68].
- Closed-Loop Fine-Tuning: a. Incorporate the new experimental perturbation data (labeled with the outcome, e.g., "shifted to control" or "no change") into the training dataset. b. Re-fine-tune the scFM on this augmented dataset. This teaches the model the difference between its correct and incorrect predictions [68].
Expected Outcomes:
- A significant increase in the Positive Predictive Value (PPV) of the model's predictions. One application saw a rise from 3% to 9% PPV [68].
- Identification of novel, high-confidence therapeutic targets and pathways. The same study identified pathways like mTOR and protein kinase C as potential targets in a rare blood disorder [68].
Protocol: Data Preprocessing for Robust scFM Fine-Tuning
Objective: To prepare single-cell data for model fine-tuning in a way that maximizes biological signal and minimizes technical noise.
Methodology:
- Data Acquisition and Integration: Gather scRNA-seq datasets from public repositories (e.g., CELLxGENE, GEO) and in-house experiments [1].
- Quality Control and Cleaning: a. Filter out low-quality cells and genes. b. Identify and handle outliers that are likely technical artifacts [18] [69].
- Normalization and Scaling: Apply scaling methods (e.g., Standard Scaler, Robust Scaler) to normalize gene expression values across cells, making them suitable for distance-based algorithms and reducing the influence of outliers [18].
- Tokenization: Convert the normalized gene expression matrix into a sequence of tokens that the transformer model can process. Common strategies include: a. Ranking genes by expression level within each cell [1]. b. Binning expression values [1].
- Data Splitting: Split the processed dataset into training, validation, and test sets, ensuring that cells from the same experimental batch are not disproportionately represented in a single split to prevent data leakage [18].
The Scientist's Toolkit
Table: Essential Reagents and Resources for scFM-Driven Discovery
| Item Name | Type | Function & Application | Example/Reference |
|---|---|---|---|
| Geneformer | Pretrained scFM | A foundation model for in silico perturbation prediction; can be fine-tuned for specific tasks. | [68] |
| PertEval-scFM | Benchmarking Framework | A standardized framework to evaluate scFMs for perturbation effect prediction against baselines. | [32] |
| CZ CELLxGENE | Data Repository | Provides unified access to millions of annotated single-cell datasets for model pretraining and validation. | [1] |
| scGPT / scBERT | scFM Architecture | Examples of transformer-based models designed for single-cell data analysis and cell type annotation. | [1] |
| Perturb-seq Data | Experimental Dataset | Single-cell RNA sequencing data from genetic perturbation screens; essential for closed-loop fine-tuning. | [68] |
| Robust Scaler | Preprocessing Tool | A scaling method that uses median and interquartile range, ideal for datasets with outliers. | [18] |
Data Preprocessing Pipeline Visualization
Conclusion
The development of powerful single-cell foundation models is intrinsically linked to the robustness of their data preprocessing pipelines. A successful strategy must move beyond simply aggregating the largest possible dataset and instead focus on the intentional composition of diverse, high-quality training data that adequately represents the developmental hierarchy of cell states. By mastering foundational concepts, implementing rigorous methodological steps, proactively troubleshooting for bias and generalization, and employing consistent validation frameworks, researchers can build preprocessing pipelines that unlock the full potential of scFMs. The future of biomedical research hinges on these models, which promise to deliver deeper insights into cellular function, disease mechanisms, and accelerate the pipeline for novel therapeutic development.
References
- 1. Single-cell foundation models: bringing artificial ... - Nature [https://www.nature.com/articles/s12276-025-01547-5]
- 2. Article BioLLM: A standardized framework for integrating ... [https://www.sciencedirect.com/science/article/pii/S2666389925001746]
- 3. Efficient Fine-Tuning of Single-Cell Foundation Models ... [https://arxiv.org/html/2412.13478v2]
- 4. Biology-driven insights into the power of single-cell foundation ... [https://genomebiology.biomedcentral.com/articles/10.1186/s13059-025-03781-6]
- 5. Efficient and Effective Foundation Model on Single Cell Data [https://arxiv.org/html/2504.16956v1]
- 6. CZ CELLxGENE Discover - Cellular Visualization Tool [https://cellxgene.cziscience.com/]
- 7. CZ CELLxGENE Discover Census [https://chanzuckerberg.github.io/cellxgene-census/]
- 8. HCA Data Portal - Human Cell Atlas [https://data.humancellatlas.org/]
- 9. Human Cell Atlas [https://www.humancellatlas.org/]
- 10. Public RNA-Seq and scRNA-Seq Databases [https://bigomics.ch/blog/ultimate-guide-to-public-rnaseq-and-sc-rna-seq-databases/]
- 11. Guidelines for reporting single-cell RNA-seq experiments [https://pmc.ncbi.nlm.nih.gov/articles/PMC9302581/]
- 12. A Systematic Overview of Single-Cell Transcriptomics ... [https://pmc.ncbi.nlm.nih.gov/articles/PMC11065044/]
- 13. Tutorial: guidelines for the computational analysis of single ... [https://www.nature.com/articles/s41596-020-00409-w]
- 14. Data normalization for addressing the challenges in the ... [https://bmcgenomics.biomedcentral.com/articles/10.1186/s12864-024-10364-5]
- 15. Single-cell RNA-seq Data Normalization [https://www.10xgenomics.com/analysis-guides/single-cell-rna-seq-data-normalization]
- 16. BiRNA-BERT allows efficient RNA language modeling with ... [https://www.nature.com/articles/s42003-025-08982-0]
- 17. A novel deep learning framework with dynamic ... [https://pmc.ncbi.nlm.nih.gov/articles/PMC12204613/]
- 18. Data Preprocessing in Machine Learning: Steps & Best ... [https://lakefs.io/blog/data-preprocessing-in-machine-learning/]
- 19. What's new in the FDA's 2025 AI/ML draft guidance? [https://blogs.atlas-compliance.ai/whats-new-in-the-fdas-2025-ai-ml-draft-guidance/]
- 20. Data Preprocessing Techniques and Steps - MATLAB & ... [https://www.mathworks.com/discovery/data-preprocessing.html]
- 21. The generalizability of pre-processing techniques on ... [https://www.sciencedirect.com/science/article/abs/pii/S0378778822003759]
- 22. When to Use Contrast as a Preprocessing Step [https://blog.roboflow.com/when-to-use-contrast-as-a-preprocessing-step/]
- 23. Antibodies 101: Single Chain Fragment Variables (scFvs) [https://blog.addgene.org/antibodies-101-single-chain-fragment-variables-scfvs]
- 24. Tokenization and deep learning architectures in genomics [https://pmc.ncbi.nlm.nih.gov/articles/PMC12356405/]
- 25. Distinguishing word identity and sequence context in DNA ... [https://bmcbioinformatics.biomedcentral.com/articles/10.1186/s12859-024-05869-5]
- 26. Applications of machine learning in drug discovery and ... [https://pmc.ncbi.nlm.nih.gov/articles/PMC6552674/]
- 27. Gene selection with multiple ordering criteria - PMC [https://pmc.ncbi.nlm.nih.gov/articles/PMC1829166/]
- 28. Using hierarchical modeling to get more stable rankings of ... [https://statmodeling.stat.columbia.edu/2025/07/30/using-hierarchical-modeling-to-get-more-stable-rankings-of-gene-expression/]
- 29. Ten simple rules to colorize biological data visualization - PMC [https://pmc.ncbi.nlm.nih.gov/articles/PMC7561171/]
- 30. Better Color Scales for Gene Expression Plots [https://singlecell.broadinstitute.org/single_cell/features/2021-12-09-better-color-scales-for-genetic-expression-plots]
- 31. Five Steps to a Diverging and Contrasting Color Scheme for ... [https://nightingaledvs.com/five-steps-to-a-diverging-and-contrasting-color-scheme-for-data-visualization/]
- 32. PertEval-scFM: Benchmarking Single-Cell Foundation ... [https://openreview.net/forum?id=MWP9V0Ej0d]
- 33. Transformative advances in single-cell omics: a ... [https://translational-medicine.biomedcentral.com/articles/10.1186/s12967-025-07091-0]
- 34. Biology-driven insights into the power of single-cell ... [https://pmc.ncbi.nlm.nih.gov/articles/PMC12492631/]
- 35. Single-cell foundation models: bringing artificial ... [https://pmc.ncbi.nlm.nih.gov/articles/PMC12586647/]
- 36. Highly effective batch effect correction method for RNA-seq ... [https://pmc.ncbi.nlm.nih.gov/articles/PMC11718288/]
- 37. Getting Started with scRNA-seq: Post-Sequencing Data ... [https://www.parsebiosciences.com/blog/getting-started-with-scrna-seq-post-sequencing-data-analysis/]
- 38. A multiplex single-cell RNA-Seq pharmacotranscriptomics ... [https://www.nature.com/articles/s41589-024-01761-8]
- 39. Health Data Interoperability & Integration in 2025 [https://talencio.com/breaking-barriers-health-data-interoperability-integration-in-2025/]
- 40. Text has enhanced contrast | ACT Rule | WAI [https://www.w3.org/WAI/standards-guidelines/act/rules/09o5cg/]
- 41. Contrast requirements for WCAG 2.2 Level AA [https://www.makethingsaccessible.com/guides/contrast-requirements-for-wcag-2-2-level-aa/]
- 42. Text color must provide high contrast with its background [https://docs.acquia.com/web-governance/text-color-must-provide-high-contrast-its-background]
- 43. CellMemory: hierarchical interpretation of out-of-distribution ... [https://pmc.ncbi.nlm.nih.gov/articles/PMC12183866/]
- 44. Simulating a Bias Mitigation Scenario in Large Language ... [https://arxiv.org/html/2509.14438v1]
- 45. Optimizing preprocessing and analysis pipelines for single ... [https://pmc.ncbi.nlm.nih.gov/articles/PMC4898950/]
- 46. Systematic evaluation of fMRI data-processing pipelines for ... [https://www.nature.com/articles/s41467-024-48781-5]
- 47. Examining the impact of bias mitigation algorithms on ... [https://www.sciencedirect.com/science/article/pii/S0164121225001268]
- 48. Cell-type annotation with accurate unseen ... - PubMed Central [https://pmc.ncbi.nlm.nih.gov/articles/PMC10335708/]
- 49. "Invisible" Cell Types and Gene Expression Revealed with ... [https://neuroscience.caltech.edu/news/invisible-cell-types-and-gene-expression-revealed-with-sequencing-data-analysis-improvement]
- 50. MULTI- seq Sample Multiplexing for Single Cell Analysis and Sequencing [https://www.sigmaaldrich.com/TD/en/technical-documents/technical-article/genomics/sequencing/multi-seq-sample-multiplexing-single-cell-analysis-sequencing]
- 51. Mastering LLM Techniques: Text Data Processing [https://developer.nvidia.com/blog/mastering-llm-techniques-data-preprocessing/]
- 52. BioLLM: A standardized framework for integrating and ... [https://pmc.ncbi.nlm.nih.gov/articles/PMC12365531/]
- 53. 3 Questions: The pros and cons of synthetic data in AI [https://news.mit.edu/2025/3-questions-pros-cons-synthetic-data-ai-kalyan-veeramachaneni-0903]
- 54. Why Synthetic Data Is Taking Over in 2025: Solving AI's Data ... [https://humansintheloop.org/why-synthetic-data-is-taking-over-in-2025-solving-ais-data-crisis/]
- 55. Optimizing Healthcare AI Data Pipelines in 2025 [https://edenlab.io/blog/healthcare-ai-data-pipeline-optimization]
- 56. A Comprehensive Guide to Data Preprocessing [https://neptune.ai/blog/data-preprocessing-guide]
- 57. Prefect: Pythonic, Modern Workflow Orchestration For ... [https://www.prefect.io/]
- 58. What is workflow orchestration? Enterprise automation at ... [https://www.bmc.com/blogs/workflow-orchestration/]
- 59. Contact Center Architecture: How Contact Centers Work [https://www.nextiva.com/blog/contact-center-architecture.html]
- 60. Fine-tune small models with LLM insights - a CFM case study [https://huggingface.co/blog/cfm-case-study]
- 61. How to optimize data for training LLMs | by Tales Matos [https://medium.com/@rtales/how-to-optimize-data-for-training-llms-a39a4e508fca]
- 62. Self-Consistency Training for Density-Functional-Theory ... [https://arxiv.org/html/2403.09560v2]
- 63. Powerful scRNA-seq Data Analysis Tools in 2025 [https://www.nygen.io/resources/blog/single-cell-scrna-seq-multi-omics-data-analysis-tools]
- 64. evanpeikon/scRNA-seq-guide: A DIY Guide To Single-Cell ... [https://github.com/evanpeikon/scRNA-seq-guide]
- 65. Standardized Evaluation Frameworks [https://www.emergentmind.com/topics/standardized-evaluation-frameworks]
- 66. Fine-Tuned 'Small' LLMs (Still) Significantly Outperform ... [https://arxiv.org/html/2406.08660v1]
- 67. Zero-Shot Learning vs. Few-Shot Learning vs. Fine-Tuning [https://labelbox.com/guides/zero-shot-learning-few-shot-learning-fine-tuning/]
- 68. Closing the loop: Teaching single-cell foundation models to ... [https://pmc.ncbi.nlm.nih.gov/articles/PMC12265564/]
- 69. Data Preprocessing and Feature Engineering for Data Mining [https://www.mdpi.com/2673-2688/6/10/257]
- 70. microsoft/scFM-datamix: Assessing the influence of training ... [https://github.com/microsoft/scFM-datamix]