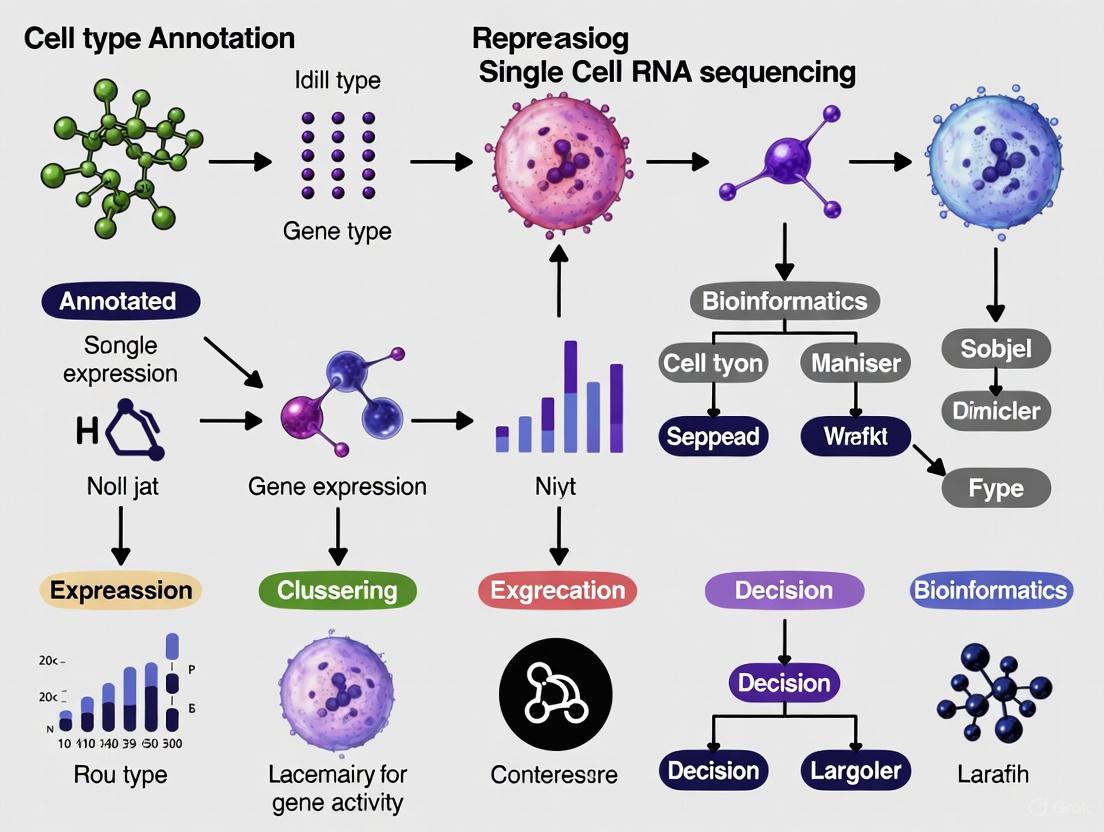
Cell Type Annotation in Single-Cell RNA Sequencing: From Foundational Concepts to AI-Powered Methods
Cell type annotation is a fundamental yet challenging step in single-cell RNA sequencing (scRNA-seq) analysis, bridging computational clustering results to biological meaning by identifying the cell types present in a...
Cell Type Annotation in Single-Cell RNA Sequencing: From Foundational Concepts to AI-Powered Methods
Abstract
Cell type annotation is a fundamental yet challenging step in single-cell RNA sequencing (scRNA-seq) analysis, bridging computational clustering results to biological meaning by identifying the cell types present in a dataset. This article provides a comprehensive guide for researchers and drug development professionals, covering the foundational principles of why annotation is critical for interpreting cellular heterogeneity. We explore the full spectrum of annotation methodologies, from manual expert curation and reference-based algorithms to the latest AI and large language models (LLMs) like GPT-4 and Claude 3.5. The guide also addresses common troubleshooting scenarios, optimization strategies for complex data, and a comparative analysis of tool performance and validation techniques to ensure biologically accurate and reproducible results.
What is Cell Type Annotation? Defining the Cornerstone of scRNA-seq Analysis
In single-cell RNA sequencing (scRNA-seq) research, cell type annotation represents the critical, non-trivial step of assigning biological identities to computationally derived cell clusters. This process transforms abstract groupings of cells, based on gene expression similarity, into biologically meaningful categories such as "T-cells" or "neurons." The core challenge lies in ensuring that these computational labels accurately reflect true biological states, a task complicated by biological complexity, technical artifacts, and the limitations of analytical methods. As the field progresses toward constructing comprehensive cellular atlases and applying these techniques in clinical contexts, the reliability of cell type annotation becomes paramount for generating biologically valid and reproducible insights [1] [2].
The Foundational Steps: From Raw Data to Cell Clusters
Before biological meaning can be assigned, scRNA-seq data must undergo extensive preprocessing to ensure subsequent analysis works with high-quality, technically comparable data. This foundational phase establishes the computational clusters that will later require biological interpretation.
Quality Control and Data Filtering
The initial quality control (QC) stage focuses on distinguishing viable cells from artifacts using three key metrics: the number of counts per barcode (count depth), the number of genes per barcode, and the fraction of counts from mitochondrial genes per barcode. The distributions of these QC covariates are examined for outlier barcodes that are subsequently filtered out through thresholding. Barcodes with low count depth, few detected genes, and high mitochondrial fraction often indicate dying cells or cells with broken membranes, while those with unexpectedly high counts and gene numbers may represent multiple cells captured together (doublets or multiplets). These three QC covariates must be considered jointly, as considering them in isolation can lead to misinterpretation; for example, cells with high mitochondrial counts might be involved in respiratory processes rather than being low quality [3].
Normalization, Feature Selection, and Dimensionality Reduction
Following QC, the data undergoes normalization to remove technical biases, such as those arising from varying count depths between cells. This enables meaningful comparison of gene expression across cells. Feature selection then identifies highly variable genes that contribute most to biological heterogeneity, reducing noise from genes with minimal variation. Dimensionality reduction techniques like Principal Component Analysis (PCA) further condense the data while preserving essential biological signals. These steps collectively produce a refined dataset ready for clustering [3].
Clustering: Identifying Computational Cell Groups
Clustering algorithms group cells based on similarity in their gene expression profiles, forming the computational clusters that require biological annotation. Popular methods include Leiden and Louvain clustering, which operate on a graph of cells and their nearest neighbors. The resulting clusters are often visualized using UMAP or t-SNE embeddings, providing an intuitive visual representation of the relationships between cell groups. At this stage, however, these clusters remain computational entities without biological labels—they represent patterns in the data, not yet understood biological cell types [3] [4].
Table 1: Key Steps in Generating Computational Clusters
| Processing Step | Key Methods/Tools | Primary Purpose | Common Challenges |
|---|---|---|---|
| Quality Control | Metrics: count depth, genes detected, mitochondrial fraction | Filter out low-quality cells and technical artifacts | Distinguishing biological signals from technical artifacts |
| Normalization | Log transformation, SCTransform | Remove technical biases (e.g., sequencing depth) | Choosing method appropriate for data characteristics |
| Feature Selection | Identification of highly variable genes | Focus analysis on biologically relevant genes | Retaining rare but important cell population markers |
| Dimensionality Reduction | PCA, UMAP, t-SNE | Visualize and simplify complex data structure | Interpreting distances in reduced dimensions |
| Clustering | Leiden, Louvain | Group cells by expression profile similarity | Determining optimal resolution parameters |
Figure 1: The Computational Workflow from Raw Data to Cell Clusters. This pipeline transforms raw sequencing data into computational groups that require biological annotation.
Methodological Frameworks for Cell Type Annotation
Reference-Based Annotation Approaches
Reference-based annotation leverages existing, well-annotated datasets as a ground truth to label new data. Tools such as SingleR and Azimuth perform this by comparing gene expression profiles between query cells and reference datasets, effectively transferring known labels from reference to query cells based on similarity. The Azimuth project provides annotations at different levels—from broad categories to detailed subtypes—allowing researchers to choose appropriate resolution. This approach works best when the reference data closely matches the biological context of the query data, though it may struggle with novel cell types not represented in the reference [2].
Marker Gene-Based Annotation
The traditional marker-based approach relies on known canonical marker genes to assign cell identities. Researchers examine differential expression between clusters and compare these patterns with established marker genes from literature (e.g., PECAM1 for endothelial cells). While intuitive, this method depends heavily on prior knowledge and curated marker databases, and can miss cell populations with unexpected marker combinations or novel cell types without established markers. It remains particularly valuable for validating and refining automated annotations [2].
Emerging AI-Driven Approaches
Recent advancements employ large language models (LLMs) to address annotation challenges. Tools like LICT (Large Language Model-based Identifier for Cell Types) leverage multiple LLMs in an integrated approach to improve annotation reliability. These systems utilize a "talk-to-machine" strategy where the model is queried with marker gene information, then provides annotations which are validated against expression patterns in the dataset. This iterative process enhances accuracy, particularly for challenging low-heterogeneity cell populations where traditional methods often struggle. A key innovation is the objective credibility evaluation, which assesses annotation reliability based on whether predicted marker genes are actually expressed in the annotated clusters, providing a reference-free validation mechanism [1].
Table 2: Comparison of Cell Type Annotation Methodologies
| Method | Key Tools/Platforms | Strengths | Limitations |
|---|---|---|---|
| Reference-Based | SingleR, Azimuth | Standardized, efficient for known cell types | Limited for novel cell types; reference bias |
| Marker Gene-Based | Manual curation, literature mining | Biologically intuitive; good for validation | Depends on prior knowledge; incomplete coverage |
| AI-Driven | LICT, GPTCelltype | Adaptable; no reference needed; handles ambiguity | Complex implementation; training data dependencies |
| Hybrid Approaches | Combined use of multiple methods | Leverages complementary strengths | Time-consuming; requires expertise |
Practical Workflow: From Clusters to Biological Insight
An Integrated Annotation Pipeline
A robust annotation strategy typically combines multiple approaches. The process begins with reference-based annotation to establish preliminary labels, followed by marker gene validation to confirm or refine these assignments. For ambiguous clusters or populations that don't match known references, differential expression analysis identifies uniquely expressed genes that can be investigated further through literature searches and functional enrichment analysis. This multi-layered approach balances efficiency with biological plausibility, creating a safety net against the limitations of any single method [2].
Validation and Credibility Assessment
Regardless of the method used, validation is essential. The objective credibility evaluation strategy demonstrated by LICT provides a framework for assessing annotation reliability. In this approach, for each predicted cell type, representative marker genes are retrieved and their expression is analyzed in the corresponding clusters. An annotation is deemed reliable if more than four marker genes are expressed in at least 80% of cells within the cluster. This systematic validation helps distinguish robust annotations from uncertain ones, guiding researchers toward conclusions supported by their data [1].
Figure 2: Decision Workflow for Cell Type Annotation. This diagram outlines the logical process for moving from computational clusters to verified biological identities, incorporating multiple evidence sources and validation checkpoints.
Computational Platforms and Frameworks
Several integrated computational platforms form the backbone of modern scRNA-seq analysis. Seurat remains the R standard for versatility and integration, supporting multiple data modalities including spatial transcriptomics and CITE-seq data. Scanpy dominates large-scale scRNA-seq analysis in Python, with optimized architecture for handling millions of cells. The SingleCellExperiment ecosystem in Bioconductor provides a common format that underpins many specialized R tools, promoting reproducibility and method interoperability [5].
Reference Databases and Specialized Tools
Critical to annotation success are comprehensive reference databases and specialized tools. The Single Cell Expression Atlas offers a flexible pipeline and curated data. scRNASeqDB provides a database of human single-cell gene expression profiles. For specific analytical challenges, tools like Harmony efficiently correct batch effects; Velocyto enables RNA velocity analysis to infer cellular dynamics; and CellBender uses deep learning to remove ambient RNA contamination, cleaning data before annotation attempts [6] [7] [5].
Table 3: Essential Research Reagent Solutions for scRNA-seq Annotation
| Resource Category | Specific Tools/Resources | Primary Function | Application Context |
|---|---|---|---|
| Integrated Platforms | Seurat, Scanpy, SingleCellExperiment | End-to-end analysis environments | General scRNA-seq analysis workflows |
| Reference Databases | Single Cell Expression Atlas, scRNASeqDB, Azimuth | Provide curated reference annotations | Reference-based annotation |
| Specialized Algorithms | Harmony, LICT, Velocyto, CellBender | Address specific analytical challenges | Batch correction, AI annotation, trajectory inference, noise reduction |
| Commercial Solutions | Trailmaker, BBrowserX, Partek Flow | User-friendly interfaces for non-bioinformaticians | Research settings with limited coding expertise |
Emerging Trends and Future Directions
The field of cell type annotation is rapidly evolving with several significant trends. Multi-model integration strategies are gaining traction, leveraging the complementary strengths of multiple LLMs to reduce uncertainty and increase annotation reliability. The "talk-to-machine" approach represents another advancement, iteratively enriching model input with contextual information to mitigate ambiguous or biased outputs. There is also increasing recognition of the need for objective credibility evaluation frameworks that assess annotation reliability based on marker gene expression within the input dataset, enabling reference-free, unbiased validation [1].
Spatial transcriptomics integration is becoming increasingly important, with tools like Squidpy enabling spatially informed single-cell analysis. This adds a crucial dimensional context to annotation decisions, helping resolve ambiguous cases where the same gene expression profile might have different meanings in different tissue locations. As these technologies mature, we can expect cell type annotation to move beyond purely transcriptomic definitions toward more integrated cellular identities incorporating spatial, epigenetic, and proteomic information [5].
Cell type annotation remains a core challenge in single-cell RNA sequencing research, serving as the critical bridge between computational patterns and biological meaning. Successful navigation of this challenge requires a multifaceted approach that combines computational rigor with biological expertise. No single method currently suffices for all scenarios—instead, researchers must strategically combine reference-based, marker-based, and emerging AI-driven approaches while implementing robust validation procedures.
The field continues to mature, with emerging trends pointing toward more integrated, spatially aware, and objectively validated annotation frameworks. What remains constant is the need for careful, critical assessment of cell type assignments—recognizing that these labels form the foundation for all subsequent biological interpretations and conclusions. By embracing a rigorous, multi-evidence approach to this fundamental task, researchers can ensure their computational clusters are faithfully translated into biologically meaningful identities that advance our understanding of cellular systems.
In the era of high-throughput single-cell RNA sequencing (scRNA-seq), automated cell type annotation tools have rapidly proliferated, offering the promise of rapid, reproducible cell classification. Despite these advances, manual annotation by domain experts continues to be regarded as the gold standard for identifying cell types and states in scRNA-seq data. This whitepaper examines the technical limitations of current computational methods and demonstrates how human expertise remains indispensable for interpreting complex biological contexts, identifying novel cell populations, and validating automated predictions. We present evidence from recent studies comparing annotation methodologies and provide a detailed framework for integrating expert knowledge with emerging computational tools to achieve the most biologically accurate results.
Single-cell RNA sequencing (scRNA-seq) has revolutionized biological research by enabling the profiling of gene expression at unprecedented resolution, revealing cellular heterogeneity and complex tissue organizations that were previously obscured in bulk sequencing approaches [8]. A fundamental step in interpreting scRNA-seq data is cell type annotation—the process of assigning identity labels to individual cells or clusters based on their transcriptomic profiles [9] [10].
The primary approaches to cell type annotation can be categorized into two paradigms: manual and automated methods. Manual annotation relies on expert knowledge to interpret differential gene expression patterns against established biological markers, while automated methods leverage computational algorithms to classify cells using reference datasets or marker databases [10] [11]. Despite the proliferation of automated tools, recent evaluations consistently reaffirm that "expert manual annotation is still considered the gold standard method for cell type assignment" [11]. This persistent preference stems from the nuanced understanding experts bring to interpreting complex gene expression patterns within specific biological contexts.
The Technical Limitations of Automated Annotation
Platform-Specific Biases and Data Quality Issues
Automated annotation methods face significant challenges related to technical variability across sequencing platforms. Different scRNA-seq technologies, such as 10x Genomics and Smart-seq, produce data with distinct characteristics due to their underlying sequencing principles [12]. The lower gene detection rate of high-throughput platforms like 10x Genomics may hinder the detection of key marker genes for rare cell types, while the higher sensitivity of full-length transcript methods like Smart-seq may reveal subpopulations that exceed the classification capacity of pre-trained models [12]. These technical differences exacerbate key challenges in scRNA-seq data, including sparsity, heterogeneity, and batch effects, which collectively compromise annotation consistency across platforms [12].
Challenges with Complex and Rare Cell Types
Automated methods particularly struggle with annotating closely related cell types and rare populations. As highlighted in evaluations of T cell phenotyping, while automated tools can differentiate major cell populations, "labelling T-cell subtypes remains problematic" [9]. This limitation becomes especially evident for unconventional T cells such as mucosal-associated invariant T (MAIT) cells, natural killer T (NKT) cells, and γδ T cells, whose cellular profiles remain poorly understood and are often misclassified [9].
Table 1: Performance Challenges of Automated Annotation Methods
| Challenge Category | Specific Limitations | Impact on Annotation Accuracy |
|---|---|---|
| Technical Variability | Platform-specific biases in gene detection | Inconsistent marker gene detection across technologies |
| Data Quality Issues | High sparsity, dropout rates, batch effects | Reduced reliability in cross-study applications |
| Rare Cell Types | Limited representation in reference datasets | Frequent misclassification or complete oversight |
| Complex Lineages | Subtle transcriptional differences between subtypes | Inability to distinguish closely related cell states |
| Novel Populations | Dependence on existing classification schemas | Failure to identify previously uncharacterized cells |
Limitations of Reference Databases and Marker Genes
Automated methods heavily depend on the quality and comprehensiveness of reference databases and marker genes. Existing marker databases face significant limitations, including incomplete coverage, outdated data, and inconsistency across samples [12]. These limitations restrict their performance in handling novel cell types or rare cell populations. Furthermore, the dynamic nature of cellular phenotypes means that marker databases require continuous updating—a process that often lags behind biological discovery [12].
The Case for Manual Annotation: Precision Through Expert Knowledge
Interpretation of Complex Expression Patterns
Manual annotation leverages the pattern recognition capabilities and contextual knowledge of domain experts to interpret subtle expression patterns that automated methods frequently miss. Experts can integrate multi-layered biological information—including gradient expression changes, co-expression patterns, and biologically plausible cell state transitions—that extends beyond simple marker presence or absence [9] [11]. This nuanced interpretation is particularly valuable for distinguishing between closely related cell states and identifying transitional populations that don't fit neatly into predefined categories.
Identification of Novel Cell Types and States
A significant advantage of manual annotation is the capacity for discovery of novel cell types that are not represented in existing classification schemas or reference datasets. Unlike supervised automated methods that are constrained by their training data, human experts can recognize unusual expression patterns that may represent previously uncharacterized cell populations [11]. This discovery potential is especially important in exploratory research where the cellular landscape may be incompletely mapped.
Handling of Biological Context and Ambiguity
Expert annotators excel at incorporating tissue-specific context and recognizing biologically plausible cell type combinations. This contextual understanding enables appropriate interpretation of marker genes whose expression may vary across tissues or physiological states [11]. Furthermore, experts can recognize and appropriately handle ambiguous cases where cells exhibit mixed characteristics or exist in transitional states, avoiding the false precision that automated classification might impose [1].
Comparative Analysis: Manual vs. Automated Annotation
Recent systematic evaluations demonstrate the persistent performance gap between manual and automated annotation methods. In a comprehensive assessment of cell type annotation reliability, researchers found significant discrepancies between automated methods and manual annotations, particularly in less heterogeneous cell populations [1].
Table 2: Comparative Performance of Annotation Approaches
| Annotation Method | Strengths | Limitations | Optimal Use Cases |
|---|---|---|---|
| Manual Annotation | High biological accuracy, context awareness, novel cell discovery | Time-intensive (20-40 hours for 30 clusters), subjective, requires expertise | Exploratory research, validation of automated results, complex cell types |
| Supervised Automated Methods (SingleR, CellTypist) | Fast, reproducible, handles large datasets | Limited to predefined cell types, requires high-quality reference data | Well-characterized tissues, initial screening of large datasets |
| Marker-Based Methods (scCATCH, SCSA) | Interpretable, uses established biological knowledge | Dependent on marker database quality, struggles with overlapping markers | Preliminary annotation when reference data is limited |
| LLM-Based Methods (GPT-4, LICT) | Broad knowledge base, no specialized training required | Unexplainable reasoning, potential for "AI hallucination" | Rapid initial assessment when expert unavailable |
Notably, a 2024 study evaluating GPT-4 for cell type annotation found that while it showed promise, it still required "validation of GPT-4's cell type annotations by human experts before proceeding with downstream analyses" due to concerns about reproducibility and potential for artificial intelligence hallucination [13]. Similarly, a 2025 study developing LICT (LLM-based Identifier for Cell Types) found that discrepancies between LLM-generated and manual annotations didn't necessarily indicate reduced reliability of manual methods, but rather highlighted cases where "manual annotations often exhibit inter-rater variability and systematic biases" [1].
Experimental Protocols for Manual Annotation
Standardized Workflow for Cluster-Based Annotation
The standard manual annotation workflow consists of a structured, iterative process that combines computational preprocessing with expert biological interpretation:
Data Preprocessing and Quality Control: Filter cells based on quality metrics (number of detected genes, total molecule count, mitochondrial gene percentage) to eliminate low-quality cells and technical artifacts [12].
Dimensionality Reduction and Clustering: Perform principal component analysis (PCA) followed by graph-based clustering (e.g., Seurat, Scanpy) to group cells with similar expression profiles [9] [14].
Differential Expression Analysis: Identify marker genes for each cluster using statistical tests (e.g., two-sided Wilcoxon test, Welch's t-test) comparing each cluster against all others [13] [11].
Expert Evaluation of Marker Genes: Systematically compare cluster-specific upregulated genes with canonical cell-type markers from literature and databases, prioritizing markers with known specificity and reliability [9] [11].
Contextual Validation: Assess the biological plausibility of preliminary annotations using spatial relationships (if available), trajectory inferences, and cross-referencing with established biological knowledge [11].
Iterative Refinement: Adjust annotations based on subclustering of heterogeneous populations and re-evaluation of ambiguous clusters [9].
Validation and Quality Assessment Protocols
To ensure annotation accuracy, experts employ multiple validation strategies:
- Multi-marker verification: Require concordant expression of multiple established marker genes rather than relying on single markers [9] [11]
- Cross-dataset validation: Compare annotations with independent datasets from similar tissues or conditions
- Negative marker assessment: Confirm absence of exclusion markers that define incompatible cell types
- Spatial validation: When available, verify that annotated cell types align with expected spatial distributions in tissue architecture [14]
Table 3: Key Research Reagent Solutions for Cell Type Annotation
| Resource Category | Specific Tools & Databases | Primary Function | Key Considerations |
|---|---|---|---|
| Marker Gene Databases | CellMarker 2.0, PanglaoDB, CancerSEA | Provide curated lists of cell-type specific markers | Variable coverage across tissues; requires regular updating |
| Reference Atlases | Human Cell Atlas (HCA), Tabula Muris, Allen Brain Atlas | Offer comprehensive reference expression profiles | Platform-specific biases; limited rare cell representation |
| Analysis Platforms | Seurat, Scanpy, ACT (Annotation of Cell Types) | Enable data processing, visualization, and annotation | Different learning curves; varying algorithm implementations |
| Spatial Validation Tools | MERFISH, STARmap, seqFISH | Enable spatial confirmation of annotated cell types | Technical complexity; limited multiplexing capacity |
| Automated Annotation Tools | SingleR, CellTypist, scANVI | Provide rapid preliminary annotations | Require expert validation; variable performance across cell types |
Integrated Approaches: Combining Expert Knowledge with Computational Tools
The most effective annotation strategies leverage the complementary strengths of both manual and automated approaches through a structured integration:
The Hybrid Annotation Framework
Initial Automated Screening: Use supervised methods (SingleR, CellTypist) or LLM-based tools (GPT-4, LICT) to generate preliminary annotations [13] [10].
Expert-Led Refinement: Systematically review automated annotations, focusing on low-confidence predictions, rare populations, and biologically implausible assignments [9] [1].
Iterative Validation: Employ the "talk-to-machine" strategy where experts provide structured feedback to improve automated annotations through multiple cycles [1].
Objective Credibility Assessment: Implement quality metrics to evaluate annotation reliability, such as requiring expression of multiple marker genes in a high percentage of cells within clusters [1].
Emerging Best Practices
Current consensus recommends a "two-step annotation process" that involves "primary annotations of the gene expression clusters by automated algorithms, followed by expert-based manual interrogation of the cell populations" [9]. This hybrid approach balances efficiency with biological accuracy, ensuring that the final annotations are both reproducible and scientifically valid.
Manual annotation remains the gold standard for cell type identification in single-cell RNA sequencing research due to the irreplaceable role of expert knowledge in interpreting complex biological contexts, recognizing novel cell types, and validating automated predictions. While automated methods offer valuable scalability and reproducibility for initial screening, they cannot yet replicate the nuanced understanding that domain experts bring to annotation challenges. The most effective path forward lies in integrated approaches that leverage computational tools for efficiency while maintaining expert oversight for biological accuracy. As single-cell technologies continue to evolve, the partnership between human expertise and computational power will be essential for unlocking the full potential of single-cell genomics in basic research and therapeutic development.
Cell type annotation is a fundamental and critical step in the analysis of single-cell RNA sequencing (scRNA-seq) data. It is the process of assigning identity labels to individual cells based on their transcriptomic profiles, transforming clusters of computationally grouped cells into biologically meaningful categories [2]. This process is indispensable for understanding cellular composition and function within complex tissues, enabling researchers to decipher the cellular heterogeneity that underpins development, homeostasis, and disease [1] [15]. In the context of a broader thesis on scRNA-seq research, mastering cell type annotation is paramount, as accurate annotation forms the foundation upon which all subsequent biological interpretations and discoveries are built.
The core elements that enable this identification are marker genes, cellular heterogeneity, and transcriptomic profiles. Marker genes are genes that are uniquely or highly expressed in a specific cell type and serve as its molecular fingerprint. Cellular heterogeneity refers to the natural variation in gene expression between individual cells, even within a population that was once considered homogeneous. A cell's transcriptomic profile is the complete set of RNA molecules expressed from its genome at a specific point in time, providing a snapshot of its functional state [15]. Together, these concepts allow researchers to deconvolute complex tissues into their constituent cell types, identify novel cell states, and understand dynamic biological processes at an unprecedented resolution.
The Biological Foundation of Cell Identity
Defining Cell Types and States
Fundamentally, the concept of a "cell type" has evolved with technological advancements. Traditionally, biologists defined cell types based on morphology and physiology. The advent of antibody labeling introduced definition by cell surface markers, while RNA sequencing allowed for definition by gene expression profiles [2]. In the era of single-cell biology, cell identity is often context-dependent and can fall into several overlapping categories:
- Established Cell Types: These are well-characterized cells, such as osteocytes or endothelial cells, typically identified through reference datasets and distinct canonical markers (e.g., PECAM1 for endothelial cells) [2].
- Novel Cell Types: Biologically distinct clusters identified through differential expression that may represent previously undiscovered cell populations [2].
- Cell States: Transient, functional conditions of a cell, such as activation, stress, or a specific disease stage, which can be detected by scRNA-seq [2] [16].
- Developmental Stages: Cells captured along a continuum of differentiation, from progenitor to mature cell types, which can be ordered using trajectory inference algorithms [2].
The Central Role of Marker Genes
Marker genes are the practical tools used to assign these identities. A reliable marker gene exhibits consistently high expression in a target cell type and low expression in others. Their discovery and validation are central to annotation. For example, in a study of cervical cancer, single-cell transcriptomics identified distinct epithelial subpopulations based on their marker gene expression: one subpopulation was characterized by MMP1, SPRR1B, and KRT16, while another expressed immune-associated genes like CD74 and IL32 [17].
However, reliance on marker genes has limitations. Their expression can be dynamic, and no single marker is always perfectly specific. Therefore, annotation typically uses panels of marker genes rather than individual genes to improve confidence [2]. The scientific community has established several databases to catalog this knowledge, including CellMarker and PanglaoDB [12]. A key challenge is that these databases require continuous updating to incorporate new findings, a process that can be accelerated by deep learning models that help identify novel gene combinations characteristic of specific cell types [12].
Technical Workflow: From Raw Data to Annotation
The journey from a tissue sample to an annotated single-cell dataset is a multi-stage process involving both wet-lab and computational steps. The following diagram illustrates the core workflow and the central role of annotation.
Experimental Protocols and Reagent Solutions
Generating high-quality single-cell data requires careful experimental planning and selection of appropriate platforms. The table below summarizes key commercial solutions for cell capture and library generation.
Table 1: Research Reagent Solutions for Single-Cell RNA Sequencing
| Commercial Solution | Capture Platform | Throughput (Cells/Run) | Capture Efficiency | Key Considerations |
|---|---|---|---|---|
| 10× Genomics Chromium | Microfluidic oil partitioning | 500 – 20,000 | 70–95% | Industry standard; requires specific hardware [18]. |
| BD Rhapsody | Microwell partitioning | 100 – 20,000 | 50–80% | Compatible with both cells and nuclei [18]. |
| Parse Evercode | Multiwell-plate | 1,000 – 1M | >90% | Very low cost per cell; requires high cell input [18]. |
| Fluent/PIPseq (Illumina) | Vortex-based oil partitioning | 1,000 – 1M | >85% | No microfluidics hardware; flexible for large cell sizes [18]. |
The choice of platform depends on the research question, sample type, and desired throughput. For instance, droplet-based systems like 10× Genomics are ideal for profiling tens of thousands of cells, while plate-based systems like Parse BioScience offer a lower cost per cell for massive-scale projects [18]. A critical preliminary decision is whether to sequence single cells or single nuclei. Single cells provide greater mRNA content, generally yielding more robust gene expression data. Single nuclei are advantageous for difficult-to-dissociate tissues (e.g., neurons) and are compatible with multi-omics assays that also profile open chromatin (ATAC-seq) [18].
Computational Preprocessing Prior to Annotation
Before annotation can begin, raw sequencing data must be rigorously processed to ensure reliability. This preprocessing pipeline involves several standardized steps [19] [12]:
- Quality Control (QC): Cells are filtered based on metrics like the number of genes detected, total molecule count, and the proportion of mitochondrial gene expression. High mitochondrial content often indicates stressed or dying cells [19] [12].
- Doublet Detection: Algorithms like DoubletFinder or Scrublet are used to identify and remove droplets that contain two or more cells, which can appear as artificial cell types [19].
- Normalization: Technical variations in sequencing depth between cells are corrected to make their expression profiles comparable.
- Batch Effect Correction: When data is generated across multiple sequencing runs or platforms, tools like Harmony or ComBat are used to remove non-biological technical differences [2] [19].
- Clustering: Dimensionality reduction (e.g., UMAP, t-SNE) is performed, and cells are grouped into clusters based on the similarity of their transcriptomic profiles. These clusters represent putative cell types or states and are the direct input for the annotation process [2] [19].
Methodologies for Cell Type Annotation
Traditional and Reference-Based Approaches
The practical steps of cell type identification often involve a combinatorial approach that integrates automated methods with expert knowledge [2].
- Reference-Based Annotation: This method involves aligning the gene expression profiles of query cells against a pre-annotated reference atlas. Tools like SingleR and Azimuth calculate the correlation between a single cell's expression profile and the average profiles of known cell types in the reference, assigning the label of the best-matching type [2] [13]. The Azimuth project, for instance, provides annotations at different levels of resolution, from broad categories to detailed subtypes.
- Manual Refinement: Automated methods are not infallible. Manual refinement is a crucial step where biologists fine-tune annotations by verifying the expression patterns of canonical marker genes across clusters, performing differential gene expression analysis to find unique signatures, and consulting the scientific literature [2]. This process integrates deep biological expertise to correct misclassifications and identify novel populations.
The Emergence of Large Language Models (LLMs)
A recent and powerful advancement in annotation is the use of Large Language Models (LLMs) like GPT-4. These models do not rely on reference datasets; instead, they use their vast training on public text and data to annotate cell types directly from a list of marker genes provided by the researcher [1] [13].
The process is straightforward: a researcher inputs the top marker genes for a cluster (e.g., "CD3E, CD3D, CD2") into the LLM with a prompt, and the model returns a predicted cell type (e.g., "T cell") [13]. Studies have shown that GPT-4 generates annotations with strong concordance to manual expert annotations, considerably reducing the effort and expertise required [13]. To address limitations such as performance on low-heterogeneity datasets, next-generation tools like LICT (Large Language Model-based Identifier for Cell Types) have been developed. LICT employs sophisticated strategies:
- Multi-model integration: Leveraging several top-performing LLMs (e.g., GPT-4, Claude 3) and selecting the best result to improve accuracy [1].
- "Talk-to-machine" strategy: An iterative process where the model is asked to provide marker genes for its prediction, which are then checked against the dataset. If the validation fails, the model is queried again with the new evidence, refining its annotation [1].
- Objective credibility evaluation: This strategy assesses the reliability of an annotation by checking if the model-predicted marker genes are actually expressed in the cluster, providing a reference-free measure of confidence [1].
Table 2: Comparison of Automated Cell Type Annotation Methods
| Method Category | Examples | Underlying Principle | Advantages | Limitations |
|---|---|---|---|---|
| Marker Gene-Based | Manual Curation | Matching DEGs to known markers from literature/databases. | Intuitive; high biological interpretability. | Labor-intensive; dependent on pre-existing knowledge [2]. |
| Reference-Based Correlation | SingleR, Azimuth | Calculating similarity to a labeled reference dataset. | Objective; fast for well-defined tissues. | Accuracy depends on reference quality and completeness [2] [13]. |
| Supervised Classification | Various ML classifiers | Training a model on reference data to predict labels. | Can be highly accurate if training data is good. | Poor generalization to cell types not in the training set [12]. |
| Large Language Models (LLMs) | GPTCelltype, LICT | Using pre-trained knowledge to infer cell type from marker lists. | No reference needed; broad knowledge base; high accuracy [1] [13]. | "Black box" nature; potential for AI hallucination; requires validation [1] [13]. |
The following diagram illustrates the advanced, iterative workflow of the LICT tool, which represents the cutting edge in LLM-based annotation.
Interpreting Results and Advanced Applications
Resolving Discrepancies and Assessing Confidence
Discrepancies between automated annotations (including LLM-based ones) and manual expert labels do not automatically imply the automated method is wrong. Expert annotations can suffer from inter-rater variability and inherent biases [1]. The objective credibility evaluation strategy in LICT addresses this by providing a data-driven measure of reliability. For instance, in a stromal cell dataset, 29.6% of LLM-generated annotations were deemed credible based on marker gene evidence, whereas none of the manual annotations met the same credibility threshold, suggesting the LLM may have provided more accurate labels in these cases [1].
Applications in Disease Research: The Case of Cancer
Cell type annotation is powerful for unraveling the complexity of disease. In cervical cancer, annotation of scRNA-seq data revealed extensive heterogeneity within malignant epithelial cells, identifying subpopulations with distinct genomic and transcriptomic signatures, such as a hypoxic subpopulation and a proliferative subpopulation [17]. Similarly, in inflammatory breast cancer (IBC), annotation was key to characterizing it as an immunologically "cold" tumor, revealing a significant reduction in immune cells like CD45+ cells and a suppressed immune microenvironment, which informs potential immunotherapy strategies [16].
Cell type annotation, powered by the core concepts of marker genes, cellular heterogeneity, and transcriptomic profiles, is the linchpin of single-cell RNA sequencing research. The field is rapidly evolving, moving from purely manual curation to a hybrid of sophisticated computational methods. While reference-based and supervised methods remain highly valuable, the emergence of LLM-based tools like LICT offers a promising, reference-free alternative that leverages vast biological knowledge. Regardless of the method, a gold-standard principle remains: the most robust annotations are achieved by combining computational power with deep biological expertise and, where possible, orthogonal experimental validation. This integrated approach ensures that the names we assign to cells truly reflect their biological identity, enabling meaningful discoveries in health and disease.
Single-cell RNA sequencing (scRNA-seq) has revolutionized biology by enabling the investigation of transcriptional programs at the ultimate level of resolution. However, the analytical potential of this technology is constrained by substantial data challenges, primarily sparsity, technical noise, and batch effects. These technical artifacts profoundly impact downstream analyses, including the crucial task of cell type annotation. This technical guide examines the nature, causes, and consequences of these data characteristics, providing structured methodologies and computational strategies to mitigate their effects. By framing these issues within the context of cell type annotation—the process of bridging observed cellular clusters with existing biological knowledge—we equip researchers with robust frameworks for generating biologically meaningful insights from complex single-cell datasets.
Single-cell RNA sequencing technology has emerged as a powerful method for characterizing gene expression profiles at the individual cell level, providing unprecedented insights into cellular heterogeneity in complex tissues [8]. Since its conceptual breakthrough in 2009, scRNA-seq has enabled the classification and characterization of cells at the transcriptome level, allowing identification of rare but functionally important cell populations [8]. The technology has evolved from processing few cells per experiment to hundreds of thousands of cells, with costs dramatically decreasing while automation and throughput have significantly increased [8].
Despite these advancements, scRNA-seq data present unique analytical challenges that distinguish them from bulk RNA sequencing approaches. Three characteristics particularly impact data quality and interpretation: (1) Sparsity - an excess of zero counts arising from both biological and technical factors; (2) Noise - high technical variability from minute starting material and amplification; and (3) Batch effects - systematic technical variations between experiments conducted at different times, by different operators, or with different protocols [20] [21]. These artifacts can confound biological variations of interest during data integration and may hamper downstream analyses, potentially making results inconclusive [20].
The process of cell type annotation—matching observed cell clusters to known biological identities—is particularly vulnerable to these data challenges. As the fundamental step in scRNA-seq analysis that bridges computational findings with biological meaning, accurate annotation requires careful consideration of data quality and appropriate application of correction methods [22]. This guide examines these data characteristics in depth and provides practical experimental and computational strategies to address them.
Understanding Core Data Characteristics
Data Sparsity: Causes and Consequences
Sparsity in scRNA-seq data manifests as an abundance of zero counts in the gene expression matrix, with approximately 80% of gene expression values typically being zero [23]. This sparsity arises from both biological factors (genuine absence of transcript expression) and technical factors (failure to detect expressed transcripts due to limited sensitivity). The distinction between these "biological zeros" and "technical zeros" (also known as dropout events) is methodologically challenging but crucial for accurate analysis.
The impact of sparsity on differential expression analysis is substantial. Recent benchmarking studies demonstrate that data sparsity substantially impacts the performance of differential expression methods [24]. Sparsity reduces power to detect truly differentially expressed genes, particularly those with modest fold changes or low abundance. Studies comparing scRNA-seq with bulk RNA-seq found that clusters require 2,000 or more cells to identify the majority of differentially expressed genes (DEGs) that show modest differences in bulk RNA-seq analysis [25]. Conversely, clusters with as few as 50-100 cells may be sufficient for identifying DEGs with extremely small p-values or high transcript abundance (>200 TPM) [25].
Table 1: Impact of Cell Number on DEG Detection in scRNA-seq
| Cell Number per Cluster | Recapitulation of Modest DEGs | Recapitulation of High-Abundance DEGs | Recommended Application |
|---|---|---|---|
| 50-100 cells | <10% | >50% | Detection of high-abundance, strongly significant DEGs |
| 1,000 cells | ~40% | >70% | Moderate-powered DEG detection |
| 2,000+ cells | >50% | >80% | Comprehensive DEG detection including modest differences |
Technical Noise and Variability
Technical noise in scRNA-seq data originates from multiple sources throughout the experimental workflow. The minimal RNA quantity from individual cells creates substantial amplification bias during reverse transcription and cDNA amplification [8]. Two primary amplification strategies are employed: polymerase chain reaction (PCR-based) and in vitro transcription (IVT-based), each introducing distinct noise profiles [8]. PCR represents a non-linear amplification process that can preferentially amplify certain transcripts, while IVT provides linear amplification but requires an additional round of reverse transcription, potentially introducing 3' coverage biases [8].
Unique molecular identifiers (UMIs) were introduced to address amplification-associated biases, enabling quantitative correction by barcoding individual mRNA molecules during reverse transcription [8]. UMI incorporation improves the quantitative nature of scRNA-seq by effectively eliminating PCR amplification bias and enhancing reading accuracy. However, even with UMIs, substantial technical noise persists due to cell-to-cell variation in capture efficiency, amplification efficiency, and sequencing depth.
Additional noise sources include "artificial transcriptional stress responses" induced by tissue dissociation procedures. Studies have confirmed that protease dissociation at 37°C can induce expression of stress genes, introducing technical artifacts and causing inaccurate cell type identification [8]. Dissociation at 4°C or utilization of single-nucleus RNA sequencing (snRNA-seq) has been suggested to minimize these isolation procedure-induced gene expression changes [8].
Batch effects represent consistent technical variations in gene expression patterns induced by differences in experimental conditions rather than biological differences [23]. These effects can originate from multiple sources including different sequencing platforms, timing, reagents, laboratory conditions, or operators [21] [23]. In large-scale projects where data generation across multiple batches is inevitable, these technical variations can mask underlying biology or introduce spurious structure, potentially leading to misleading conclusions [21].
Several visualization approaches help identify batch effects in scRNA-seq datasets. Principal Component Analysis (PCA) of raw data can reveal batch effects through examination of top principal components, where sample separation reflects batch identity rather than biological sources [23]. Similarly, clustering analysis visualized on t-SNE or UMAP plots typically shows cells from different batches clustering separately rather than grouping by biological similarity when batch effects are present [23]. Quantitative metrics like normalized mutual information (NMI), adjusted rand index (ARI), and k-nearest neighbor batch effect test (kBET) provide objective measures of batch effect strength and correction efficacy [23].
Table 2: Batch Effect Detection and Quantification Methods
| Method Category | Specific Approaches | Key Output | Interpretation |
|---|---|---|---|
| Visualization Methods | PCA, t-SNE, UMAP | Low-dimensional embeddings | Visual separation of batches indicates batch effects |
| Clustering-based Metrics | Adjusted Rand Index (ARI), Normalized Mutual Information (NMI) | Numerical scores (0-1) | Higher values indicate better batch mixing |
| Neighborhood-based Tests | k-BET (k-nearest neighbor batch effect test) | p-values, rejection rates | Lower rejection rates indicate successful integration |
| Graph-based Metrics | Graph iLISI, PCR (batch) | Numerical scores | Higher scores indicate better integration quality |
Experimental Protocols for Data Quality Control
Single-Cell Isolation and Library Preparation
The single-cell isolation process represents a critical source of technical variation. The most common techniques include limiting dilution, fluorescence-activated cell sorting (FACS), magnetic-activated cell sorting, microfluidic systems, and laser microdissection [8]. The key outcome is that each single cell must be captured in an isolated reaction mixture where all transcripts from that cell are uniquely barcoded after conversion to complementary DNAs (cDNA) [8].
For tissues sensitive to dissociation stress, single-nucleus RNA sequencing (snRNA-seq) provides an alternative approach that minimizes artificial transcriptional responses. snRNA-seq has proven particularly useful for brain tissues, which are difficult to dissociate into intact cells, as well as muscle, heart, kidney, lung, pancreas, and various tumor tissues [8]. However, researchers should note that snRNA-seq only captures nuclear transcripts, potentially missing biological processes related to mRNA processing, RNA stability, and metabolism [8].
Following cell isolation, library preparation involves critical choices between amplification methods. PCR-based strategies include SMART technology (taking advantage of transferase and strand-switch activity of Moloney Murine Leukemia Virus reverse transcriptase) or alternative methods connecting the 5' end of cDNA with poly(A) or poly(C) to build common adaptors [8]. IVT-based approaches provide linear amplification but introduce additional procedural steps. The selection between these strategies should consider the specific biological questions, required throughput, and sensitivity requirements.
Quality Assessment Workflows
A robust quality assessment workflow should include both pre- and post-correction evaluation steps. Pre-correction assessment identifies potential batch effects and data quality issues, while post-correction validation ensures that correction methods have not introduced artifacts or removed biological signal.
Pre-correction Quality Assessment Protocol:
- Sequencing Depth Evaluation: Calculate the average reads per cell and distribution across cells. Exclude cells with extremely low sequencing depth (typically <500-1,000 reads per cell depending on protocol).
- Gene Detection Analysis: Assess the number of genes detected per cell. Filter cells with unusually low gene counts (potential empty droplets) or unusually high counts (potential multiplets).
- Mitochondrial Gene Content: Calculate the percentage of mitochondrial reads. High percentages (>10-20%) may indicate stressed or dying cells.
- Batch Effect Visualization: Generate PCA, t-SNE, or UMAP plots colored by batch identity to visually assess batch separation.
- Quantitative Batch Metrics: Compute batch effect metrics such as k-BET or ARI to quantitatively measure batch effect strength.
Post-correction Validation Protocol:
- Visual Inspection: Regenerate dimensionality reduction plots (PCA, t-SNE, UMAP) colored by batch to confirm batch mixing.
- Biological Preservation Tests: Verify that known biological signals (cell type markers, experimental conditions) remain distinct after correction.
- Quantitative Integration Metrics: Recompute batch effect metrics to quantify improvement in integration quality.
- Differential Expression Consistency: Check consistency of differential expression results before and after correction for known biological effects.
- Overcorrection Checks: Examine whether canonical cell type markers remain detectable and whether cluster-specific markers show expected patterns.
Diagram Title: scRNA-seq Quality Assessment Workflow
Computational Correction Strategies
Batch Effect Correction Algorithms
Multiple computational approaches have been developed to address batch effects in scRNA-seq data, each with distinct theoretical foundations and implementation considerations. These methods can be broadly categorized into several classes:
Nearest Neighbor-based Methods: Mutual Nearest Neighbors (MNN) correction identifies pairs of cells from different batches that are mutually the most similar in expression space, assuming these represent the same cell type [21] [24]. The observed differences between MNN pairs provide an estimate of the batch effect, which is applied to correct the entire dataset. The MNN approach does not require identical population composition across batches and only needs a subset of shared cell types [21]. Related methods include Scanorama, which searches for MNNs in dimensionally reduced spaces and uses similarity-weighted approach for integration [24] [23].
Deep Learning Approaches: Methods like scGen employ variational autoencoders (VAEs) trained on reference data to correct batch effects in new datasets [20] [23]. Adversarial Information Factorization (AIF) uses a conditional variational autoencoder architecture combined with adversarial training to factorize batch effects from biological signals [20]. The encoder learns to separate biological information (in a latent vector) from batch information, while a discriminator ensures the latent representation is free of batch effects [20]. These methods have demonstrated strong performance in scenarios with low signal-to-noise ratio and batch-specific cell types [20].
Matrix Factorization Methods: LIGER (Linked Inference of Genomic Experimental Relationships) employs integrative non-negative matrix factorization to identify both batch-specific and shared factors [23]. The method establishes a shared factor neighborhood graph to connect cells with similar neighborhoods, then normalizes factor loading quantiles to a reference dataset to accomplish batch correction [23].
Other Statistical Approaches: Harmony utilizes PCA for dimensionality reduction, then iteratively removes batch effects by clustering similar cells across batches and calculating correction factors for each cell [23]. ComBat, originally developed for bulk RNA-seq, uses empirical Bayes shrinkage to stabilize batch effect estimates, sharing information across genes [24].
Table 3: Batch Effect Correction Method Comparison
| Method | Underlying Algorithm | Key Strength | Limitations | Output Type |
|---|---|---|---|---|
| MNN Correct | Mutual Nearest Neighbors | Does not require identical population composition | Computationally intensive for large datasets | Corrected expression matrix |
| Harmony | Iterative clustering with PCA | Efficient for large datasets | Primarily provides embeddings | Low-dimensional embeddings |
| Scanorama | Mutual Nearest Neighbors | Handles complex datasets well | May require parameter tuning | Corrected expression matrix and embeddings |
| scGen | Variational Autoencoder | Strong with batch-specific cell types | Requires reference dataset | Corrected expression matrix |
| LIGER | Non-negative Matrix Factorization | Identifies shared and dataset-specific factors | Complex implementation | Low-dimensional factors |
| ComBat | Empirical Bayes | Stabilizes estimates with limited replicates | Assumes similar population composition | Corrected expression matrix |
| AIF | Adversarial Conditional VAE | Robust to noise and specific cell types | Complex training procedure | Corrected expression matrix |
Differential Expression Analysis with Batch Considerations
Benchmarking studies have evaluated 46 workflows for differential expression analysis of single-cell data with multiple batches, revealing that batch effects, sequencing depth, and data sparsity substantially impact performance [24]. Three primary integrative strategies exist for handling batch effects in differential expression analysis:
Batch Effect Corrected Data Analysis: Applying differential expression tests to data after batch effect correction. Studies show this approach rarely improves analysis for sparse data, with one exception being scVI-improved limmatrend [24].
Batch Covariate Modeling: Including batch as a covariate in statistical models while using uncorrected data. This approach overall improves methods like MAST, ZINB-WaVE-edgeR, DESeq2, and limmatrend for large batch effects, with MASTCov and ZWedgeR_Cov showing among the highest performances [24].
Meta-analysis Methods: Performing differential expression analysis separately for each batch then combining results using methods like weighted Fisher, fixed effects model, or random effects model. These approaches generally do not improve upon naïve DE methods in benchmarking studies [24].
For low-depth data, single-cell techniques based on zero-inflation models tend to deteriorate in performance, whereas analysis of uncorrected data using limmatrend, Wilcoxon test, and fixed effects model performs well [24]. As depth decreases, the relative performance of Wilcoxon test and fixed effects model for log-normalized data improves, while the benefit of covariate modeling diminishes for very low depths [24].
Diagram Title: DE Strategy Selection Based on Data Characteristics
Cell Type Annotation Despite Data Challenges
Cell type annotation represents the critical bridge between computational clustering results and biological interpretation, directly impacted by data quality issues. Recent advancements include the application of large language models like GPT-4, which can accurately annotate cell types using marker gene information, generating annotations with strong concordance with manual annotations [13]. When evaluated across hundreds of tissue and cell types, GPT-4's annotations fully or partially match manual annotations in over 75% of cell types in most studies and tissues [13].
However, annotation reliability depends heavily on data quality. Performance decreases with small cell populations (≤10 cells), likely due to limited information, and struggles with cell types lacking distinct gene sets, such as B lymphoma cells [13]. GPT-4 also tends to provide higher granularity than manual annotations in some cases, such as distinguishing fibroblasts and osteoblasts within stromal cell classifications [13].
Traditional automated methods like SingleR and ScType require additional processing of gene expression matrices and generally show lower agreement with manual annotations compared to GPT-4 approaches [13]. Regardless of the annotation method, validation by domain experts remains crucial, particularly given the potential for artificial intelligence "hallucination" and the undisclosed nature of GPT-4's training corpus [13].
Table 4: Key Research Reagent Solutions for scRNA-seq Studies
| Reagent/Resource Category | Specific Examples | Function/Purpose | Considerations for Selection |
|---|---|---|---|
| Single-Cell Isolation Kits | 10x Genomics Chromium, DNBelab C4, SMART-seq | Isolate individual cells for sequencing | Throughput, cell viability, recovery efficiency |
| Library Preparation Kits | Chromium Next GEM Single Cell 3', SMART-seq2, CEL-seq2 | Convert RNA to sequencing-ready libraries | Sensitivity, UMI incorporation, cost per cell |
| Unique Molecular Identifiers (UMIs) | Various sequences incorporated during RT | Barcode individual mRNA molecules | Enable quantitative correction for amplification bias |
| Cell Viability Assays | Fluorescence-activated cell sorting (FACS), Trypan blue exclusion | Assess cell integrity before processing | Impact on gene expression, compatibility with platform |
| Batch Effect Correction Software | Seurat, Harmony, Scanorama, scVI, scGen | Computational removal of technical variations | Compatibility with data type, computational requirements |
| Cell Type Annotation Tools | GPTCelltype, SingleR, ScType, CellMarker2.0 | Automate cell type identification | Reference database comprehensiveness, accuracy |
| Differential Expression Packages | DESeq2, edgeR, MAST, limma, Wilcoxon test | Identify statistically significant expression changes | Sensitivity to sparsity, batch effect handling |
The characteristics of scRNA-seq data—sparsity, noise, and batch effects—present significant challenges that directly impact the reliability of biological interpretations, particularly for cell type annotation. These technical artifacts can obscure true biological signals, leading to inaccurate cell type identification and differential expression results. Through careful experimental design, appropriate computational correction, and rigorous validation, researchers can mitigate these issues. The field continues to evolve with novel approaches like adversarial deep learning for batch correction and large language models for annotation, offering promising directions for more robust analysis. As single-cell technologies become more widely adopted, including in underrepresented populations and resource-limited settings, addressing these fundamental data challenges becomes increasingly critical for generating biologically meaningful and reproducible insights.
From Manual Curation to AI Assistants: A Guide to Annotation Methods
Cell type annotation is a foundational step in single-cell RNA sequencing (scRNA-seq) analysis, enabling researchers to determine the identity and function of individual cells within a complex tissue. This process transforms clusters of cells, identified computationally based on gene expression similarity, into biologically meaningful cell types and states [26]. Manual annotation, which leverages existing biological knowledge from marker gene databases and researcher expertise, is widely considered the gold standard against which automated methods are often benchmarked [1] [27]. While labor-intensive, this method provides critical, biologically grounded interpretations that are essential for understanding cellular composition, heterogeneity, and function in development, health, and disease [28] [26].
The fundamental challenge of cell type annotation arises from two biological realities: first, gene expression levels exist on a continuum, and second, transcriptional differences do not always equate to functional differences [28]. Manual annotation addresses this by integrating prior knowledge with dataset-specific evidence to assign cell identities, a process that remains indispensable for generating reliable biological insights from scRNA-seq data [27].
Foundational Concepts and Workflow
The process of manual cell type annotation relies on establishing connections between the gene expression patterns observed in scRNA-seq data clusters and previously documented cell type signatures. This typically follows a structured workflow that integrates computational outputs with biological knowledge.
The Manual Annotation Workflow
The following diagram illustrates the standard workflow for manual cell type annotation, from data preparation to final annotation and validation.
Key Preparatory Steps
Before beginning manual annotation, specific computational preprocessing steps are essential:
- Clustering Analysis: Cells are grouped based on gene expression similarity using algorithms such as Louvain or Leiden [29]. These clusters form the basic units for annotation.
- Differential Expression Analysis: For each cluster, statistical tests identify genes that are significantly upregulated compared to all other cells. These potential marker genes are the primary evidence for cell identity [28].
- Dimensionality Reduction: Techniques like t-SNE or UMAP provide visual representations of cell relationships in two dimensions, helping annotators assess cluster quality and relationships [30].
Manual annotation relies heavily on curated databases that compile cell type-specific marker genes from published literature. The table below summarizes key resources available to researchers.
Table 1: Key Marker Gene Databases for Manual Cell Type Annotation
| Database Name | Key Features | Species Coverage | Update Status |
|---|---|---|---|
| singleCellBase | Manually curated; 9,158 entries; 1,221 cell types; 8,740 gene markers; hierarchical cell type structure [27] | 31 species across Animalia, Protista, Plantae [27] | 2023 |
| CellMarker 2.0 | Manually curated from >100k publications; user-friendly interface; includes pseudogenes and lncRNAs [28] | Human and mouse [28] | Last updated September 2022 [28] |
| PanglaoDB | Web server for exploration of mouse and human scRNA-seq data [27] | Human and mouse [27] | 2019 |
| MSigDB | Curated datasets C8 (human) and M8 (mouse); regularly updated by funded curators [28] | Human and mouse [28] | Regularly updated |
| Tabula Muris | Repository of scRNA-seq data from mouse; 20 different organs and tissues [28] | Mouse [28] | Highly cited resource |
These databases vary in scope and specialization. singleCellBase offers the broadest species coverage, while CellMarker 2.0 provides extensive curation from a large publication base. Selection should be guided by the organism and tissue type under investigation [28] [27].
Experimental and Methodological Framework
Step-by-Step Annotation Protocol
The manual annotation process follows a systematic approach to ensure accurate and reproducible results:
- Cluster Identification: Begin with well-defined cell clusters from computational analysis. High-quality clustering is essential, as poor separation can lead to ambiguous annotations [29].
- Marker Gene Extraction: Obtain the list of top differentially expressed genes for each cluster, typically ranked by statistical significance (adjusted p-value) and fold-change [28].
- Database Query: Cross-reference the top marker genes (typically 5-10 genes per cluster) against marker gene databases. For example, search "CD8A" in singleCellBase to confirm its association with CD8+ T cells in humans [27].
- Multi-Gene Validation: Avoid relying on a single marker gene. Instead, confirm that multiple known markers for a cell type are consistently expressed in the cluster. For instance, a plasma cell cluster should express both SDC1 (CD138) and MZB1 [28].
- Negative Marker Confirmation: Verify the absence of key markers for other cell types. A neuronal cluster should lack expression of immune cell markers like PTPRC (CD45) [28].
- Literature Correlation: Conduct targeted literature searches to confirm that the identified marker combination specifically identifies the proposed cell type in the relevant tissue context [28].
- Iterative Refinement: Revisit ambiguous annotations by examining additional markers or refining cluster resolution. Some cell subtypes may require subclustering for precise identification [28].
- Expert Consultation: Discuss challenging annotations with domain experts, particularly for specialized tissues or rare cell types [28].
- Experimental Validation: Where possible, confirm annotations using orthogonal methods such as fluorescent-activated cell sorting (FACS) with antibody staining or in situ hybridization [28].
The Scientist's Toolkit: Essential Research Reagents and Materials
Table 2: Key Research Reagent Solutions for scRNA-seq and Annotation
| Reagent/Material | Function in scRNA-seq and Annotation |
|---|---|
| 10x Genomics Chromium | Droplet-based single cell capture system for high-throughput scRNA-seq library preparation [26] |
| SMARTer Chemistry | For mRNA capture, reverse transcription, and cDNA amplification in scRNA-seq protocols [26] |
| Unique Molecular Identifiers (UMIs) | Short nucleotide barcodes that label individual mRNA molecules to correct for PCR amplification bias and enable accurate transcript counting [26] [30] |
| Fluorescent-Activated Cell Sorter (FACS) | Instrument for isolating specific cell populations based on surface protein markers for validation studies [8] |
| Antibody Panels (Oligo-conjugated) | For CITE-seq and similar technologies that simultaneously measure surface protein expression and transcriptome in single cells [29] |
| Poly[T] Primers | Reverse transcription primers that specifically capture polyadenylated mRNA molecules, excluding ribosomal RNAs [26] |
Interpretation and Quality Assessment
Addressing Annotation Challenges
Even with rigorous methodology, manual annotation presents several challenges that require careful interpretation:
- Low-Heterogeneity Cell Populations: Cell types with similar transcriptional profiles (e.g., developmental intermediates, stromal subtypes) pose particular difficulties. In such cases, LLM-based tools like LICT have demonstrated higher annotation credibility compared to manual annotations in some benchmarks [1].
- Novel Cell Populations: Some clusters may not match known cell types, potentially representing novel cell states or types. These should be clearly labeled as "unknown" or given descriptive names based on their marker expression until further validation [28].
- Conflicting Evidence: Discrepancies between different database sources or between database information and dataset-specific expression patterns require resolution through additional literature review or experimental validation [28].
Credibility Assessment Framework
Recent advancements provide objective frameworks to evaluate annotation reliability. The LICT tool, for example, uses a credibility evaluation strategy where an annotation is considered reliable if more than four marker genes are expressed in at least 80% of cells within the cluster [1]. This quantitative approach can complement expert judgment, particularly for challenging annotations.
Manual annotation remains an essential methodology in single-cell genomics, providing biologically grounded cell identities that form the foundation for downstream analysis. While increasingly complemented by automated tools and AI-based approaches, the integration of marker gene databases and biological expertise continues to offer unparalleled interpretative power [1] [27]. As the field advances, the manual annotation process is evolving to incorporate more quantitative credibility assessments [1] while maintaining its core strength: the nuanced integration of established biological knowledge with dataset-specific evidence. This approach ensures that cell type annotations reflect genuine biological reality rather than computational artifacts, enabling more reliable discoveries in biomedical research and drug development.
Cell type annotation is a foundational step in the analysis of single-cell RNA sequencing (scRNA-seq) data. This process involves classifying individual cells into specific biological categories based on their gene expression profiles, transforming complex molecular data into biologically meaningful insights. In traditional scRNA-seq analysis, researchers manually annotate cell clusters by comparing highly expressed genes with known cell type marker genes, a process that is both time-consuming and subjective, requiring significant expert knowledge. The emergence of spatial transcriptomics technologies, which add a spatial dimension to gene expression data, has further heightened the importance of accurate cell type identification. These technologies can be broadly categorized into sequencing-based platforms, such as 10x Visium and Slide-seq, which profile the whole transcriptome but typically at multi-cell resolution, and imaging-based platforms, including 10x Xenium and MERSCOPE, which achieve true single-cell resolution while measuring a targeted panel of several hundred genes [31] [32].
Reference-based cell type annotation methods automate this classification process by leveraging existing, expertly annotated datasets. These methods transfer cell type labels from a reference dataset (often a comprehensive scRNA-seq atlas) to a query dataset (new experimental data) based on similarity in gene expression patterns. This approach offers significant advantages over manual annotation by increasing throughput, standardization, and reproducibility, while effectively leveraging the knowledge embedded in well-curated reference datasets. Tools such as SingleR, Azimuth, RCTD, scPred, and scmap have been developed to perform this task, each implementing distinct computational strategies to achieve accurate cell type transfer [31] [32] [33].
Core Mechanisms of Reference-Based Annotation
The Fundamental Principles of Label Transfer
Reference-based annotation methods fundamentally operate by comparing the gene expression profile of each cell in a query dataset against profiles in a reference dataset. The core assumption is that cells of the same type will exhibit similar expression patterns across a defined set of genes, despite technical variations between experiments. This process involves several key steps: data preprocessing (normalization, gene matching), similarity calculation between query cells and reference data, and label assignment based on optimal matches. Performance depends critically on the quality and compatibility of the reference dataset, which should encompass the expected cell types in the query and be generated using a compatible technology platform. These methods are particularly valuable for annotating data from technologies with limited gene panels, such as imaging-based spatial transcriptomics, where manual annotation based on marker genes becomes exceptionally challenging [31] [32].
SingleR: Correlation-Based Cell-to-Cell Annotation
SingleR (Single-cell Recognition) employs a direct correlation-based approach for unbiased cell type recognition. Its algorithm operates through several stages. First, it performs pairwise marker detection across all labels in the reference dataset. For each label, it identifies genes upregulated compared to every other label, creating a union of marker genes that provide distinguishing power. Second, it calculates the Spearman correlation between each single query cell's expression and the reference expression profiles. Each query cell is independently compared to the reference, and the label from the most correlated reference cell is initially assigned. Finally, an optional fine-tuning step iteratively reassigns labels using a subset of markers specifically discriminatory between the top candidate types, thereby improving resolution for closely related cell subsets [34] [35].
Azimuth: Integrated Reference Mapping and Transfer Learning
Azimuth implements a more complex workflow centered around reference mapping and transfer learning. Rather than correlating individual cells, Azimuth first constructs a comprehensive reference model from an annotated scRNA-seq dataset. This model incorporates multiple components: a normalized expression matrix, a dimensionality reduction (typically PCA), and a neighborhood graph that captures transcriptional relationships between cells. When a query dataset is projected onto this reference, Azimuth utilizes a weighted voting scheme based on mutual nearest neighbors to determine the most likely cell type. This approach effectively maps query cells into a stable, pre-defined classification framework, making it particularly robust for standard cell types. Azimuth also provides confidence scores and can identify cells that do not confidently match any reference type [31] [32].
Performance Comparison of Annotation Tools
Benchmarking in Spatial Transcriptomics Applications
Recent benchmarking studies have evaluated the performance of reference-based annotation tools, particularly for emerging spatial transcriptomics technologies. A 2025 systematic comparison evaluated five reference-based methods (SingleR, Azimuth, RCTD, scPred, and scmapCell) against manual annotation using a 10x Xenium human breast cancer dataset. The study employed a paired single-nucleus RNA-seq dataset as reference to minimize technical variability, with accuracy assessed by similarity to manual annotations derived from known marker genes [31] [32].
Table 1: Performance Comparison of Cell Type Annotation Methods on Xenium Data
| Method | Accuracy | Speed | Ease of Use | Key Characteristics |
|---|---|---|---|---|
| SingleR | Highest | Fast | Easy | Results closely match manual annotation; Spearman correlation-based |
| Azimuth | High | Moderate | Moderate | Reference mapping with weighted voting; provides confidence scores |
| RCTD | Moderate | Slow | Complex | Designed for spatial data; can handle multi-cell resolutions |
| scPred | Moderate | Moderate | Moderate | Machine learning classification approach |
| scmapCell | Lower | Variable | Moderate | Cell projection based on nearest neighbors |
The benchmarking revealed that SingleR achieved the best overall performance for Xenium data, being both fast and accurate with results that closely matched manual annotation. Azimuth also performed well but with greater computational overhead. All reference-based methods faced challenges with the limited gene panels of imaging-based spatial technologies (typically 200-500 genes), though they still provided substantial time savings over completely manual approaches [31] [32].
Comparative Analysis Across Algorithm Types
Further comparative studies have examined the performance differences between cell-based and cluster-based annotation approaches, as well as knowledge-driven versus data-driven methods. A 2022 analysis of PBMC samples from COVID-19 patients and healthy controls compared five algorithms: Azimuth and SingleR (cell-based, data-driven), Garnett (cell-based, knowledge-driven), and scCATCH and SCSA (cluster-based, knowledge-driven). The evaluation measured the percentage of cells that could be confidently annotated by each method [33].
Table 2: Comparison of Cell Annotation Algorithm Types
| Algorithm Type | Examples | Confidently Annotated Cells | Strengths | Limitations |
|---|---|---|---|---|
| Cell-Based (Data-Driven) | SingleR, Azimuth | ~90% | High recall; handles heterogeneous populations | Requires high-quality reference dataset |
| Cell-Based (Knowledge-Driven) | Garnett | ~85% | No reference needed; uses marker genes | Limited by completeness of marker knowledge |
| Cluster-Based (Knowledge-Driven) | scCATCH, SCSA | ~50-60% | Intuitive; matches biology workflow | Lower recall; depends on clustering quality |
The analysis demonstrated that cell-based algorithms consistently annotated a higher percentage of cells confidently compared to cluster-based approaches. This finding was somewhat counterintuitive, as cluster-based annotation was thought to benefit from reduced noise by aggregating cell-level data. However, the superior performance of cell-based methods highlights the importance of making predictions at the natural unit of measurement (individual cells) before aggregation [33].
Experimental and Methodological Protocols
Standardized Workflow for Reference-Based Annotation
Implementing reference-based annotation requires careful attention to experimental design and computational methodology. The following protocol outlines a standardized workflow for applying these tools to spatial transcriptomics data, based on recently published best practices [31] [32]:
1. Reference Dataset Preparation
- Obtain a high-quality scRNA-seq or snRNA-seq reference with expert annotation
- Perform quality control: remove low-quality cells, doublets, and unannotated cells
- Normalize data using standard methods (e.g., SCTransform in Seurat)
- Identify highly variable genes (1,000-2,000 genes typically)
- For Azimuth: generate a reference model using AzimuthReference() function
- For SingleR: prepare reference as SingleCellExperiment object
2. Query Dataset Processing
- For Xenium data: remove cells labeled "Unlabeled" by initial processing
- Normalize expression values (log-normalize or SCTransform)
- For limited gene panels (e.g., Xenium): use all genes instead of selecting variable genes
- Scale data and perform dimensionality reduction (PCA)
3. Cell Type Annotation Execution
- Apply chosen method with appropriate parameters:
- SingleR: Use SingleR() function with reference and query datasets
- Azimuth: Use RunAzimuth() for integrated mapping
- RCTD: Adjust parameters (UMImin=0, genecutoff=0) to retain all cells
- For cluster-based methods: first perform clustering (Seurat FindClusters) then annotate
4. Result Validation
- Compare composition of predicted cell types with manual annotation
- Validate using known marker genes not used in annotation
- Assess spatial distributions for expected patterns (e.g., tumor-immune interactions)
Special Considerations for Spatial Transcriptomics Data
Applying reference-based annotation to imaging-based spatial transcriptomics requires specific methodological adjustments. The small gene panel size (~200-500 genes) presents particular challenges, as standard variable gene selection becomes less reliable. In these cases, using all detected genes often yields better results. Additionally, the choice of reference is crucial—ideally, a paired single-cell dataset from the same sample or study should be used to minimize batch effects and biological variability. When analyzing cancer samples, additional validation methods such as inferCNV (for copy number variation) should be incorporated to distinguish malignant from non-malignant cells, as gene expression alone may be insufficient for this critical distinction [31].
Essential Research Reagents and Computational Tools
Table 3: Research Reagent Solutions for Cell Type Annotation
| Tool/Category | Specific Examples | Function/Purpose |
|---|---|---|
| Spatial Transcriptomics Platforms | 10x Xenium, 10x Visium, MERSCOPE, CosMx | Generate spatial gene expression data at cellular or near-cellular resolution |
| Reference-Based Annotation Software | SingleR, Azimuth, RCTD, scPred, scmap | Automate cell type identification using reference datasets |
| Single-Cell Analysis Ecosystems | Seurat (R), Scanpy (Python), SingleCellExperiment (R) | Provide environments for data preprocessing, normalization, and analysis |
| Reference Datasets | Human Cell Landscape, Tabula Sapiens, Mouse Cell Atlas, ImmGen | Curated single-cell atlases serving as annotation sources |
| Quality Control Tools | scDblFinder, DoubletFinder, InferCNV | Identify doublets, low-quality cells, and copy number variations |
Emerging Trends and Future Directions
The field of automated cell type annotation continues to evolve with several emerging trends. Multimodal integration approaches are being developed that combine transcriptomic with epigenetic, proteomic, and spatial information for more definitive cell classification. The emergence of large language models like GPT-4 shows surprising promise for cell type annotation, with recent studies demonstrating strong concordance with manual annotations when provided with marker gene information [13]. However, these AI-based approaches present new challenges regarding reproducibility, verification, and potential "hallucination" of cell types.
Another significant trend is the development of technology-specific references that account for platform-specific biases, particularly important when annotating data from targeted gene panels. As spatial transcriptomics matures, methods are increasingly incorporating spatial context directly into annotation decisions, using neighborhood information to refine predictions based on expected cellular distributions and interactions. Finally, the field is moving toward more standardized evaluation frameworks and benchmark datasets to objectively assess the performance of existing and new annotation algorithms across diverse biological contexts and technological platforms [31] [32] [36].
Single-cell RNA sequencing (scRNA-seq) has revolutionized biological research by enabling the characterization of cellular composition in complex tissues at unprecedented resolution. A fundamental step in scRNA-seq data analysis is cell type annotation, the process of assigning specific identity labels to individual cells based on their transcriptional profiles [37] [38]. Traditional annotation methods rely on manual cluster annotation using established marker genes, which introduces challenges including subjectivity, time-intensive processes, and irreproducibility across experiments and research groups [37] [39]. As scRNA-seq technologies continue to scale, processing thousands to millions of cells per experiment, these limitations become increasingly prohibitive [37].
Supervised machine learning approaches have emerged to address these challenges by enabling automatic cell identification [37] [39]. These methods leverage pre-annotated reference datasets to train classification models that can predict cell identities in new, unannotated data. This technical guide provides an in-depth examination of two prominent tools in this domain: CellTypist and scPred, framing their methodologies, performance characteristics, and implementation within the broader context of automated cell classification workflows for single-cell RNA sequencing research.
CellTypist
CellTypist is a computational platform designed for accurate and scalable automated cell type annotation [40]. The tool employs regularized linear models powered by Stochastic Gradient Descent (SGD), balancing prediction performance with computational efficiency [40]. CellTypist functions as both a classification algorithm and a knowledge base, providing access to curated reference models and cell type ontologies. Its Python-based implementation is designed for seamless integration into existing scRNA-seq analysis pipelines, offering both command-line and interactive web-based interfaces to accommodate diverse user preferences and computational environments [40].
scPred
scPred is a generalized method for single-cell classification that combines dimensionality reduction with machine learning probability-based prediction [38]. The methodology employs a two-stage approach: first decomposing the variance structure of gene expression data to identify informative features in a reduced-dimension space, then applying machine learning classifiers to estimate the effects of these features on cell type discrimination [38]. A distinctive feature of scPred is its incorporation of a rejection option, where cells with conditional class probabilities below a defined threshold (default: 0.9) are labeled as "unassigned" rather than being assigned to low-confidence classifications [38]. This approach helps mitigate misclassification when novel cell types not represented in the training data are present in test datasets.
Methodological Approaches: A Technical Comparison
Core Algorithmic Differences
Table 1: Core Methodological Comparison Between CellTypist and scPred
| Feature | CellTypist | scPred |
|---|---|---|
| Core Algorithm | Regularized linear models with Stochastic Gradient Descent | Combination of dimensionality reduction and machine learning probability-based prediction |
| Feature Selection | Not explicitly described | Unbiased feature selection from reduced-dimension space |
| Primary Output | Cell type labels | Conditional class probabilities with rejection option |
| Implementation | Python package and web tool | R package |
| Reference Dependence | Can utilize built-in reference models or user-provided training data | Requires user-provided training data |
Workflow Comparison
The following diagrams illustrate the distinct methodological workflows employed by CellTypist and scPred:
Figure 1: CellTypist employs a streamlined workflow centered on regularized linear models with optional majority voting to refine predictions.
Figure 2: scPred utilizes dimensionality reduction and probability thresholding with a rejection option for uncertain classifications.
Performance Benchmarking and Experimental Evaluation
Quantitative Performance Metrics
Independent benchmarking studies evaluating 22 classification methods across 27 scRNA-seq datasets provide critical insights into the relative performance of automated cell identification tools [37]. The evaluation employed two experimental setups: intra-dataset (5-fold cross-validation within datasets) and inter-dataset (training on reference data and predicting on independent datasets) [37].
Table 2: Performance Comparison of Classification Methods Across Diverse Datasets
| Dataset | Top Performing Tools | Key Performance Metrics | Context |
|---|---|---|---|
| Pancreatic Datasets (Baron Mouse, Baron Human, Muraro, Segerstolpe, Xin) | SVM, scPred, scmap-cell, scmap-cluster, ACTINN, singleCellNet | SVM was the only classifier consistently ranked in top five across all five pancreatic datasets | Evaluation of 22 classifiers across multiple pancreatic cell types [37] |
| CellBench (10X and CEL-Seq2) | All classifiers | Median F1-score ≈ 1.0 | Five sorted lung cancer cell lines with high separability [37] |
| Tabula Muris (55 cell populations) | SVM-rejection, SVM, scmap-cell, Cell-BLAST, scPred | Median F1-score > 0.96 | Large dataset with deep annotation level testing scalability [37] |
| Allen Mouse Brain (3, 16, and 92 populations) | SVM-rejection, scmap-cell, scPred, SVM, ACTINN | Performance maintained across annotation levels (AMB3: F1 > 0.99) | Evaluation of performance across different annotation resolutions [37] |
The benchmarking revealed that while most classifiers perform well across diverse datasets, accuracy typically decreases for complex datasets with overlapping cell populations or deep annotation levels [37]. Notably, general-purpose support vector machine (SVM) classifiers demonstrated consistently strong performance across experimental setups, with scPred and related single-cell-specific methods also ranking among top performers [37].
scPred Performance in Specific Applications
In application to tumor cell identification, scPred demonstrated exceptional performance when trained to distinguish between tumor and non-tumor epithelial cells using surgical biopsies from stage IIA intestinal gastric adenocarcinoma [38]. The method achieved a sensitivity of 0.979 and specificity of 0.974 (AUROC = 0.999, AUPRC = 0.999, F1 score = 0.990) across ten bootstrap replicates [38]. This performance surpassed alternative approaches using differentially expressed genes as features, which achieved sensitivity and specificity of approximately 0.90 [38].
Experimental Protocols and Implementation
CellTypist Implementation
Figure 3: CellTypist implementation workflow showing installation through results generation.
CellTypist provides a streamlined workflow for automated cell type annotation [40]. The installation is available through standard Python package management systems:
The typical analytical workflow involves:
- Data Preparation: Format input data as .csv or .h5ad files containing gene expression matrices [40]
- Model Application: Execute the annotation process, optionally enabling majority voting to refine predictions
- Result Interpretation: Examine predicted labels and confidence metrics
Example implementation code:
scPred Implementation
scPred is implemented as an R package, available through GitHub [38]. The methodology follows these key analytical steps:
Training Phase:
- Input a training cohort of single-cell data with known cell identities
- Perform dimensionality reduction to capture major sources of transcriptional variation
- Identify informative features in the reduced-dimension space
- Train a machine learning classifier (e.g., SVM) using these features
Prediction Phase:
- Apply the trained model to new single-cell data
- Calculate conditional class probabilities for each cell
- Assign cell type labels where probabilities exceed the defined threshold (default: 0.9)
- Label cells with probabilities below threshold as "unassigned"
A critical implementation consideration for scPred is the probability threshold selection, which balances classification confidence with the proportion of unassigned cells [38].
Table 3: Essential Research Reagents and Computational Resources for Automated Cell Type Annotation
| Resource Type | Specific Examples | Function/Purpose | Considerations |
|---|---|---|---|
| Reference Datasets | Tabula Muris, Human Cell Atlas, Allen Mouse Brain | Provide annotated training data for supervised classification | Ensure compatibility with target dataset (species, tissue, protocol) [37] |
| Marker Gene Databases | ScType database, CellTypist models | Curated collections of cell-type specific markers for annotation | Specificity across cell types and sensitivity to technical variation [41] |
| Single-Cell Technologies | 10X Genomics, CEL-Seq2, inDrops | Generate input gene expression matrices | Platform-specific biases affect cross-dataset compatibility [37] |
| Quality Control Metrics | Mitochondrial read percentage, detected genes per cell, total UMI counts | Ensure input data quality for reliable classification | Strict QC essential for both training and query datasets [37] |
| Normalization Methods | LogNormalize, SCTransform, scran | Standardize expression values across cells | Choice affects downstream classification performance [38] |
Discussion and Future Perspectives
The comprehensive benchmarking of automated cell identification methods reveals that both CellTypist and scPred rank among the better-performing approaches, with the general-purpose support vector machine classifier demonstrating consistently strong performance across diverse experimental conditions [37]. Key considerations for method selection include:
- Dataset Complexity: Performance decreases for datasets with overlapping cell populations or deep annotation levels [37]
- Computational Resources: Large-scale datasets (>50,000 cells) require consideration of computational efficiency and scalability [37]
- Reference Availability: Method performance depends on the availability of high-quality reference data matching the biological context of interest
- Novel Cell Type Detection: Methods with rejection options (like scPred) provide safeguards against misclassification of unknown cell types [38]
Emerging directions in automated cell type annotation include the integration of large language models (LLMs) for marker gene interpretation [1] [42], multi-model integration strategies to leverage complementary strengths of different algorithms [1], and cross-platform harmonization to address technical variability between experimental protocols [43]. As single-cell technologies continue to evolve toward higher throughput and spatial resolution [43], the development of robust, scalable, and accurate classification methods will remain essential for extracting biologically meaningful insights from complex cellular landscapes.
In single-cell RNA sequencing (scRNA-seq) research, cell type annotation represents one of the most fundamental yet challenging tasks in the analytical workflow. This process involves bridging the gap between an uncharacterized scRNA-seq dataset and prior biological knowledge to determine the biological state represented by each cluster of cells. Indeed, the concept of a "cell type" itself lacks a clear definition, with most practitioners operating on a "I'll know it when I see it" intuition that is not amenable to computational analysis [22]. This interpretation of scRNA-seq data is often manual and has historically constituted a significant bottleneck in analysis pipelines [22]. The advent of Large Language Models (LLMs) promises to transform this laborious process into a semi- or fully automated procedure, offering unprecedented scalability and consistency while reducing the expertise required for accurate annotation [13].
LLMs as Annotation Tools: From Text to Transcriptomes
Large Language Models are sophisticated artificial intelligence systems based on deep learning architectures, typically transformers, characterized by billions of parameters and extensive training on diverse text corpora [44] [45]. Their application has expanded beyond traditional natural language processing to bioinformatics, where they address challenges associated with large and complex biological datasets [44]. In the context of scRNA-seq analysis, LLMs like GPT-4 can accurately annotate cell types using marker gene information, generating annotations that exhibit strong concordance with manual annotations provided by domain experts [13]. This capability is particularly valuable given that current data sharing protocols often lack processed expression matrices and cell-level annotations, creating significant barriers for data integration [46].
Table 1: Core Capabilities of LLMs in Single-Cell Annotation
| Capability | Description | Research Implication |
|---|---|---|
| Marker Gene Interpretation | LLMs analyze lists of differentially expressed genes to infer cell identity | Reduces need for manual literature searches for marker gene validation |
| Contextual Reasoning | Models incorporate article background information during annotation | Aligns automated annotations with original authors' biological understanding |
| Multi-Task Processing | Ability to perform normalization, clustering, and annotation sequentially | Enables fully automated pipelines from raw data to annotated output |
| Knowledge Integration | Leverages vast training data across various tissues and cell types | Broader application across diverse tissues compared to specialized reference datasets |
Comprehensive Benchmarking of LLM Performance
Performance Across Model Architectures
Recent benchmarking studies have evaluated LLMs across hundreds of tissue and cell types, with models generating cell type annotations that exhibit strong concordance with manual annotations [13]. The AnnDictionary package, an open-source tool built specifically for LLM provider-agnostic cell type annotation, has facilitated the first comprehensive benchmarking of all major LLMs at de novo cell type annotation [47]. Results demonstrate that LLM annotation of most major cell types achieves more than 80-90% accuracy, with performance varying significantly based on model size and architecture [47].
Table 2: Quantitative Benchmarking of LLM Performance on Annotation Tasks
| Model | Annotation Agreement with Experts | Key Strengths | Notable Limitations |
|---|---|---|---|
| Claude 3.5 Sonnet | Highest agreement with manual annotation [47] | Optimal for complex, context-rich annotation tasks | |
| GPT-4 | Strong concordance across hundreds of cell types [13] | Robust performance in standardized benchmarking | Struggles with distinct gene sets in certain cancers (e.g., B lymphoma) [13] |
| GPT-3.5 | Lower agreement compared to GPT-4 [13] | Cost-effective for preliminary annotations | Reduced accuracy on nuanced cell subtypes |
| Claude 3 Opus | Competitively high agreement on complex tasks [48] | Excellent contextual understanding | |
| Gemini 2.5 | 86.4% on GPQA Diamond benchmark [49] | Superior multimodal reasoning capabilities |
Task-Specific Performance Variations
LLM performance varies considerably across different annotation scenarios. Models demonstrate particular proficiency with immune cells like granulocytes compared to other cell types [13]. Performance also dips slightly in small cell populations comprising no more than ten cells, possibly due to limited available information [13]. Furthermore, annotations show higher agreement for major cell types (e.g., T cells) than for subtypes (e.g., CD4 memory T cells), though over 75% of subtypes still achieve full or partial matches with manual annotations [13]. In some cases, LLMs provide more granular annotations than manual methods, such as distinguishing between fibroblasts and osteoblasts among cells manually annotated broadly as stromal cells [13].
Experimental Protocols for LLM-Based Annotation
Standardized Annotation Workflow
The foundational protocol for LLM-based cell type annotation involves a structured pipeline that transforms raw gene expression data into biologically meaningful annotations. The scExtract framework exemplifies this approach by implementing an LLM agent that emulates human expert analysis, automatically processing datasets while incorporating article background information [46]. This process begins with cell filtering and preprocessing, proceeds through unsupervised clustering, and culminates in cell population annotation, with LLMs extracting relevant parameters from research articles to guide each step [46].
Figure 1: LLM-Based Cell Type Annotation Workflow
Advanced Methodological Considerations
For optimal performance, research indicates that GPT-4 performs best when using the top ten differential genes, with differential genes derived using the two-sided Wilcoxon test [13]. The model exhibits similar accuracy across various prompt strategies, including a basic prompt strategy, a chain-of-thought-inspired prompt strategy that includes reasoning steps, and a repeated prompt strategy [13]. In the clustering phase, prompts can extract the number of cluster groups from articles as external parameters, or infer this information from the article's content when not explicitly stated, leveraging the authors' prior knowledge to preserve biological significance [46].
Table 3: Research Reagent Solutions for scRNA-seq Annotation
| Resource | Type | Function | Application Context |
|---|---|---|---|
| AnnDictionary | Software Package | LLM-provider-agnostic Python package for cell type annotation | Enables benchmarking and deployment of multiple LLMs with minimal code changes [47] |
| scExtract | Analysis Framework | Leverages LLMs for fully automated extraction and integration of published scRNA-seq data | Processes datasets using parameters and knowledge extracted from research articles [46] |
| CellMarker 2.0 | Marker Database | Manually curated resource of cell type markers from >100k publications | Provides reference marker genes for validation of LLM annotations [28] |
| Azimuth | Web Application | Reference-based pipeline for normalization, visualization, and cell annotation | Uses popular Seurat algorithm, requires no programming experience [28] |
| Tabula Sapiens | Reference Atlas | Human cell atlas with transcriptomic data of 28 organs from 24 normal subjects | Provides tissue-specific reference for validating LLM annotations [28] |
| GPTCelltype | R Package | Interface for GPT-4's automated cell type annotation | Integrates with existing single-cell analysis pipelines like Seurat [13] |
Integration and Automation: Advanced Applications
From Annotation to Integrated Analysis
The true power of LLMs in single-cell research emerges when annotation is coupled with integration pipelines. The scExtract framework demonstrates this by combining LLM-based annotation with modified versions of scanorama and cellhint that incorporate prior annotation information to enhance dataset integration [46]. This approach, termed scanorama-prior, adjusts weighted distances between cells across datasets based on prior differences between cell types, achieving more accurate neighbor construction in mutual nearest neighbor (MNN) algorithms [46]. When shifting cells between datasets, scanorama-prior tends to move original cell groups as cohesive units toward corresponding groups in the target dataset, applying additional adjustment vectors based on cell group centers and annotation similarity [46].
Figure 2: LLM-Guided Data Integration Pipeline
Real-World Validation and Applications
In practice, these integrated approaches have demonstrated significant utility. Researchers applied the scExtract comprehensive pipeline to 14 skin scRNA-seq datasets encompassing various conditions, automatically constructing a skin immune dysregulation dataset comprising over 440,000 cells [46]. Analysis of this integrated dataset validated different activation programs of T helper cells across various diseases and revealed characteristic cell cluster expansion of proliferating keratinocytes in psoriasis [46]. This achievement highlights how LLM-facilitated annotation and integration can uncover novel biological insights from diverse single-cell omics datasets at scale.
Limitations and Future Directions
Despite their promising capabilities, LLMs present important limitations for cell type annotation. The undisclosed nature of training corpora makes verifying the basis of annotations challenging, requiring human evaluation to ensure quality and reliability [13]. High noise levels in scRNA-seq data and unreliable differential genes can adversely affect GPT-4's annotations, and over-reliance risks artificial intelligence hallucination [13]. Additionally, annotation reproducibility, while generally high at 85% for identical marker genes, shows a Cohen's κ of 0.65 between different GPT-4 versions, indicating substantial but imperfect consistency [13]. Future developments may include fine-tuning LLMs with high-quality reference marker gene lists to further improve performance [13].
The revolution in cell type annotation through LLMs represents a paradigm shift in single-cell research methodology. Current evidence indicates that LLMs consistently outperform outsourced human coders in complex annotation tasks, achieving superior accuracy with higher internal consistency [48]. For researchers implementing these tools, we recommend: (1) employing Claude 3.5 Sonnet for tasks requiring the highest agreement with manual annotation; (2) utilizing the AnnDictionary package for flexible, multi-LLM benchmarking; (3) implementing the scExtract framework for large-scale integration projects; and (4) maintaining expert validation of critical annotations to mitigate hallucination risks. As LLM technology continues to advance, these tools will increasingly become indispensable components of the single-cell researcher's toolkit, transforming annotation from a bottleneck into an accelerator of biological discovery.
Cell type annotation is a fundamental and indispensable step in the analysis of single-cell RNA sequencing (scRNA-seq) data. This process involves assigning specific biological identities to individual cells or clusters of cells based on their gene expression profiles, enabling researchers to interpret vast datasets and understand complex biological systems [11]. scRNA-seq technology has revolutionized biological research by providing unprecedented opportunities to profile thousands of individual cells in a single experiment, compile single-cell atlases, identify novel and rare cell types and states, reveal intracellular and intercellular interactions, and characterize microenvironment composition [11]. The accurate identification of cell types is critical for drawing meaningful biological conclusions from these complex datasets.
The traditional approach to cell type annotation has relied heavily on manual curation, where domain experts compare cluster-specific upregulated marker genes with prior knowledge of cell-type markers derived from scientific literature [11]. While this method benefits from professional expertise and can identify subtle cellular characteristics, it is labor-intensive, time-consuming, and requires specialized knowledge that may not be readily available in all research settings [11] [50]. The limitations of manual annotation have become increasingly apparent as scRNA-seq datasets continue to grow in size and complexity, creating a pressing need for more scalable, reproducible, and accessible computational solutions.
In response to these challenges, several automated and semi-automated computational methods have been developed, leveraging diverse approaches including gene set enrichment, reference dataset mapping, and more recently, artificial intelligence and natural language processing techniques [42] [11]. This technical guide provides an in-depth examination of three prominent resources—ACT, AnnDictionary, and GPTCelltype—that represent the cutting edge of automated cell type annotation tools, each employing distinct methodological frameworks to address the critical task of cell identity assignment in single-cell research.
ACT: Annotation of Cell Types
Computational Framework and Methodology
ACT (Annotation of Cell Types) is a comprehensive web server that combines a hierarchically organized marker map with a sophisticated enrichment algorithm to facilitate efficient cell type annotation [11] [50] [51]. The foundation of ACT is a manually curated database of over 26,000 cell marker entries collected from approximately 7,000 publications, which underwent rigorous standardization and quality control procedures [11]. The computational core of ACT is WISE (Weighted and Integrated gene Set Enrichment), a method specifically designed to associate input cell clusters with hierarchically organized cell types in the marker map [11].
The WISE method employs a weighted hypergeometric test (WHG) to evaluate whether input differentially upregulated genes (DUGs) are overrepresented in canonical markers associated with specific cell types [11]. A key innovation of WISE is its incorporation of marker usage frequency as a weighting factor, giving greater significance to frequently used markers that typically demonstrate higher reliability in cell type annotation [11]. The mathematical implementation involves calculating the overrepresentation of an input gene set X in a marker set Mc for cell type c using the formula:
$$ P{whg} = \sum{a=k+1}^{min(m,n)} \frac{\binom{m}{a} \binom{N-m}{n-a}}{\binom{N}{n}} $$
where N represents the weighted sum of all protein-coding genes, n denotes the weighted sum of genes in the input set X, m signifies the weighted sum of genes in the marker set Mc, and k corresponds to the weighted sum of overlap genes between X and Mc [11]. This statistical approach, combined with the hierarchical organization of cell types, enables ACT to provide multi-level and refined cell type identifications.
Experimental Implementation Protocol
Implementing ACT for cell type annotation requires the following step-by-step protocol:
Input Preparation: Generate a list of upregulated genes for each cell cluster using standard differential expression analysis tools (e.g., Seurat's
FindAllMarkersfunction or Scanpy's differential expression methods). The input should be a simple list of upregulated genes, optionally ranked by statistical significance or fold change [11].Web Server Access: Navigate to the ACT web server at either http://xteam.xbio.top/ACT/ or http://biocc.hrbmu.edu.cn/ACT/ [11] [51].
Parameter Specification: Select the appropriate species (human or mouse) and tissue type. ACT provides both tissue-specific and pan-tissue marker maps, with the latter particularly useful for less-studied tissues [11].
Analysis Execution: Submit the input gene list to the server. ACT will process the data through its WISE enrichment method against the hierarchical marker map.
Result Interpretation: Review the interactive hierarchy maps, statistical charts, and enrichment results provided by the web interface. The output includes comprehensive visualizations that illustrate the relationships between canonical markers and differentially expressed genes, enabling researchers to make informed decisions about cell type assignments [11] [51].
Table 1: Key Components of the ACT Framework
| Component | Description | Technical Specification |
|---|---|---|
| Marker Map | Hierarchically organized database of cell markers | 26,000+ marker entries from 7,000 publications [11] |
| WISE Method | Weighted and Integrated gene Set Enrichment | Weighted hypergeometric test with frequency-based weighting [11] |
| Tissue Coverage | Human and mouse tissues with ontological structure | Uber-anatomy Ontology integration with expansion [11] |
| Cell Type Standardization | Unified cell nomenclature system | Cell Ontology mapping with context-aware tissue integration [11] |
Performance and Applications
Benchmarking analyses demonstrate that ACT outperforms state-of-the-art methods in accuracy and reliability [11]. When applied to case studies, ACT successfully annotated all cell clusters quickly and accurately, identifying multi-level and refined cell types that comparable to expert manual annotation [11] [50]. The hierarchical organization of the marker map enables users to explore cell type annotations at different levels of specificity, from broad cellular categories to highly specialized subtypes. Additionally, ACT provides visualization tools that illustrate the prevalence of canonical markers and their expression patterns in integrative multiple organ scRNA-seq data of human and mouse, further enhancing the annotation process [51].
AnnDictionary: LLM-Based Annotation Framework
Architecture and Technical Innovation
AnnDictionary represents a paradigm shift in cell type annotation by leveraging large language models (LLMs) through a flexible, provider-agnostic Python package built on top of AnnData and LangChain [47]. This innovative framework enables parallel, independent analysis of multiple anndata objects with numerous multithreading optimizations to support both small-scale experiments and atlas-scale data [47]. A key technical advancement in AnnDictionary is its formalization of the AdataDict class (a dictionary of anndata objects) and the implementation of the fapply method, which operates similarly to R's lapply() or Python's map() functions but with enhanced error handling and retry mechanisms specifically designed for large-scale single-cell data analysis [47].
The package consolidates common LLM integrations under a unified interface, supporting all major LLM providers including OpenAI, Anthropic, Google, Meta, and models available on Amazon Bedrock [47]. This flexibility is achieved through a configurable LLM backend that can be switched with a single line of code via the configure_llm_backend() function, allowing researchers to leverage the latest advancements in language models without modifying their analysis pipelines [47]. AnnDictionary incorporates several technical advances over previous LLM implementations, including few-shot prompting, retry mechanisms, rate limiters, customizable response parsing, and comprehensive failure handling, all of which contribute to a more robust and user-friendly experience when annotating datasets [47].
Cell Type Annotation Methodology
AnnDictionary provides multiple approaches for cell type annotation, offering researchers flexibility based on their specific needs and available information:
Basic Marker Gene Annotation: This method uses a single list of marker genes derived from differential expression analysis to identify cell types through LLM reasoning [47].
Comparative Marker Gene Analysis: By employing chain-of-thought reasoning, this approach compares several lists of marker genes simultaneously to determine cell type identities [47].
Subtype Identification: This method builds upon comparative analysis by incorporating parent cell type context to derive more specific cellular subtypes [47].
Context-Aware Annotation: This advanced approach uses comparative analysis with additional context about the expected set of cell types in the tissue being studied [47].
A unique feature of AnnDictionary is its LLM agent designed to automatically determine cluster resolution from UMAP plots, leveraging chart-based reasoning capabilities of modern language models [47]. While the developers note that current LLMs may not reliably produce optimal resolutions, this functionality represents an innovative step toward fully automated single-cell data analysis.
Benchmarking Results and Performance
Comprehensive benchmarking of AnnDictionary across 15 different LLMs using the Tabula Sapiens v2 single-cell transcriptomic atlas revealed significant variation in annotation performance based on model size and architecture [47]. The study implemented standard pre-processing procedures for each tissue independently, including normalization, log-transformation, high-variance gene selection, scaling, PCA, neighborhood graph calculation, Leiden clustering, and differential expression analysis [47].
Table 2: AnnDictionary Benchmarking Results with Major LLMs
| LLM Model | Agreement with Manual Annotation | Inter-LLM Agreement | Notable Strengths |
|---|---|---|---|
| Claude 3.5 Sonnet | Highest | High | Overall accuracy and consistency [47] |
| GPT-4 | High | High | Strong performance across diverse tissues [47] [13] |
| GPT-3.5 | Moderate | Moderate | Cost-effective for preliminary annotations [13] |
| Other Models | Variable | Variable | Performance correlates with model size [47] |
The benchmarking results demonstrated that LLM annotation of most major cell types achieved more than 80-90% accuracy when compared to manual expert annotations [47]. Agreement was assessed using multiple metrics including direct string comparison, Cohen's kappa (κ), and LLM-derived ratings where models evaluated the quality of matches between automatic and manual labels as perfect, partial, or not-matching [47]. The maintainers of AnnDictionary have established a leaderboard (https://singlecellgpt.com/celltype-annotation-leaderboard) to track the performance of various LLMs on de novo cell type annotation tasks, providing researchers with up-to-date guidance on model selection [47].
GPTCelltype: GPT-4 Integrated Annotation
Software Design and Implementation
GPTCelltype is an R software package that provides reference-free automated cell type annotation by integrating GPT-4 directly into single-cell RNA-seq analysis pipelines [13] [52] [53]. This package is designed to function seamlessly with standard single-cell analysis workflows, particularly those built using the Seurat framework [52]. The core functionality centers around the gptcelltype() function, which can accept either a differential gene table returned by Seurat's FindAllMarkers() function or a custom list of genes, making it adaptable to various analysis scenarios [52].
A critical aspect of GPTCelltype's implementation is its handling of the OpenAI API key, which must be set as a system environment variable before execution to ensure security and prevent exposure of sensitive credentials [52] [53]. The package incorporates the openai R package to manage communications with the GPT-4 API, and when properly configured with a valid API key, it returns direct cell type annotations based on the input marker genes [52]. In cases where no API key is provided, the function outputs the carefully engineered prompt that users can manually submit through GPT chatbot interfaces, maintaining functionality regardless of API access [52].
Annotation Workflow and Optimization
The GPTCelltype workflow has been systematically optimized through rigorous testing across ten datasets covering five species and hundreds of tissue and cell types, including both normal and cancer samples [13]. Key optimization findings include:
Optimal Gene Input: GPT-4 performs best when using the top ten differential genes as input, with minimal improvement observed when including additional genes [13].
Differential Analysis Method: The two-sided Wilcoxon test produces differential genes that yield the highest annotation accuracy with GPT-4 [13].
Prompt Strategy: Basic, chain-of-thought, and repeated prompt strategies show similar performance, with the basic strategy being sufficient for most applications [13].
Tissue Context: Including tissue name as optional context (
tissuenameparameter) improves annotation accuracy for tissue-specific cell types [52].
The software demonstrates robust performance across diverse experimental conditions, successfully identifying malignant cells in colon and lung cancer datasets, though it may struggle with certain cancer types like B lymphoma that lack distinct gene sets [13]. Performance is slightly reduced for very small cell populations (≤10 cells) and when input gene sets contain significant noise, but remains substantially better than chance [13].
Diagram 1: GPTCelltype automated annotation workflow
Performance Benchmarking and Applications
Comprehensive evaluation demonstrates that GPT-4 generates cell type annotations exhibiting strong concordance with manual annotations, achieving full or partial matches in over 75% of cell types across most studies and tissues [13]. Performance is particularly high for immune cells like granulocytes and for major cell types compared to fine-grained subtypes, though over 75% of subtypes still achieve full or partial matches [13]. In some cases, discrepancies between GPT-4 and manual annotations actually reflect higher granularity provided by GPT-4, such as distinguishing between fibroblasts, osteoblasts, and chondrocytes within broadly annotated stromal cells [13].
Table 3: GPTCelltype Performance Comparison with Alternative Methods
| Method | Agreement with Manual Annotation | Speed | Cost | Key Advantages |
|---|---|---|---|---|
| GPTCelltype (GPT-4) | Substantially higher | Fastest | ~$0.1 per study [13] | Reference-free, high accuracy [13] |
| SingleR | Moderate | Slower | Free | Reference-based approach [13] |
| ScType | Moderate | Slower | Free | Marker-based method [13] |
| CellMarker2.0 | Lower | Slow | Free | Extensive marker database [13] |
When assessed for robustness in complex scenarios, GPT-4 demonstrates 93% accuracy in distinguishing between pure and mixed cell types and 99% accuracy in differentiating known from unknown cell types [13]. The annotations show high reproducibility, with identical outputs for the same marker genes in 85% of cases, and substantial consistency (Cohen's κ = 0.65) between different GPT-4 versions [13]. A notable advantage of GPTCelltype is its seamless integration with existing Seurat pipelines, requiring minimal additional coding and computational resources compared to methods that need separate reference datasets and processing pipelines [13] [52].
Comparative Analysis and Technical Considerations
Methodological Comparison
The three annotation resources examined in this guide represent distinct approaches to automated cell type annotation, each with characteristic strengths and limitations. ACT employs a knowledge-based enrichment approach grounded in a comprehensively curated marker database, providing hierarchical organization and statistical rigor [11]. AnnDictionary leverages the pattern recognition capabilities of large language models through a flexible, scalable framework that supports multiple LLM providers and parallel processing [47]. GPTCelltype utilizes the specific capabilities of GPT-4 in a specialized package optimized for seamless integration with Seurat-based workflows [13] [52].
A fundamental distinction between these approaches lies in their underlying methodologies. ACT and similar knowledge-based methods rely on established biological knowledge captured in curated databases, providing transparency and interpretability but potentially limiting discovery of novel cell types [11]. In contrast, LLM-based approaches like AnnDictionary and GPTCelltype leverage the vast biological knowledge embedded in their training data, potentially recognizing subtle patterns that might elude conventional methods but operating as "black boxes" with limited insight into their reasoning processes [47] [13].
Practical Implementation Guidelines
Selecting the appropriate annotation tool depends on multiple factors including research goals, computational resources, and technical expertise:
For Maximum Accuracy and Interpretability: ACT provides hierarchical results with statistical support and extensive visualization capabilities, making it suitable for comprehensive analysis and validation [11] [51].
For Large-Scale or Multi-Dataset Analysis: AnnDictionary offers parallel processing capabilities and flexibility in LLM selection, enabling efficient processing of atlas-scale data [47].
For Rapid Annotation in Established Pipelines: GPTCelltype delivers seamless integration with Seurat workflows, making it ideal for researchers already working within this ecosystem [52] [53].
For Novel Cell Type Discovery: LLM-based approaches may recognize subtle gene expression patterns suggestive of previously uncharacterized cell populations, though require experimental validation [47] [13].
Table 4: Technical Specifications and Resource Requirements
| Resource | Implementation | Dependencies | Input Requirements | Output Format |
|---|---|---|---|---|
| ACT | Web server | None | Upregulated gene lists [11] [51] | Interactive hierarchy maps, statistical charts [11] |
| AnnDictionary | Python package | AnnData, LangChain | Anndata objects, marker lists [47] | Cell type labels with verification recommendations [47] |
| GPTCelltype | R package | Seurat, openai | Seurat object or gene lists [52] | Cell type vector for direct integration [52] |
Limitations and Future Directions
Despite significant advances, all automated cell type annotation methods present limitations that researchers must consider. LLM-based approaches face challenges with reproducibility, potential "hallucinations," and dependence on proprietary models with undisclosed training data [47] [13]. Knowledge-based methods like ACT may struggle with rare or novel cell types absent from curated databases [11]. Additionally, performance degradation occurs with high noise levels in scRNA-seq data and unreliable differential genes across all methods [13].
Future developments in cell type annotation will likely focus on hybrid approaches that combine the interpretability of knowledge-based methods with the pattern recognition capabilities of LLMs [42]. The integration of single-cell long-read sequencing technologies for isoform-level transcriptomic profiling promises higher resolution annotations that may enable redefinition of cell types at unprecedented specificity [42]. As the field progresses, benchmarking standards and validation protocols will be essential for evaluating new methods and ensuring reliable biological discoveries [47] [3].
Essential Research Reagent Solutions
Table 5: Key Research Reagents and Computational Resources for Cell Type Annotation
| Resource Type | Specific Examples | Function in Annotation Process |
|---|---|---|
| Marker Gene Databases | ACT Marker Map (26,000+ entries) [11], CellMarker2.0 [13] | Reference knowledge base for cell type identity determination |
| LLM APIs | OpenAI GPT-4 API [52], Anthropic Claude 3.5 Sonnet [47] | Natural language processing for marker gene interpretation |
| Reference Datasets | Tabula Sapiens [47] [13], Mouse Cell Atlas [13] | Benchmarking and validation of annotation methods |
| Single-Cell Analysis Platforms | Seurat [52], Scanpy [47] | Pre-processing, clustering, and differential expression analysis |
| Specialized Algorithms | WISE enrichment [11], Robust Rank Aggregation [11] | Statistical methods for gene set analysis and marker prioritization |
Navigating Annotation Challenges: Noise, Rare Cells, and Technical Pitfalls
In single-cell RNA sequencing (scRNA-seq) research, cell type annotation is the process of classifying individual cells into known biological types based on their gene expression profiles [12]. The accuracy of this process is fundamentally dependent on the quality of the input data. Technical artifacts, batch effects, and low-quality cells can severely confound downstream analyses, leading to misannotation and erroneous biological conclusions [54] [55]. This technical guide provides an in-depth examination of the critical data preprocessing workflow—encompassing quality control (QC), batch effect correction, and their intimate connection to reliable cell type annotation. For researchers, scientists, and drug development professionals, mastering these foundational steps is not merely procedural but essential for generating biologically meaningful and reproducible results from complex scRNA-seq datasets.
Critical Preprocessing and Quality Control Steps
Key Quality Control Metrics and Their Interpretation
The initial QC stage aims to filter out low-quality cells while preserving biologically relevant cell populations [56] [57]. This requires a multifaceted approach, as no single metric can reliably distinguish between poor technical quality and genuine biological variation. The following QC metrics should be calculated and assessed for each cell, typically using tools like Seurat or Scanpy [56] [57].
Table 1: Essential QC Metrics for scRNA-seq Data
| QC Metric | Description | Interpretation | Common Thresholds |
|---|---|---|---|
| nCount_RNA | Total number of UMIs (molecules) per cell [56]. | Low counts may indicate damaged/empty cell; high counts may indicate multiplets [56] [55]. | Typically > 500-1000 [56]. |
| nFeature_RNA | Number of unique genes detected per cell [56]. | Low complexity (few genes) can indicate a dying cell [56]. | Assess jointly with other metrics [57]. |
| Mitochondrial Ratio | Percentage of transcripts mapping to mitochondrial genes [56] [57]. | High percentage indicates cell stress or broken membrane [57] [55]. | Highly variable; often >5-20% is flagged [57]. |
| Genes per UMI | Ratio of nFeatureRNA to nCountRNA (log10 transformed) [56]. | Measures data complexity; higher values indicate more complex data [56]. | >0.8 is generally good [56]. |
| Doublet Score | In silico prediction of multiple cells in one droplet [55]. | High scores indicate likely doublets/multiplets that create hybrid expression profiles [55]. | Sample and protocol-dependent [55]. |
A Standardized QC Workflow
A robust QC protocol involves calculating these metrics, visualizing their distributions, and applying informed filtering. The workflow can be manual, based on visual inspection of distributions, or automated using robust statistical methods.
- Calculate QC Metrics: Using a function like
sc.pp.calculate_qc_metricsin Scanpy orPercentageFeatureSetin Seurat, compute the key metrics for every cell barcode [56] [57]. It is crucial to correctly identify gene prefixes based on species (e.g., "MT-" for human, "mt-" for mouse) [57]. - Visualize Distributions: Plot the distributions of total counts, genes per cell, and mitochondrial ratio across all samples using violin plots, scatter plots, or histograms [56] [57]. This helps identify outliers and informs threshold selection.
- Apply Filtering Thresholds: Filter cells based on the interpreted metrics. Automatic thresholding using Median Absolute Deviations (MAD) is a robust and permissive strategy for large datasets, flagging cells that are 5 MADs from the median as outliers [57]. This helps avoid subjective manual thresholding and preserves rare cell populations.
- Remove Doublets: Employ algorithms like Scrublet or DoubletFinder to predict and remove doublets based on the expression profile similarity to in silico-generated doublets [55].
- Assess Ambient RNA: Use tools like
decontXorEmptyDropsto estimate and correct for contamination from ambient RNA—background RNA present in the cell suspension that can be captured and sequenced in empty droplets or even alongside a cell's native RNA [55].
The following diagram illustrates the logical sequence and decision points in a standardized QC workflow.
Figure 1: Standardized scRNA-seq Quality Control Workflow. The process begins with the raw count matrix and proceeds through metric calculation, visualization, and filtering. A key decision point is choosing between automatic or manual thresholding before applying filters and technical artifact corrections.
Batch Effect Correction: Enabling Cross-Dataset Analysis
The Challenge of Batch Effects
Batch effects are technical, non-biological variations introduced when samples are processed in different batches, at different times, with different protocols, or on different sequencing platforms [58]. These effects can confound biological variation, making it challenging to integrate and compare datasets—a common requirement for large-scale studies like atlas-building [54] [59]. If uncorrected, batch effects can lead to the misidentification of cell populations during annotation, where cells of the same type from different batches appear distinct, or distinct cells from the same batch appear artificially similar.
Numerous computational methods have been developed to address batch effects in scRNA-seq data. They differ significantly in their underlying algorithms, the data object they correct (e.g., count matrix, embedding), and their computational requirements [54].
Table 2: Comparison of Common scRNA-seq Batch Effect Correction Methods
| Method | Principle | Input | Correction Object | Key Considerations |
|---|---|---|---|---|
| Harmony | Iterative clustering in PCA space and linear batch correction within clusters [54] [59]. | Normalized counts | Low-dimensional embedding (PCA) | Fast runtime; recommended as a first choice; good balance of batch removal and biological conservation [54] [59]. |
| Seurat Integration | Uses CCA to find correlated features and MNNs as "anchors" to correct the data [58] [59]. | Normalized counts | Count matrix or embedding | A highly popular and widely used method [59]. |
| LIGER | Integrative non-negative matrix factorization (NMF) to factorize batches, then aligns quantiles [54] [59]. | Normalized counts | Factor loadings (embedding) | Designed to remove technical variation while preserving biological differences from batch-specific factors [59]. |
| MNN Correct | Identifies Mutual Nearest Neighbors (MNNs) between batches to compute a correction vector [60]. | Normalized counts | Count matrix | A foundational approach; can handle non-identical cell type compositions [60]. |
| ComBat / ComBat-seq | Empirical Bayes framework to adjust for batch effects using a linear or negative binomial model [54]. | Count matrix | Count matrix | Can introduce artifacts if model assumptions are violated [54]. |
| BBKNN | Corrects the k-Nearest Neighbor (k-NN) graph directly based on batch information [54]. | k-NN graph | k-NN graph | A fast, graph-based correction method [54]. |
| SCVI | Uses a deep learning (variational autoencoder) framework to model the data and infer a corrected latent representation [54]. | Raw count matrix | Latent space / Imputed counts | Powerful for large, complex datasets but may alter data considerably [54]. |
Evaluating Batch Correction Performance
Selecting an appropriate method is crucial, as over-correction can remove meaningful biological variation, while under-correction leaves confounding technical noise. Benchmarking studies recommend evaluating methods based on two primary criteria [54] [59]:
- Batch Mixing: How well cells from different batches are intermingled within the same cell type. Metrics like kBET and LISI are used to assess this [59].
- Biological Conservation: How well the separation between distinct cell types is preserved after correction. Metrics like ARI and ASW are used for this purpose [59].
Recent independent evaluations suggest that Harmony is a top-performing method, as it consistently removes batch effects while minimizing the introduction of artifacts and preserving biological variance [54] [59]. Its computational efficiency also makes it suitable for large-scale datasets.
The Scientist's Toolkit: Essential Research Reagents and Computational Tools
Successful scRNA-seq analysis relies on a combination of laboratory reagents and computational software packages.
Table 3: Essential Reagents and Tools for scRNA-seq Analysis
| Category | Item / Tool | Function / Description |
|---|---|---|
| Wet-Lab Reagents | 10x Genomics Chromium | Droplet-based single-cell partitioning and barcoding [61]. |
| Smart-Seq2 | Full-length transcriptome profiling via plate-based method [61]. | |
| Unique Molecular Identifiers (UMIs) | Barcodes for individual mRNA molecules to correct amplification bias [55]. | |
| Computational Tools & Packages | Seurat | Comprehensive R toolkit for single-cell analysis, including QC, integration, and clustering [56] [58]. |
| Scanpy | Comprehensive Python toolkit for single-cell analysis, analogous to Seurat [57]. | |
| singleCellTK (SCTK-QC) | R-based pipeline that streamlines and standardizes QC from multiple algorithms into one workflow [55]. | |
| Harmony (R Package) | Efficient batch effect correction algorithm and package [54] [58] [59]. | |
| Scrublet | Python tool for predicting doublets in scRNA-seq data [55]. | |
| Reference Databases | CellMarker, PanglaoDB | Databases of known marker genes to assist in cell type identification [12]. |
| Human Cell Atlas (HCA) | Large-scale reference of single-cell data from multiple human organs [12]. |
Connecting Data Quality to Reliable Cell Type Annotation
The processes of QC and batch correction are not isolated steps but are fundamentally intertwined with the accuracy and reliability of downstream cell type annotation. High-quality annotation depends on the removal of technical confounders so that cells cluster based on true biological identity.
Consider a scenario where batch effects are not corrected: cells of the same type from different batches may form separate clusters, leading an annotator to incorrectly label them as distinct cell types. Conversely, poor QC that fails to remove dying cells with high mitochondrial content can result in these low-quality cells forming a cluster that might be misannotated as a novel or stressed cell state [55]. Furthermore, the emergence of new annotation methods, including those leveraging large language models (LLMs) like LICT, depend on high-quality input data. These models assess annotation reliability based on the expression of marker genes in the dataset; if the data is contaminated by batch effects or ambient RNA, the credibility of any annotation—manual or automated—is compromised [1] [12].
Therefore, a rigorous preprocessing pipeline ensures that the biological signals used for annotation—whether from classic marker genes or complex expression patterns learned by AI models—are genuine, forming a solid foundation for all subsequent biological interpretation and discovery.
Annotating Rare Cell Types and Overcoming Data Imbalance (Long-Tail Distribution)
Single-cell RNA sequencing (scRNA-seq) has revolutionized biological research by enabling the characterization of cellular heterogeneity at an unprecedented resolution. At the heart of scRNA-seq data analysis lies cell type annotation, the process of assigning identity labels to individual cells based on their gene expression profiles. This process bridges the gap between computational clustering results and biological understanding, allowing researchers to interpret cellular composition and function within complex tissues [12] [22]. Accurate annotation is indispensable across various research domains, from developmental biology to immunology and oncology, as it forms the foundation for downstream analyses investigating cellular responses, disease mechanisms, and therapeutic targets [12].
Despite methodological advances, the annotation of rare cell types presents a persistent computational challenge. In scRNA-seq datasets, cell type prevalence often follows a long-tail distribution, where a few common cell types dominate the population while many biologically important rare cell types appear infrequently [12] [62]. This imbalance stems from fundamental biological realities but introduces significant analytical obstacles. Rare cell populations—such as stem cells, tissue-resident immune cells, or disease-specific subtypes—frequently hold critical functional importance despite their scarcity. Unfortunately, their low abundance means they provide limited transcriptional information for classification algorithms, making them vulnerable to being overlooked or misclassified [62]. This technical review examines the core challenges in rare cell type annotation and synthesizes computational strategies to overcome data imbalance, enabling more comprehensive cellular mapping in single-cell research.
The Core Challenge: Long-Tail Distribution in Single-Cell Data
The long-tail distribution phenomenon in scRNA-seq data manifests as a stark imbalance in cell type frequencies, where a small number of abundant cell types constitute the majority of sequenced cells, while numerous rare cell types each represent only a tiny fraction of the total population [62]. This distribution creates fundamental obstacles for computational annotation methods.
Technical and Biological Origins of Data Imbalance
Multiple factors contribute to long-tail distributions in scRNA-seq datasets:
True Biological Rarity: Certain cell types are naturally scarce in tissues, such as tissue-resident stem cells, progenitor cells, or rare immune cell subsets, yet they often play disproportionately important roles in tissue function, regeneration, and disease [12].
Technical Limitations: Sampling constraints in scRNA-seq experiments mean that rare cell types may be captured at very low rates, providing insufficient data for reliable characterization [63].
Sequencing Platform Effects: Platforms like 10x Genomics produce data with higher sparsity, which can further obscure the detection of rare cell populations that already express limited marker genes [12].
Analytical Consequences of Data Imbalance
The long-tail distribution directly impacts annotation accuracy through several mechanisms:
Algorithmic Bias: Supervised learning models trained on imbalanced data tend to prioritize accurate classification of majority cell types at the expense of rare populations, as optimizing overall accuracy typically favors performance on frequent classes [62].
Limited Signal: Rare cell types provide fewer examples for algorithms to learn distinguishing features, making it difficult to identify robust marker genes or expression patterns that differentiate them from similar but more abundant cell types [12].
Dropout Amplification: The high sparsity of scRNA-seq data particularly affects rare cell types, where technical zeros may obscure true expression patterns of key marker genes, further reducing already limited discriminatory information [63] [64].
Computational Frameworks for Addressing Data Imbalance
Specialized Loss Functions for Long-Tail Learning
Novel loss functions specifically designed for imbalanced data have shown promising results in rare cell type annotation:
Gaussian Inflation (GInf) Loss: This approach dynamically increases the feature weights of individual data instances from tail categories in a Gaussian distribution pattern, effectively enhancing the model's sensitivity to rare categories while reducing overfitting risks for common categories [62].
Hard Data Mining (HDM): This training strategy identifies misclassified samples with high confidence as "hard samples" and increases their training iterations, forcing the model to pay additional attention to challenging cases that often include rare cell types [62].
Advanced Model Architectures
Table 1: Computational Approaches for Rare Cell Type Annotation
| Method Category | Representative Examples | Core Mechanism | Advantages for Rare Cell Types |
|---|---|---|---|
| Genomic Language Models | scBERT, scGPT, Celler [62] | Pre-training on large-scale transcriptomic data followed by fine-tuning | Captures complex gene-gene relationships; transferable knowledge |
| Multi-Model Integration | LICT [1] | Combines predictions from multiple LLMs (GPT-4, Claude 3, Gemini) | Reduces individual model uncertainty; improves annotation consistency |
| Pathway-Activity Guided Clustering | UNIFAN [65] | Integrates gene set activity scores with expression patterns | Leverages prior biological knowledge; more robust to noise |
| Dropout Pattern Utilization | Co-occurrence clustering [64] | Analyzes binary dropout patterns rather than quantitative expression | Identifies patterns beyond highly variable genes |
Reference-Based and Ensemble Approaches
Large Language Model Integration: Tools like LICT (Large Language Model-based Identifier for Cell Types) leverage multiple LLMs in an integrated framework, employing a "talk-to-machine" strategy that iteratively enriches model input with contextual information to mitigate ambiguous or biased outputs, particularly valuable for rare cell populations [1].
Objective Credibility Evaluation: This strategy assesses annotation reliability by validating predicted cell types against marker gene expression patterns within the input dataset, providing reference-free validation that is particularly important for rare cell types that may be poorly represented in reference databases [1].
Experimental Protocols and Methodological Considerations
Data Preprocessing and Quality Control for Rare Cell Detection
Proper data preprocessing is essential for preserving signals from rare cell populations:
Quality Control with Rare Cells in Mind: While standard QC metrics (number of detected genes, mitochondrial percentage) should be applied, use cautious thresholds to avoid excluding valid rare cells that might have unusual metabolic or transcriptional profiles [12].
Minimal Gene Filtering: Avoid aggressive filtering based on detection rates across cells, as this may remove genes specifically expressed in rare populations. Consider retaining genes detected in as few as 0.1-0.5% of cells when rare cell types are of interest [63].
Batch Effect Correction: Apply carefully selected batch correction methods like Harmony, which has been shown to effectively integrate datasets while preserving biological variation, including rare cell populations [54].
Specialized Annotation Workflows
Table 2: Experimental Protocols for Rare Cell Type Annotation
| Protocol Step | Standard Approach | Enhanced Approach for Rare Cells | Rationale |
|---|---|---|---|
| Feature Selection | Highly variable genes | Include low-frequency genes with high cluster specificity | Captures rare population markers |
| Clustering | Standard Leiden/Louvain | Multi-resolution clustering with community detection | Identifies small, tight clusters |
| Differential Expression | Wilcoxon rank-sum test | Methods accounting for zero-inflation like GLIMES [63] | Better handles sparse rare cell data |
| Validation | Comparison to references | Objective credibility evaluation [1] | Reference-free reliability assessment |
Workflow for Rare Cell Type Annotation
Iterative Annotation Refinement Protocol
For challenging datasets with suspected rare populations, an iterative approach yields superior results:
Initial Pass with Multi-Model Framework: Apply integrated annotation tools like LICT that leverage multiple large language models to generate initial cell type predictions [1].
Credibility Assessment: For each predicted cell type, retrieve representative marker genes and evaluate their expression in the corresponding clusters. Classify annotations as reliable if >4 marker genes are expressed in ≥80% of cluster cells [1].
Iterative Feedback for Low-Confidence Annotations: For annotations failing credibility checks, generate structured feedback containing expression validation results and additional differentially expressed genes, then re-query the annotation model [1].
Rare Cell Population Validation: Employ techniques like in silico dilution analyses to confirm that putative rare cell types maintain distinct identities even when subsampled, guarding against clustering artifacts [12].
The Scientist's Toolkit: Essential Research Reagents and Computational Solutions
Table 3: Research Reagent Solutions for Rare Cell Type Analysis
| Tool/Category | Specific Examples | Function in Rare Cell Annotation | Implementation Considerations |
|---|---|---|---|
| Reference Databases | CellMarker, PanglaoDB [12] | Provide marker gene sets for cell type identification | May lack comprehensive rare cell markers |
| Batch Correction Tools | Harmony [54] | Integrates datasets while preserving biological variation | Superior performance in benchmark studies |
| Genomic Language Models | scGPT, Celler, Geneformer [62] | Capture complex gene relationships through pre-training | Require substantial computational resources |
| Multi-Model Platforms | LICT [1] | Combines multiple LLMs for improved accuracy | Implements "talk-to-machine" iterative refinement |
| Differential Expression Methods | GLIMES [63] | Handles zero-inflation in single-cell data | Uses UMI counts and zero proportions |
| Pathway Activity Tools | UNIFAN [65] | Incorporates gene set activities into clustering | Combines expression with prior biological knowledge |
Future Directions and Emerging Solutions
The field of rare cell type annotation is rapidly evolving, with several promising research directions:
Dynamic Marker Gene Databases: Integrating deep learning-based feature selection with expert biological validation enables continuous updating of marker gene databases, particularly valuable for rare and novel cell types [12].
Open-World Recognition Frameworks: Moving beyond closed-world assumptions where all test cell types are seen during training, toward open-world frameworks that can acknowledge and characterize truly novel cell types not present in reference data [12].
Multi-Modal Data Integration: Combining scRNA-seq with other data modalities such as ATAC-seq or protein expression measurements provides complementary information that can strengthen confidence in rare cell type identifications [42].
Long-Read Sequencing Technologies: Emerging single-cell long-read sequencing enables isoform-level transcriptomic profiling, offering higher resolution than conventional gene expression-based methods and providing opportunities to refine cell type definitions, particularly for rare populations [42].
Future Directions in Rare Cell Type Research
Accurate annotation of rare cell types remains a significant challenge in single-cell RNA sequencing research, but substantial progress is being made through specialized computational approaches designed to address data imbalance. The integration of genomic language models with tailored loss functions, multi-model frameworks, and innovative clustering strategies provides a powerful toolkit for identifying and characterizing rare cell populations. As these methods continue to evolve and incorporate additional biological context and data modalities, we anticipate accelerated discovery of rare cell types and their functional roles in development, homeostasis, and disease. The ongoing development of balanced benchmarking datasets and standardized evaluation metrics will be crucial for fair assessment of method performance across the entire frequency spectrum of cell types.
In single-cell RNA sequencing (scRNA-seq) research, cell type annotation is the process of assigning biological identities to clusters of cells based on their gene expression profiles. This process is fundamental for understanding cellular heterogeneity, tissue composition, and disease mechanisms [2] [12]. However, a significant challenge arises when clusters are ambiguous—lacking clear, unique markers. These ambiguities often signal the presence of mixed cell types, transient states, or entirely novel cell populations [66]. Effectively handling these cases is crucial for transforming abstract computational groupings into meaningful biological insights.
The Core Challenges of Ambiguous Clusters
Ambiguous clusters manifest primarily in two forms: mixed cell types and novel cell states. Mixed cell types occur when a single cluster contains two or more distinct cell populations that the clustering algorithm failed to separate, often due to similar expression patterns or technical limitations. Novel cell states represent previously uncharacterized cell types or physiological states (e.g., activation, stress, differentiation) for which established marker genes are not yet defined [2] [66].
The table below summarizes the primary sources of ambiguity and their impact on annotation.
Table 1: Key Challenges in Annotating Ambiguous Clusters
| Challenge | Impact on Annotation | Common Underlying Causes |
|---|---|---|
| Transitional Cell States | Cells co-express markers of multiple lineages, defying clear classification into a single type [66]. | Ongoing biological processes like differentiation, immune activation, or metabolic reprogramming. |
| Rare Cell Populations | Low-abundance cells are masked by dominant populations or lost during preprocessing, leading to incomplete annotation [66]. | Insufficient sequencing depth or overly broad clustering resolution. |
| Technical Artifacts | Batch effects or platform-specific biases create spurious clusters or merge distinct populations [12] [66]. | Variations in sample preparation, sequencing platforms (e.g., 10x Genomics vs. Smart-seq), or reagents [12]. |
| Incomplete Reference Data | Automated tools fail to classify cells that are not represented in existing reference atlases [66]. | Reference databases lacking coverage for all tissues, species, or disease states. |
The Critical Role of Clustering Reliability
Before annotation can begin, the reliability of the underlying clusters must be assessed. Clustering algorithms, such as the popular Leiden algorithm, are stochastic; their results can vary significantly with different random seeds, making it difficult to distinguish genuine biological populations from computational artifacts [67].
Tools like scICE (single-cell Inconsistency Clustering Estimator) have been developed to evaluate this clustering consistency. scICE efficiently calculates an Inconsistency Coefficient (IC) by running the clustering algorithm multiple times with different seeds and measuring the similarity of the outcomes using element-centric similarity. An IC close to 1 indicates highly consistent and reliable labels, while a higher IC signals substantial inconsistency, suggesting the cluster may be an artifact or require finer resolution [67]. Starting with a robust clustering evaluation ensures that efforts to annotate ambiguous clusters are focused on biologically meaningful groups.
Computational Strategies for Deconvolving Ambiguity
Multi-Model Integration and "Talk-to-Machine" Strategies
Emerging approaches leverage multiple computational models to overcome the limitations of any single method. The LICT (Large Language Model-based Identifier for Cell Types) tool exemplifies this with a multi-model integration strategy. Instead of relying on one model, LICT uses five top-performing LLMs (including GPT-4, Claude 3, and Gemini) and selects the best-performing annotation for a given cluster, leveraging their complementary strengths. This has been shown to significantly reduce mismatch rates compared to single-model approaches [1].
Furthermore, LICT employs a "talk-to-machine" strategy, an iterative human-computer interaction process that refines annotations for low-heterogeneity or ambiguous clusters [1]. The workflow for this strategy is detailed below.
Objective Credibility Evaluation
Discrepancies between automated or LLM-generated annotations and manual expert labels do not always indicate an error. To objectively assess which annotation is more reliable, a credibility evaluation strategy can be employed [1]. This process provides a data-driven measure of confidence for any annotation, be it from an expert or an algorithm.
This method has shown that in some datasets, a significant proportion of LLM-generated annotations that disagree with manual labels are nonetheless credible based on marker evidence, highlighting the potential for objective frameworks to complement expert knowledge [1].
Experimental Validation and Orthogonal Confirmation
Computational predictions require validation through orthogonal experimental methods. This is a critical step for confirming novel cell states or resolving mixed populations.
Table 2: Experimental Methods for Validating Ambiguous Clusters
| Method | Function in Validation | Application Context |
|---|---|---|
| Flow Cytometry / FACS | Quantifies protein-level expression of marker genes on single cells. | Confirms co-expression or mutual exclusivity of proteins predicted from scRNA-seq data. |
| Immunofluorescence / IHC | Provides spatial context and protein-level validation within tissue architecture. | Verifies the existence and location of a novel cell state within a tissue section. |
| Multiplexed FISH (e.g., MERFISH) | Spatially resolves the expression of dozens to hundreds of RNA transcripts. | Directly visualizes the transcriptome-inferred cell state in its native tissue microenvironment. |
| CRISPR Screening | Perturbs genes of interest to test their functional role in a cell state. | Establishes causal links between gene expression and the phenotype of a novel cell state [68]. |
| ATAC-seq | Profiles chromatin accessibility to identify regulatory elements. | Corroborates a novel cell state by revealing a unique regulatory landscape. |
The Scientist's Toolkit: Key Research Reagents
Table 3: Essential Reagents and Resources for scRNA-seq Annotation
| Item | Function | Example Use Case |
|---|---|---|
| Reference Atlases | Pre-annotated datasets used for label transfer and comparative analysis. | Azimuth, Human Cell Atlas, Tabula Muris [2] [66]. |
| Marker Gene Databases | Curated collections of cell-type-specific genes for manual annotation. | CellMarker, PanglaoDB [12]. |
| Cell Type Ontologies | Structured, hierarchical vocabularies for consistent cell type naming. | Cell Ontology (CL) [66]. |
| Annotation Algorithms | Software tools for automated or semi-automated cell type labeling. | SingleR, Garnett, CellTypist, LICT [1] [66]. |
| Batch Correction Tools | Computational methods to remove technical variation between datasets. | Harmony, Seurat CCA, scVI [66]. |
Integrated Workflow for Handling Ambiguous Clusters
The following workflow synthesizes computational and experimental strategies into a practical pipeline for researchers confronting ambiguous clusters.
- Ensure Clustering Robustness: Use a tool like scICE to evaluate the consistency of your clusters across multiple runs. If the IC is high, adjust clustering parameters or resolution before proceeding [67].
- Apply Multi-Model Annotation: Utilize an integrated tool like LICT or a combination of reference-based (e.g., SingleR) and marker-based (e.g., Garnett) methods to generate initial annotations. Consensus from multiple methods increases confidence [1] [66].
- Iterate with "Talk-to-Machine": For clusters with low-confidence or conflicting annotations, employ an interactive strategy. Feed validation results and additional differentially expressed genes (DEGs) back to the annotation engine for refinement [1].
- Conduct Objective Credibility Assessment: For any final annotation, run a credibility check. If the annotation is unreliable based on marker gene evidence, it is a strong candidate for being a novel state or a severely mixed population [1].
- Validate Experimentally: Subject clusters flagged as novel or ambiguous to orthogonal validation. Use FACS to sort populations based on predicted markers and perform functional assays, or use multiplexed FISH to confirm their spatial existence [66] [68].
Ambiguous clusters in scRNA-seq data are not merely obstacles but opportunities to discover novel biology. Handling them requires a shift from relying on a single method to adopting a multi-faceted strategy. This involves using robust computational frameworks to ensure clustering reliability, leveraging integrated AI models for annotation, applying objective metrics to evaluate credibility, and ultimately grounding computational predictions with orthogonal experimental evidence. By adopting this comprehensive approach, researchers can confidently move beyond known cell types to characterize novel states and resolve complex mixtures, thereby fully leveraging the power of single-cell genomics to advance drug discovery and fundamental biological understanding.
The advent of artificial intelligence (AI) has revolutionized cell type annotation in single-cell RNA sequencing (scRNA-seq) research, shifting the process from manual expert curation to semi- or fully-automated workflows. The performance of these AI models is critically dependent on the quality and quantity of their primary input: marker genes. This technical guide synthesizes current evidence to delineate how the strategic selection and optimization of marker gene panels directly influence the accuracy, reliability, and scalability of AI-driven annotation tools. We provide a comprehensive analysis of quantitative findings, detailed experimental protocols, and practical frameworks for researchers to optimize input parameters, thereby enhancing the biological interpretation of single-cell data.
Cell type annotation is a fundamental step in scRNA-seq analysis, enabling researchers to decipher cellular heterogeneity and function within complex biological systems. Traditionally, this process relied on manual comparison of highly expressed genes in each cell cluster with known canonical marker genes, a labor-intensive and expertise-dependent task. The emergence of AI, particularly large language models (LLMs) and specialized machine learning algorithms, has transformed this landscape by offering scalable, automated solutions [13] [12]. These models leverage vast biological knowledge embedded in their training corpora to infer cell identities from gene expression inputs. However, their performance is not autonomous; it is profoundly shaped by the nature of the marker genes provided. The number of genes, their specificity, expression patterns, and the methodologies used for their selection constitute critical variables that directly impact annotation outcomes, influencing everything from broad cell class identification to the discrimination of closely related subtypes.
Quantitative Impact of Marker Gene Number on AI Performance
The number of marker genes used as input is a primary determinant of AI model performance. Evidence suggests an optimal range exists, balancing informational sufficiency against signal dilution.
Key Findings from Benchmarking Studies
A systematic evaluation of GPT-4's performance for cell type annotation revealed that the number of input differential genes significantly affects accuracy. The model's performance was benchmarked across various tissues and cell types using different numbers of top differential genes [13].
Table 1: Impact of Marker Gene Number on GPT-4 Annotation Accuracy
| Number of Input Genes | Performance Outcome | Context / Notes |
|---|---|---|
| Top 10 differential genes | Optimal performance | Achieved the best balance of accuracy and efficiency [13]. |
| Top 20 differential genes | Maintained high agreement | Performance remained robust but did not show significant improvement over top 10 [13]. |
| Top 30 differential genes | Similar high agreement | No major performance drop, but increased input cost without substantial benefit [13]. |
| Fewer than 10 genes | Performance decrease | Limited information leads to reduced annotation accuracy and robustness [13]. |
This quantitative data indicates a plateau effect, where increasing the number of input genes beyond a certain point (approximately 10 in this case) yields diminishing returns. The optimal number is likely influenced by the model's architecture and its capacity to effectively process and weight informational inputs.
Criteria for Effective Marker Gene Selection
Beyond quantity, the qualitative characteristics of the selected marker genes are paramount. The following criteria are essential for maximizing AI performance.
Binary Expression Pattern
An ideal marker gene should exhibit a "binary expression pattern"—expressed at high levels in the majority of cells of the target cell type and with little to no expression in other cell types [69]. The Binary Expression Score is a metric used to quantify this pattern. Tools like NS-Forest v2.0 and later versions incorporate this score to preferentially select genes that are "on" in the target population and "off" in others, which is crucial for distinguishing closely related cell types [69].
High On-Target Fraction
The On-Target Fraction is a related metric that ranges from 0 to 1. A value of 1 is assigned to markers that are exclusively expressed within their target cell types and not in any other cell types [69]. This metric is critical for applications like spatial transcriptomics panel design, where marker specificity directly impacts classification fidelity.
Combinatorial Sufficiency
A single gene is rarely sufficient to define a cell type. Therefore, the goal is to identify a minimal combination of genes that are jointly necessary and sufficient for classification. Machine learning methods like NS-Forest use metrics such as the F-beta score (with beta set to 0.5 to weight precision higher than recall) to identify the smallest set of markers that delivers maximum classification accuracy [69]. This approach controls for false negatives introduced by technical artifacts like dropout in scRNA-seq data.
Methodologies for Marker Gene Selection
Different computational strategies for selecting marker genes yield inputs with varying properties, directly influencing downstream AI annotation performance.
Label-Based vs. Label-Free Selection
Table 2: Comparison of Marker Gene Selection Methodologies
| Methodology | Principle | Advantages | Limitations | Representative Tool |
|---|---|---|---|---|
| Label-Based Selection | Depends on predefined cell type labels or clustering results. | - Leverages existing biological knowledge.- Well-established and widely used. | - Inherently biased by the quality of pre-defined labels.- Cannot discover novel cell types. | Standard Differential Expression (DE) Analysis [70] |
| Label-Free Selection | Identifies markers based on intrinsic data structure without pre-defined labels. | - Unbiased discovery of novel cell states.- Scalable to large datasets. | - May struggle with rare cell types.- Can be computationally intensive. | geneCover [70] |
| Machine Learning (BinaryFirst) | Pre-selects genes with high Binary Expression Score before random forest classification. | - Improves discrimination of closely related types.- Reduces runtime.- Enhances marker specificity. | - Requires calculation of dataset-specific score thresholds. | NS-Forest v4.0 [69] |
Experimental Protocol: NS-Forest v4.0 with BinaryFirst
The NS-Forest algorithm provides a robust, data-driven protocol for identifying optimal cell type classification marker genes [69].
Workflow Overview
Detailed Protocol Steps:
- Input Data Preparation: Provide NS-Forest v4.0 with an annotated data object (e.g.,
.h5adfile format) containing the scRNA-seq gene expression matrix and cell type labels [69]. - BinaryFirst Pre-selection: The BinaryFirst module calculates a Binary Expression Score for all genes. This score quantifies how well a gene exhibits the desired "on-target/off-elsewhere" pattern. Genes are then pre-filtered based on a dataset-specific threshold (
BinaryFirst_mild,BinaryFirst_moderate, orBinaryFirst_high) derived from the distribution of all genes' scores. This step enriches for candidate genes with strong binary patterns before the main classification step [69]. - Random Forest Feature Ranking: A random forest classifier is trained on the pre-filtered gene set. Genes are ranked for each cell type by their importance, typically measured by the Gini index, which reflects their contribution to accurate classification [69].
- Decision Tree & Expression Thresholding: For each top-ranked marker candidate, a one-versus-all decision tree is built to derive the optimal expression level threshold for classifying the target cell type against all others [69].
- Optimal Combination Selection: The F-beta score (with beta=0.5) is calculated for all possible combinations of the top-ranked genes. The combination that yields the maximum F-beta score is selected as the minimal, optimal marker panel for that cell type [69].
Advanced AI Strategies and Input Optimization
To overcome inherent limitations of individual models and inputs, advanced AI strategies have been developed that dynamically interact with and refine marker gene information.
Multi-Model Integration and "Talk-to-Machine" Strategy
The LICT (Large Language Model-based Identifier for Cell Types) framework employs a multi-model integration strategy, leveraging complementary strengths of multiple LLMs (e.g., GPT-4, Claude 3, Gemini) to reduce uncertainty and improve annotation reliability, especially for low-heterogeneity datasets where single models struggle [1]. Furthermore, its "talk-to-machine" strategy creates an iterative feedback loop for input optimization [1].
Iterative Workflow Diagram
Protocol for "Talk-to-Machine" Strategy (LICT):
- Initial Query: Provide an initial set of marker genes to the LLM to obtain a preliminary cell type annotation [1].
- Marker Retrieval and Validation: Query the same LLM to generate a list of representative marker genes for its predicted cell type. Evaluate the expression of these retrieved markers in the corresponding clusters of the input dataset [1].
- Decision Point: An annotation is considered valid if more than four marker genes are expressed in at least 80% of cells within the cluster. This objective credibility evaluation provides a quantitative measure of annotation reliability [1].
- Iterative Refinement: If validation fails, a structured feedback prompt is generated containing the expression validation results and additional differentially expressed genes (DEGs) from the dataset. This enriched input is used to re-query the LLM, prompting it to revise or confirm its annotation [1]. This process iterates until a stable, validated annotation is achieved.
The Scientist's Toolkit: Research Reagent Solutions
The following table compiles essential computational tools and databases that are critical for optimizing marker gene selection and AI-powered cell type annotation.
Table 3: Key Research Reagents and Computational Tools
| Tool / Resource Name | Type | Primary Function |
|---|---|---|
| NS-Forest v4.0 | Machine Learning Algorithm | Identifies minimal, optimal marker gene combinations for cell type classification using a BinaryFirst strategy [69]. |
| geneCover | Label-Free Selection Algorithm | Selects minimally redundant marker panels based on gene-gene correlations, scalable to large datasets [70]. |
| LICT | Multi-LLM Integration Framework | Provides reliable cell type annotation by leveraging multiple LLMs and an iterative "talk-to-machine" strategy [1]. |
| GPTCelltype | LLM Interface (R package) | Interfaces with GPT-4 for automated cell type annotation using marker gene lists [13]. |
| ScInfeR | Hybrid Annotation Tool | Integrates both reference scRNA-seq data and marker sets for annotation across scRNA-seq, scATAC-seq, and spatial omics [71]. |
| ScExtract | Automated Workflow Framework | Leverages LLMs to fully automate scRNA-seq data processing, from article text extraction to annotation and integration [72]. |
| CellMarker 2.0 & PanglaoDB | Marker Gene Databases | Curated repositories of known cell type-specific marker genes for manual curation and validation [12]. |
The performance of AI in cell type annotation is inextricably linked to the number and choice of input marker genes. Evidence-based optimization involves providing a sufficient number of genes (e.g., ~10 top differentials) and prioritizing those with high specificity, binary expression patterns, and combinatorial power. Methodologies like NS-Forest's BinaryFirst and LICT's iterative validation offer robust experimental protocols for generating and refining these optimal inputs. As AI continues to permeate single-cell genomics, a deliberate and critical approach to input engineering will be fundamental to achieving accurate, reliable, and biologically insightful annotations.
Cell type annotation is a fundamental process in single-cell RNA sequencing (scRNA-seq) research, involving the classification of individual cells into distinct biological types based on their gene expression profiles. In the era of spatial biology, this traditional process evolves to incorporate the crucial dimension of physical location within a tissue. For 10x Xenium and other spatial transcriptomics platforms, annotation transforms clusters of gene expression data into meaningful biological insights while preserving their spatial context. This technical guide examines the specific considerations, methods, and best practices for cell type annotation in high-resolution spatial data, particularly focusing on the 10x Xenium platform.
Unique Challenges of Xenium Data in Cell Type Annotation
Xenium In Situ technology presents distinct considerations for cell type annotation compared to whole-transcriptome single-cell approaches. Understanding these technical specificities is essential for designing appropriate analysis strategies.
- Targeted Gene Panels: Xenium utilizes predefined gene panels comprising a targeted subset of the transcriptome, unlike whole-transcriptome scRNA-seq. While these panels are carefully designed to maximize cell typing capabilities, the limited gene set requires careful selection of marker genes and reference datasets [73].
- Sensitivity Profile: The number of transcripts and genes detected per cell in Xenium datasets is typically lower than expected UMI counts from whole-transcriptome single-cell gene expression chemistries. This difference in sensitivity means annotation algorithms developed for scRNA-seq may require optimization for Xenium data [73].
- Cellular Resolution with Spatial Context: As an imaging-based platform, Xenium provides single-cell resolution while precisely maintaining spatial coordinates. This allows annotation to incorporate neighborhood relationships and morphological context absent in dissociated scRNA-seq [32] [74].
Annotation Methodologies: A Comparative Analysis
Multiple computational approaches exist for annotating cell types in Xenium data, each with distinct advantages and implementation considerations. The table below summarizes the key methodologies validated for Xenium platform.
Table 1: Cell Type Annotation Methods for Xenium Spatial Data
| Method | Underlying Approach | Requirements | Key Advantages | Implementation |
|---|---|---|---|---|
| SingleR | Correlation-based | Reference dataset | Fast, accurate, easy to use; highest benchmarking performance [32] | R/Bioconductor |
| Azimuth | Reference mapping | Pre-processed reference | Integration with Seurat; web application available [36] [32] | R/Web |
| RCTD | Statistical deconvolution | Single-cell reference | Designed specifically for spatial transcriptomics [32] | R (spacexr) |
| scPred | Machine learning | Training dataset | Probabilistic classification; can handle custom references [32] | R |
| scmapCell | Similarity mapping | Reference dataset | Fast projection to reference [32] | R |
| Manual Annotation | Marker gene expression | Canonical markers | Biological interpretability; no reference needed [2] [32] | Visual inspection |
Recent benchmarking studies evaluating these methods on Xenium human breast cancer data revealed that SingleR demonstrated superior performance, being both fast and accurate, with results closely matching manual annotation [32]. The study employed practical workflows for preparing high-quality single-cell references and evaluating accuracy metrics.
Experimental Protocol for Xenium Cell Type Annotation
Reference Dataset Selection and Preparation
Choosing an appropriate reference dataset is critical for accurate annotation. Consider these key factors:
- Biological Relevance: Select references with matched tissue type, disease state, and biological conditions [73].
- Technical Compatibility: References should ideally come from similar technological platforms (e.g., scRNA-seq vs. snRNA-seq) and processing methods (FF vs. FFPE) [73].
- Annotation Quality: Prioritize references with well-documented, validated cell type labels [73] [2].
Recommended reference sources include the Human Cell Atlas, HuBMAP, Azimuth references, and CellTypist models [73] [36]. For optimal results, using a paired single-cell dataset from the same tissue block can significantly improve transfer performance by reducing biological heterogeneity [73].
Data Preprocessing Workflow
Proper preprocessing ensures high-quality input for annotation algorithms:
- Quality Control: Filter cells based on UMI counts, gene detection, and mitochondrial percentage. For Xenium data, remove cells with fewer than 200 or more than 10,000 UMIs, and cells with >10% mitochondrial content [73].
- Normalization: Account for technical variance using methods like SCTransform, which effectively handles spatial data with varying molecular counts across spots/cells [75].
- Feature Selection: For Xenium's targeted panels, use all genes or select highly variable genes depending on the annotation method [32].
Implementation of Annotation Methods
The workflow diagram below illustrates the logical relationship between annotation steps:
For SingleR implementation, use the following code structure:
Similar pipelines can be implemented for Azimuth, which integrates directly with the Seurat ecosystem, and RCTD, which requires specific parameter adjustments for Xenium data [32].
Validation and Quality Assessment
Rigorous validation ensures biological relevance of annotations:
- Spatial Coherence: Verify that annotated cell types form biologically plausible spatial patterns (e.g., epithelial cells in organized layers) [75].
- Marker Gene Expression: Confirm that canonical marker genes show expected expression in annotated cell types, overlaying gene expression on spatial coordinates [2] [76].
- Cross-Method Consistency: Compare results across multiple annotation methods to identify robust assignments [32].
Table 2: Performance Metrics of Annotation Methods on Xenium Data
| Method | Agreement with Manual Annotation | Running Time | Ease of Use | Reference Dependency |
|---|---|---|---|---|
| SingleR | Strongest agreement [32] | Fast | Easy | High |
| Azimuth | Strong agreement [32] | Moderate | Easy | High |
| RCTD | Moderate agreement [32] | Slower | Moderate | High |
| scPred | Variable agreement [32] | Moderate | Moderate | High |
| scmapCell | Variable agreement [32] | Fast | Easy | High |
| Manual | Gold standard | Slow | Difficult | None |
Advanced Approaches and Emerging Technologies
Multi-Modal Integration and Validation
Advanced annotation workflows integrate complementary data types:
- Morphological Integration: Combine transcriptomic signatures with cellular morphology from high-resolution microscopy [76].
- Spatial Context Incorporation: Utilize neighborhood relationships to refine annotations using tools like Baysor or ClusterMap [36].
- Multi-Scale Validation: Cross-validate findings with complementary spatial technologies like Visium HD or MERSCOPE [74].
Emerging Artificial Intelligence Approaches
Recent advances demonstrate the potential of large language models in cell type annotation:
- GPT-4 Application: Studies show GPT-4 can accurately annotate cell types using marker gene information, with strong concordance to manual annotations [13].
- Automation Potential: When evaluated across hundreds of tissue and cell types, GPT-4 generated annotations exhibiting 70-75% full match rate with manual annotations for most tissues [13].
- Implementation Considerations: While promising, AI-based approaches require validation by domain experts to mitigate risks of artificial intelligence hallucination [13].
The following diagram illustrates the method selection logic for different research scenarios:
Table 3: Key Research Reagent Solutions for Xenium Cell Type Annotation
| Resource | Type | Function | Implementation |
|---|---|---|---|
| 10x Xenium Gene Panels | Pre-designed reagent panels | Targeted transcriptome profiling | Custom or predefined panels |
| Cell Segmentation Kits | Reagent kit | Cellular boundary definition | Multimodal segmentation |
| BPCells | Computational package | Memory-efficient data handling | Disk-stored count matrices [73] |
| Seurat | R toolkit | Spatial data analysis and visualization | Primary analysis environment [73] [75] |
| SingleR | R/Bioconductor package | Reference-based annotation | Primary annotation method [32] |
| Azimuth | Web/R application | Reference mapping and projection | Alternative annotation approach [36] [32] |
| Spacexr (RCTD) | R package | Spatial cell type decomposition | Spot-based decomposition [32] |
| Scanpy/Squidpy | Python packages | Spatial data analysis | Python-based workflow alternative [36] |
| SpatialData | Python framework | Multi-platform spatial data unification | Integrated analysis across technologies [76] |
Cell type annotation for 10x Xenium data requires specialized approaches that address the platform's unique characteristics while leveraging established scRNA-seq principles. Based on current benchmarking evidence, SingleR emerges as the optimal starting point for reference-based annotation, balancing accuracy, speed, and usability. Successful annotation strategies incorporate rigorous quality control, appropriate reference selection, and multi-modal validation to ensure biologically meaningful results. As spatial technologies continue evolving, annotation methodologies will increasingly integrate artificial intelligence, multi-modal data fusion, and sophisticated spatial context analysis to further enhance our understanding of cellular organization and function in tissue environments.
Ensuring Accuracy: How to Validate and Benchmark Annotation Results
Cell type annotation is a fundamental and indispensable step in the analysis of single-cell RNA sequencing (scRNA-seq) data. This process involves classifying individual cells into specific types based on their gene expression profiles, enabling researchers to decipher cellular heterogeneity, understand tissue composition, and identify novel cell states in both health and disease. As the field has matured, the reliance on manual annotation by domain experts, long considered the gold standard, has been increasingly supplemented or replaced by automated computational methods. This shift necessitates robust, standardized metrics to evaluate the performance and reliability of these new methods by measuring their agreement with manual annotations. Establishing such metrics is crucial for ensuring biological accuracy and reproducibility in single-cell research and its applications in drug development.
Core Metrics for Measuring Annotation Agreement
The agreement between automated cell type annotations and manual benchmarks can be quantified using several statistical measures. These metrics generally fall into two categories: simple measures of raw agreement and chance-corrected measures that account for agreement occurring randomly.
| Metric Category | Metric Name | Formula/Principle | Key Characteristics | Best Use Cases |
|---|---|---|---|---|
| Simple Agreement | Percent (Simple) Agreement | ( p_a = \frac{\text{Number of agreeing instances}}{\text{Total instances}} ) | Simple to compute; can be unfairly high with imbalanced classes [77]. | Initial sanity check; equally distributed phenomena [77]. |
| Chance-Corrected Agreement | Krippendorff's Alpha | ( \alpha = 1 - \frac{Do}{De} ) | Handles multiple annotators & missing data; generalizes Fleiss' Kappa with identity weighting for nominal data [77]. | Robust IAA with partially overlapping annotations or >2 annotators [77]. |
| Chance-Corrected Agreement | Gwet's AC2 | ( AC2 = \frac{pa - pe}{1 - p_e} ) | Addresses Kappa's tendency to underestimate agreement with imbalanced categories; robust against sparse phenomena [77]. | Datasets with high class imbalance or low-prevalence cell types [77]. |
| Numeric Scoring | Custom Agreement Score | Categorical (e.g., "full match", "partial match", "mismatch") based on semantic similarity [13] [1]. | Captures granularity differences (e.g., general "stromal cell" vs. specific "fibroblast") [13]. | Evaluating semantic accuracy and hierarchical correctness beyond strict label identity. |
The interpretation of these metrics, particularly chance-corrected ones, requires context. While an alpha value of 0.8 is often considered a benchmark for reliable agreement, the target can vary based on the complexity of the cell types and the annotation granularity [77]. It is critical that metrics are not treated as absolute targets but as signals within a broader context, including visual inspection of projections and marker gene expression [77] [1].
Detailed Experimental Protocols for Benchmarking
To ensure a fair and informative comparison between automated and manual annotations, a rigorous experimental protocol must be followed. The steps below outline a standard benchmarking workflow, drawing from recent methodology.
Dataset Collection and Curation
Input Preparation for Automated Methods
For marker-based methods, the top differentially expressed genes (DEGs) for each cell cluster are used as input. Studies have shown that using the top ten genes identified through a two-sided Wilcoxon rank-sum test often yields optimal performance for LLM-based annotation [13]. These genes are typically ranked by P-value and further by test statistics or log fold-change.
Automated Annotation Execution
The automated method (e.g., a new tool or LLM) is used to generate cell type labels for each cluster or cell based on the prepared inputs. Prompting strategies for LLMs can vary from basic to more complex chain-of-thought prompts, though studies indicate similar accuracy across different strategies [13].
Agreement Calculation and Evaluation
Generated annotations are compared against the manual ground truth. This can involve:
- Categorical Scoring: Assigning "full match," "partial match," or "mismatch" based on semantic similarity. For instance, a "partial match" may be assigned when an automated tool provides a more granular label (e.g., "fibroblast") than the manual annotation ("stromal cell") [13].
- Metric Computation: Calculating the core metrics (e.g., Krippendorff's Alpha, Simple Agreement) based on the label assignments.
Robustness and Reproducibility Analysis
A comprehensive benchmark should also assess the method's reliability through simulations and repeated runs.
- Robustness: Test performance with noisy input data, fewer marker genes, or in scenarios with "unseen" cell types not present in the training corpus. GPT-4, for example, has been shown to distinguish between pure and mixed cell types with 93% accuracy and identify unknown cell types with 99% accuracy in simulated data [13].
- Reproducibility: Measure the consistency of annotations for the same input across multiple runs. High reproducibility is indicated by identical annotations in a high percentage of cases (e.g., 85% for GPT-4) [13].
A Toolkit for Annotation and Validation
The following table lists key software tools and resources that implement annotation methods and validation metrics, forming an essential toolkit for researchers.
| Tool Name | Type | Primary Function | Key Features |
|---|---|---|---|
| GPTCelltype [13] | R Package | Automated cell type annotation using LLMs (GPT-4). | Uses marker gene lists; cost-efficient; integrates with Seurat; high concordance with manual labels. |
| LICT [1] | Software Package | LLM-based cell type identification with reliability assessment. | Multi-model integration; "talk-to-machine" iterative feedback; objective credibility evaluation. |
| ACT [11] | Web Server | Knowledge-based cell type annotation. | Hierarchical marker map from 26,000+ entries; Weighted and Integrated gene Set Enrichment (WISE) method. |
| Cell Marker Accordion [78] | R Package / Web Platform | Automatic annotation & biological interpretation. | Database weighted by evidence consistency & specificity; identifies disease-critical cells. |
| Prodigy [77] | Software Library | Calculation of Inter-Annotator Agreement (IAA) metrics. | Implements Krippendorff's Alpha, Gwet's AC2, and percent agreement for annotation tasks. |
| VICTOR [79] | R Package | Validation and inspection of cell type annotation. | Uses elastic-net regularized regression to assess annotation quality. |
| Cell Ranger Annotate [80] | Cloud Pipeline | Automated annotation within 10x Genomics ecosystem. | Uses a reference database (CZ CELLxGENE) and nearest-neighbor lookup for annotation. |
Advanced Considerations and Future Directions
As annotation methods evolve, so must the metrics for their evaluation. A critical consideration is that low agreement does not always imply the automated method is wrong. Discrepancies can arise when the automated method provides a more precise or granular annotation that is still biologically accurate, a scenario where rigid metrics may be misleading [13]. Furthermore, an objective credibility evaluation—assessing whether the purported marker genes for an annotated cell type are actually expressed in the cluster—can sometimes show that LLM-generated annotations are more reliable than the original manual ones, highlighting the subjectivity of human experts [1].
Future developments will likely focus on metrics that better handle hierarchical ontologies, multi-modal data integration, and the quantification of uncertainty in predictions. The move towards automated annotation is not about replacing expert biologists but about augmenting their capabilities with tools that provide objective, reproducible, and scalable starting points, ultimately accelerating discovery in biology and medicine.
Cell type annotation is a fundamental and indispensable step in the analysis of single-cell RNA sequencing (scRNA-seq) data, serving as the critical link between raw gene expression data and biological interpretation. This process involves assigning specific cell type identities to individual cells or clusters of cells based on their transcriptomic profiles, thereby enabling researchers to understand cellular composition, heterogeneity, and function within complex tissues [1] [12]. The accuracy of cell type annotation directly influences downstream analyses, including the identification of rare cell populations, investigation of disease mechanisms, and discovery of novel therapeutic targets [1] [81].
Traditionally, cell type annotation has been performed through a manual process where experts assign identities to cell clusters by consulting literature and known marker genes. While this approach benefits from deep biological knowledge, it is inherently subjective, time-consuming, and heavily dependent on the annotator's experience, often leading to inconsistent results across studies [1] [82]. The rapid accumulation of scRNA-seq data has catalyzed the development of computational annotation methods, which can be broadly categorized into two paradigms: reference-based methods and AI-powered tools. Reference-based methods rely on comparing query data to pre-existing, annotated reference datasets, while emerging AI-powered approaches leverage large-scale pretraining and large language models (LLMs) to interpret cellular identities [81] [12]. This technical guide provides a comprehensive benchmarking analysis of these methodologies, offering detailed protocols and performance evaluations to guide researchers in selecting appropriate tools for their specific research contexts.
Methodological Foundations of Annotation Tools
Reference-Based Annotation Methods
Reference-based methods operate on the principle of transferring cell type labels from a well-annotated reference dataset to a query dataset by measuring similarity in gene expression patterns. These methods require a high-quality reference dataset, ideally generated using similar experimental protocols to the query data to minimize batch effects [32] [81]. The fundamental workflow involves preparing both reference and query datasets, selecting features (genes) for comparison, calculating similarity metrics, and finally transferring labels based on the highest similarity scores.
Similarity-Based Algorithms: Tools like SingleR and scMatch employ correlation metrics (Pearson or Spearman) to compare gene expression profiles between single cells in the query dataset and reference profiles. SingleR, particularly noted for its performance in spatial transcriptomics analysis, uses a novel hierarchical clustering method based on similarity to reference transcriptomic datasets of purified cell types [32] [82].
Supervised Classification Methods: Approaches such as scPred and CellTypist utilize machine learning classifiers trained on reference data. CellTypist implements a logistic regression classifier optimized by stochastic gradient descent for automated cell type annotation, providing pre-trained models for multiple human and mouse organs [81].
Spatial Deconvolution Algorithms: Methods like RCTD (Robust Cell Type Decomposition) are specifically designed for spatial transcriptomics data, enabling cell type annotation while accounting for spatial context and potential mixtures of cell types within spots or bins [32].
AI-Powered Annotation Tools
AI-powered annotation represents a paradigm shift from reference-dependent approaches, leveraging large-scale pretraining on diverse datasets and advanced natural language processing capabilities. These methods can be further divided into foundation models trained on biological data and large language models (LLMs) adapted for biological interpretation.
Foundation Models: Tools like scGPT and Geneformer undergo pretraining on massive collections of single-cell data, learning generalizable representations of gene-cell relationships. These models can perform zero-shot annotation without task-specific training, though their performance often improves with fine-tuning on reference data [81] [12].
Large Language Model (LLM) Integration: Emerging approaches like LICT (Large Language Model-based Identifier for Cell Types) and AnnDictionary leverage commercial LLMs (GPT-4, Claude 3, Gemini) to interpret marker gene lists and assign cell types. LICT employs a sophisticated multi-model integration strategy, combining predictions from multiple LLMs to enhance accuracy, along with a "talk-to-machine" approach that iteratively refines annotations based on marker gene validation [1] [47].
Specialized Architectures: Methods like SCTrans incorporate transformer architectures with self-attention mechanisms to capture complex gene-gene interactions and identify biologically relevant features for annotation, potentially discovering novel marker genes without explicit database dependency [12].
Experimental Protocols for Benchmarking Studies
Dataset Selection and Preparation
Comprehensive benchmarking requires diverse datasets representing various biological contexts, technological platforms, and levels of cellular heterogeneity. Standardized preprocessing pipelines ensure fair comparison between methods.
Protocol 1: Reference-Based Method Benchmarking [32]
- Data Collection: Obtain a paired single-nucleus RNA sequencing (snRNA-seq) dataset and imaging-based spatial transcriptomics data (e.g., 10x Xenium) from the same biological sample.
- Reference Preparation:
- Process the snRNA-seq data using the Seurat standard pipeline: Normalize data (
NormalizeData), identify highly variable genes (FindVariableFeatures), scale data (ScaleData), perform dimensionality reduction (RunPCA,RunUMAP), and cluster cells (FindNeighbors,FindClusters). - Remove potential doublets using tools like
scDblFinder. - Perform rigorous cell type annotation through a combination of marker gene expression, CNV analysis (e.g.,
inferCNVfor identifying tumor cells), and manual verification to create high-quality reference labels.
- Process the snRNA-seq data using the Seurat standard pipeline: Normalize data (
- Query Data Processing:
- Apply similar preprocessing to the spatial transcriptomics data, excluding feature selection steps when working with limited gene panels.
- Remove low-quality cells and normalize expression values.
- Method-Specific Reference Formatting:
- For SingleR: Prepare a
SingleCellExperimentobject. - For Azimuth: Convert reference to Azimuth format using
AzimuthReferenceafter SCTransform normalization and UMAP withreturn.model=TRUE. - For RCTD: Create a
Referenceobject using thespacexrpackage. - For scPred: Train a classification model using
trainModelon the referenceSeuratobject. - For scmap: Build a cell index with
indexCell.
- For SingleR: Prepare a
- Annotation Transfer: Execute each method's prediction function with default parameters unless otherwise specified, adjusting specific parameters as needed (e.g., in RCTD, parameters like
UMI_min,counts_MIN, andgene_cutoffmay be set to 0 to retain all cells).
Protocol 2: AI-Powered Tool Benchmarking [1] [47]
- Benchmark Dataset Curation: Select diverse scRNA-seq datasets representing different biological contexts:
- High-heterogeneity data: Peripheral Blood Mononuclear Cells (PBMCs), gastric cancer samples.
- Low-heterogeneity data: Human embryos, stromal cells from mouse organs.
- Data Preprocessing:
- Process each dataset independently: normalize, log-transform, identify high-variance genes, scale, perform PCA, calculate neighborhood graphs, cluster using Leiden algorithm, and compute differentially expressed genes (DEGs) for each cluster.
- For each cluster, extract top DEGs based on statistical significance and fold-change.
- LLM Annotation Setup:
- For multi-model tools like LICT: Standardized prompts incorporating the top marker genes for each cell subset are submitted to multiple LLMs (GPT-4, LLaMA-3, Claude 3, Gemini, ERNIE).
- Implement "talk-to-machine" validation: Query LLMs for representative marker genes of predicted cell types, validate expression in the dataset, and provide iterative feedback for annotation refinement.
- Credibility Assessment:
- Define objective reliability metrics: An annotation is deemed reliable if >4 marker genes are expressed in ≥80% of cells within the cluster.
- Compare AI-generated annotations with manual expert annotations using string matching, Cohen's kappa, and LLM-assisted quality ratings (perfect, partial, or not-matching).
Performance Evaluation Metrics
- Accuracy Assessment: Measure agreement with manual annotations using exact string matching, Cohen's kappa for inter-annotator agreement, and hierarchical matching based on cell ontology relationships.
- Robustness Evaluation: Assess performance consistency across datasets with varying cellular heterogeneity, sequencing technologies, and species.
- Computational Efficiency: Benchmark memory usage, runtime, and scalability with increasing cell numbers.
- Usability Assessment: Document installation complexity, dependency management, requirement for computational resources (e.g., GPUs), and user interface design.
Comparative Performance Benchmarking
Quantitative Performance Analysis
Table 1: Performance Benchmarking of Reference-Based Methods on 10x Xenium Data [32]
| Method | Underlying Algorithm | Agreement with Manual Annotation | Ease of Use | Computational Efficiency |
|---|---|---|---|---|
| SingleR | Correlation-based | High (Best performing) | Easy, fast | Fast |
| Azimuth | Reference mapping | Moderate | Moderate | Moderate |
| RCTD | Spatial deconvolution | Moderate | Complex (parameter tuning) | Moderate |
| scPred | Supervised classification | Moderate | Moderate | Moderate |
| scmap | k-NN mapping | Lower | Easy | Fast |
Table 2: Performance of AI-Powered Tools Across Dataset Types [1] [47]
| Tool | Approach | High-Heterogeneity Data (e.g., PBMCs) | Low-Heterogeneity Data (e.g., Embryos) | Reference Dependency |
|---|---|---|---|---|
| LICT | Multi-LLM integration | 90.3% match rate (9.7% mismatch) | 48.5% match rate (improved from 3.0%) | Reference-free |
| GPT-4 | Single LLM | 78.5% match rate (21.5% mismatch) | 3.0% match rate (initial) | Reference-free |
| Claude 3 | Single LLM | Highest overall performance in heterogeneous data | 33.3% consistency for fibroblast data | Reference-free |
| Gemini | Single LLM | Competitive in heterogeneous data | 39.4% consistency for embryo data | Reference-free |
| AnnDictionary | LLM-aggregation | >80-90% accuracy for major cell types | Varies by model size | Optional |
Table 3: Overall Method Comparison by Category [81]
| Feature | Manual Annotation | Reference-Based Methods | AI-Powered Tools |
|---|---|---|---|
| Accuracy | High (if meticulous) | High with matched reference | Variable (80-90% for common types) |
| Speed | Slow (hours to days) | Fast (minutes to hours) | Fast (minutes to hours) |
| Expertise Required | High (domain knowledge) | Moderate (bioinformatics) | Moderate to high (coding, AI literacy) |
| Reference Dependency | Literature and databases | Required (quality critical) | Optional (zero-shot possible) |
| Handling Novel Types | Possible with validation | Difficult | Moderate (varies by model) |
| Consistency | Low (inter-annotator variability) | High | High |
| Setup Complexity | Low | Moderate | High (dependencies, GPU possible) |
Context-Dependent Performance Analysis
The benchmarking data reveals that method performance is highly context-dependent. Reference-based methods excel when high-quality, protocol-matched reference data is available, with SingleR demonstrating particularly strong performance for spatial transcriptomics data [32]. However, these methods struggle with cell types absent from the reference and are susceptible to batch effects between reference and query datasets.
AI-powered tools show remarkable capability in annotating common cell types without reference data, with multi-model approaches like LICT significantly outperforming single LLM implementations [1]. However, performance disparities emerge in challenging scenarios: while these tools achieve >90% accuracy for high-heterogeneity datasets like PBMCs, their performance drops significantly for low-heterogeneity environments like stromal cells or developmental stages, where match rates can fall below 50% [1]. This suggests that cellular diversity in the training data significantly influences model capability.
A notable finding from credibility assessments is that LLM-generated annotations sometimes demonstrate higher biological plausibility than manual annotations. In stromal cell datasets, 29.6% of LLM annotations were deemed credible based on marker gene expression, compared to 0% of manual annotations, highlighting potential biases in human expert judgment [1].
Implementation Workflows
Reference-Based Annotation Workflow
(Reference-Based Cell Type Annotation Workflow)
AI-Powered Annotation Workflow
(AI-Powered Cell Type Annotation Workflow)
Table 4: Key Research Reagent Solutions for Cell Type Annotation
| Resource | Type | Function in Annotation | Examples |
|---|---|---|---|
| Reference Datasets | Data | Provide labeled examples for reference-based methods | Human Cell Atlas, Tabula Sapiens, Tabula Muris, FANTOM5 |
| Marker Gene Databases | Knowledgebase | Canonical markers for manual and automated annotation | CellMarker, PanglaoDB, CancerSEA |
| Pre-trained Models | AI Resource | Enable zero-shot or fine-tuned annotation without training from scratch | CellTypist models, scGPT, Geneformer |
| LLM Access | Tool | Provide biological reasoning for marker gene interpretation | GPT-4, Claude 3, Gemini via API |
| Quality Control Tools | Software | Assess data quality before annotation | Scater, Seurat QC metrics, scDblFinder |
| Annotation Packages | Software | Implement specific annotation algorithms | SingleR, Azimuth, SCsimilarity, AnnDictionary |
| Cell Ontologies | Standardization | Provide consistent vocabulary for cell types | Cell Ontology, Cellosaurus |
Discussion and Future Directions
The comparative benchmarking reveals a nuanced landscape where both reference-based and AI-powered approaches offer complementary strengths. Reference-based methods provide reliable, interpretable results when high-quality reference data is available, with SingleR emerging as a particularly robust option for spatial transcriptomics data [32]. Conversely, AI-powered tools offer unprecedented flexibility for zero-shot annotation and can outperform manual annotations in challenging scenarios, though they require substantial computational resources and technical expertise [1] [81].
Future methodological developments will likely focus on hybrid approaches that combine the reliability of reference-based mapping with the adaptability of AI interpretation. The integration of continuously updated marker gene databases with LLM-based reasoning engines presents a promising direction for addressing the challenge of annotating novel cell types [12]. Additionally, specialized methods for low-heterogeneity environments and standardized benchmarking frameworks will be crucial for advancing the field.
For researchers selecting annotation tools, consideration should be given to data characteristics (complexity, similarity to existing references), available computational resources, and the trade-off between automation and biological interpretability. While AI-powered methods demonstrate rapidly advancing capabilities, reference-based approaches remain indispensable for well-characterized biological systems, particularly when protocol-matched references are available.
In the field of single-cell RNA sequencing research, cell type annotation represents a fundamental process where researchers classify individual cells into specific types based on their gene expression profiles. This process is crucial for understanding tissue composition, disease mechanisms, and developmental biology. The integration of Large Language Models into scientific workflows promises to accelerate this research by helping researchers navigate complex biological databases, suggest annotation labels based on literature, and generate code for analysis pipelines. However, the reliability challenges inherent to LLMs—specifically their tendencies toward non-reproducible outputs and factual hallucinations—present significant risks to scientific integrity when these systems generate plausible but incorrect biological information or inconsistent computational code.
Hallucination in LLMs refers to outputs that appear fluent and coherent but are factually incorrect, logically inconsistent, or entirely fabricated [83]. In scientific contexts, this might manifest as incorrect gene function descriptions, fictitious signaling pathways, or misattributed biological processes. Simultaneously, reproducibility—the ability to obtain consistent results across repeated trials under similar conditions—faces challenges from the inherent randomness in LLM architectures and training procedures [84] [85]. Together, these issues form critical reliability concerns that researchers must address before integrating LLMs into high-stakes scientific workflows like cell type annotation.
Understanding and Categorizing LLM Hallucinations
A Taxonomy of Hallucinations
LLM hallucinations can be systematically categorized based on their nature and relationship to source information. This taxonomy helps researchers identify and mitigate specific types of errors in scientific applications [83] [86]:
- Intrinsic Hallucinations: Information generated by the model that directly contradicts the provided source or context. In single-cell research, this might include an LLM describing marker genes that contradict the provided expression matrix.
- Extrinsic Hallucinations: Information that cannot be verified from the source but isn't directly contradictory. This occurs when an LLM adds plausible-sounding but unverified details about cell types beyond what the experimental data supports.
- Factual Hallucinations: Outputs containing inaccurate or fabricated facts not aligned with established biological knowledge. An example would be incorrectly stating the chromosomal location of a marker gene.
- Logical Hallucinations: Outputs that are internally inconsistent or logically incoherent, such as contradictory statements about lineage relationships between cell types.
Root Causes of Hallucination in Scientific Contexts
The propensity for LLMs to hallucinate stems from both architectural and data-related factors that present particular challenges in scientific domains [83] [86] [87]:
- Probabilistic Generation Paradigm: LLMs fundamentally operate as next-word predictors based on statistical patterns rather than truth-seeking systems. They generate each subsequent token based on probabilistic distributions without genuine understanding of biological concepts [87].
- Training Data Limitations: When trained on incomplete, inaccurate, or unrepresentative biological data, models learn and reproduce these deficiencies. This is particularly problematic in rapidly evolving fields like single-cell genomics where knowledge bases are constantly expanding [86].
- Architectural and Decoding Factors: The transformer architecture itself, combined with decoding strategies designed to increase output diversity (like top-k sampling), can increase hallucination rates. In technical domains, this may manifest as overly confident but incorrect statements about novel cell types [86].
- Prompt-Induced Hallucinations: Ill-structured or ambiguous prompts can trigger inefficient outputs, especially when scientific terminology has multiple contextual meanings [83].
Table 1: Hallucination Types and Their Scientific Implications
| Hallucination Type | Definition | Potential Impact in Single-Cell Research |
|---|---|---|
| Intrinsic | Contradicts provided source | Misinterpretation of experimental data |
| Extrinsic | Ungrounded in source | Incorporation of unverified biological claims |
| Factual | Factually incorrect | Spread of misinformation about gene functions |
| Logical | Internally inconsistent | Flawed reasoning about cell lineage relationships |
The Challenge of Reproducibility in LLM Outputs
Fundamental Reproducibility Barriers
Reproducibility presents a distinct but equally critical challenge for scientific applications of LLMs. A model's response to identical prompts may vary due to several factors [84] [88] [85]:
- Stochastic Training Procedures: Deep learning models, including LLMs, are typically trained using stochastic gradient descent, which introduces randomness through weight initialization and data shuffling. This results in different final parameter values each training run, even with identical data and hyperparameters [85].
- Distributed Training Non-Determinism: When training occurs across distributed systems, the ordering of operations becomes unpredictable without explicit synchronization, which is often avoided for performance reasons [84].
- Architectural Factors: The use of non-smooth activation functions like ReLU has been shown to exacerbate irreproducibility by creating optimization landscapes with many local minima, causing models to converge to different solutions based on minor variations in training conditions [88].
- Inference-Time Randomness: During text generation, sampling techniques (like temperature settings) introduce variability, making identical prompts yield different outputs [87].
Reproducibility Implications for Scientific Workflows
In single-cell research, where computational analyses must yield consistent results across laboratories and time, LLM non-reproducibility poses significant challenges [85]:
- Code Generation Inconsistency: An LLM might generate different code implementations for the same analytical task when prompted multiple times, complicating verification and collaboration.
- Literature Synthesis Variability: Summaries of biological literature might emphasize different aspects or findings across generations, potentially leading to biased interpretations.
- Annotation Label Suggestion Drift: Suggested cell type labels might vary inconsistently based on minor prompt rephrasing, reducing trust in automated assistance.
Quantitative Assessment: Measuring Hallucination and Reproducibility
Established Metrics and Benchmarks
Researchers have developed specialized metrics and benchmarks to quantitatively assess both hallucination and reproducibility in LLMs. These provide standardized approaches for evaluating model reliability [83] [89]:
- Prompt Sensitivity (PS) and Model Variability (MV): These metrics, introduced in recent research, quantify the relative contribution of prompting strategies versus model-internal factors to hallucination rates [83].
- Semantic Entropy: A novel approach that addresses the challenge that the same meaning can be expressed with different wordings. It measures uncertainty at the level of meaning rather than specific token sequences by clustering semantically equivalent responses before computing entropy [89].
- Area Under Rejection Accuracy Curve (AURAC): Measures how accuracy improves when refusing to answer questions the model is most uncertain about, providing a practical metric for confabulation detection [89].
- Standardized Benchmarks: Established evaluation frameworks including TruthfulQA (for factuality), HallucinationEval (for faithfulness to source), and domain-specific benchmarks help standardize reliability assessment across models [83].
Table 2: Quantitative Metrics for Assessing LLM Reliability
| Metric Category | Specific Metrics | Interpretation | Ideal Value |
|---|---|---|---|
| Hallucination Detection | Semantic Entropy | Measures uncertainty at meaning level | Lower better |
| AUROC for incorrect answers | Ability to distinguish correct/incorrect outputs | 1.0 | |
| AURAC | Accuracy improvement via rejection | Higher better | |
| Reproducibility Measures | Output Consistency Score | Consistency across random seeds | 1.0 |
| Embedding Distance | Semantic difference between outputs | 0.0 | |
| Code Execution Equivalence | Functional equivalence of generated code | 1.0 |
Experimental Protocols for Reliability Assessment
Researchers can implement the following experimental protocols to quantitatively assess LLM reliability in scientific contexts [83] [89]:
Protocol 1: Semantic Entropy for Hallucination Detection
- Input Preparation: Compile a diverse set of scientific prompts relevant to single-cell research (e.g., "List marker genes for pancreatic beta cells").
- Multiple Generation: For each prompt, sample multiple responses (typically 5-10) using the same LLM with varied random seeds.
- Semantic Clustering: Cluster responses based on semantic equivalence using natural language inference tools or embedding similarity.
- Entropy Calculation: Compute semantic entropy as: ( H{sem} = -\sum{i=1}^{K} P(ci) \log P(ci) ) where ( K ) is the number of semantic clusters and ( P(c_i) ) is the probability of cluster i.
- Validation: Compare high-entropy responses with ground truth biological knowledge to validate hallucination detection accuracy.
Protocol 2: Output Consistency Measurement
- Prompt Set Design: Create a fixed set of technical prompts covering cell type annotation tasks.
- Repeated Querying: Submit each prompt to the target LLM multiple times (with temperature > 0) while recording all outputs.
- Consistency Scoring: For each prompt set, compute pairwise semantic similarity between all output combinations using sentence embeddings.
- Aggregate Metrics: Calculate mean pairwise similarity across all outputs as the consistency score for that model and prompt type.
- Condition Variation: Repeat under different temperature settings to quantify the tradeoff between diversity and reproducibility.
Mitigation Strategies: Reducing Hallucinations and Improving Reproducibility
Technical Approaches for Hallucination Reduction
Several technical strategies have demonstrated effectiveness in reducing hallucination frequency across different LLM applications [83] [90] [89]:
- Retrieval-Augmented Generation (RAG): This technique enhances factuality by coupling the LLM with external knowledge bases. When a query is received, RAG first retrieves relevant information from verified sources (such as single-cell databases like CellMarker or PanglaoDB), then conditions the LLM's generation on this retrieved context [87].
- Structured Prompting Strategies: Techniques like chain-of-thought (CoT) prompting significantly reduce hallucinations in prompt-sensitive scenarios by forcing the model to articulate reasoning steps before providing a final answer [83].
- Uncertainty-Based Filtering: Implementing confidence thresholds based on semantic entropy measurements allows systems to abstain from answering when likelihood of confabulation is high [89].
- Temperature Modulation: Adjusting the temperature parameter lower (e.g., 0.1-0.3) reduces randomness and makes outputs more conservative, though potentially less creative or diverse [87].
Reproducibility Enhancement Techniques
Improving output consistency requires addressing both training and inference variability [84] [88] [85]:
- Random Seed Control: Setting and documenting specific random seeds for both training and inference enables exact reproducibility when needed, though this should be reserved for development and testing rather than production use [84].
- Smooth Activation Functions: Replacing non-smooth functions like ReLU with smooth alternatives (SmeLU, GELU, Swish) has been shown to substantially improve reproducibility by creating more stable optimization landscapes [88].
- Deterministic Operations: Enforcing deterministic algorithms in deep learning frameworks, though this often comes with performance costs [84].
- Ensemble Methods: Combining predictions from multiple models or multiple runs can improve both accuracy and reliability, though at increased computational expense [88].
The Scientist's Toolkit: Research Reagent Solutions
Table 3: Essential Research Reagents for LLM Reliability Assessment
| Research Reagent | Function/Purpose | Implementation Examples |
|---|---|---|
| Benchmark Datasets | Standardized evaluation of hallucination rates | TruthfulQA, HallucinationEval, domain-specific scientific Q&A pairs |
| Semantic Entropy Calculator | Detect confabulations by measuring meaning-level uncertainty | Python implementation with NLI models for semantic clustering |
| Controlled Prompt Templates | Ensure consistent prompting across evaluation runs | Standardized templates for biological query formulation |
| Knowledge Bases | Ground LLM outputs in verified information | CellMarker, PanglaoDB, Human Protein Atlas, Gene Ontology |
| Reproducibility Configuration | Control random seeds and deterministic modes | PyTorch Lightning reproducibility settings, TFDETERMINISTICOPS |
| Smooth Activation Libraries | Improve training reproducibility | Custom implementations of SmeLU, GELU, or Swish activations |
As single-cell RNA sequencing research continues to generate increasingly complex datasets, the potential for LLMs to assist with cell type annotation and biological interpretation grows accordingly. However, realizing this potential requires addressing the fundamental challenges of hallucination and non-reproducibility through systematic approaches. By implementing rigorous assessment protocols employing metrics like semantic entropy, adopting mitigation strategies such as retrieval-augmentation and structured prompting, and maintaining appropriate human oversight, researchers can work toward sufficiently reliable LLM integration. These approaches will enable the scientific community to harness the productivity benefits of LLMs while safeguarding the factual accuracy and consistency required for rigorous single-cell research and drug development.
Cell type annotation is a foundational step in single-cell RNA sequencing (scRNA-seq) analysis, enabling researchers to decipher cellular heterogeneity within complex tissues and understand diverse biological functions. This process involves assigning identity labels to individual cells or clusters based on their gene expression profiles. Traditional annotation relies on manual comparison of differentially expressed genes against known canonical marker genes, a labor-intensive process requiring significant expertise. The emergence of automated computational methods has transformed this landscape, offering scalable, reproducible, and accurate alternatives. This case study provides a comprehensive benchmarking analysis of three prominent annotation approaches: the reference-based methods SingleR and Azimuth, and the large language model GPT-4, evaluating their performance, practical utility, and suitability for different research scenarios.
Methodologies and Experimental Protocols
The performance data for SingleR, Azimuth, and GPT-4 were synthesized from multiple independent studies that employed rigorous benchmarking frameworks. These studies typically evaluated annotation accuracy by comparing algorithm-generated cell labels with manual expert annotations used as ground truth. Key evaluation metrics included the degree of annotation agreement, computational efficiency, and robustness across diverse datasets, tissues, and species [13] [32].
SingleR Methodology
SingleR is a reference-based annotation method that operates by comparing gene expression profiles of query cells against labeled reference datasets. Its methodology involves:
- Reference Dataset Preparation: A high-quality scRNA-seq dataset with expertly annotated cell types serves as the reference. The data is normalized and log-transformed.
- Correlation Analysis: For each cell in the query dataset, SingleR calculates correlation coefficients (e.g., Spearman or Pearson) between its expression profile and the average expression profile of each cell type in the reference.
- Label Assignment: Each query cell is assigned the label of the reference cell type with the highest correlation score.
- Fine-Tuning (Optional): An optional step involves iterating the process using only labels with high confidence to refine annotations [32].
Azimuth Methodology
Azimuth is an application within the Seurat framework designed for reference-based mapping of single-cell data. Its workflow includes:
- Reference Building: A supervised principal component analysis (PCA) is performed on the integrated reference dataset, focusing on components that discriminate known cell types.
- Query Projection: The query dataset is projected into the same PCA space as the reference after robust integration and normalization (often using SCTransform).
- Nearest Neighbor Search: For each query cell, Azimuth identifies the most similar reference cells in the shared PCA space using a weighted nearest neighbor approach.
- Score Calculation & Prediction: A prediction score is computed for each potential cell type label based on the neighbors, and the label with the highest score is assigned to the query cell [32] [36].
GPT-4 Methodology
GPT-4 leverages a large language model for cell type annotation based on marker gene information. The typical protocol, implemented via tools like GPTCelltype or AnnDictionary, involves:
- Input Preparation: For each cell cluster, a list of top differentially expressed genes (typically the top 10 genes identified by a Wilcoxon rank-sum test) is compiled [13].
- Prompt Engineering: The gene list is fed to GPT-4 via a structured prompt. An example prompt is: "The following is a list of marker genes for a cell cluster from [tissue type]. What is the most likely cell type? Marker genes: [gene1, gene2, ..., gene10]."
- Iterative Refinement (Optional): The model can be interactively prompted to provide more granular annotations or to justify its reasoning, mimicking an expert's workflow [13] [47].
- Cost Management: When using the API, costs are linearly correlated with the number of queried cell types, typically amounting to less than \$0.1 for annotating an entire dataset [13].
Benchmarking Experimental Design
The following table summarizes the key aspects of the experimental designs used in the studies from which this benchmarking data is drawn.
Table 1: Experimental Design of Benchmarking Studies
| Aspect | SingleR & Azimuth Benchmark [32] | GPT-4 Benchmark [13] | Multi-Method LLM Benchmark [47] |
|---|---|---|---|
| Primary Data | 10x Xenium human breast cancer data; paired snRNA-seq as reference | Ten public datasets (e.g., HCA, HCL, MCA); five species; normal & cancer samples | Tabula Sapiens v2 atlas; multiple tissues processed independently |
| Ground Truth | Manual annotation by domain experts based on marker genes | Manual annotations from original study authors | Manual annotations provided in the atlas |
| Evaluation Metric | Composition similarity to manual annotation; running time | Agreement score (Full=1, Partial=0.5, Mismatch=0); cost | Direct string match; Cohen's kappa (κ); LLM-rated quality (perfect/partial/not) |
| Key Comparisons | SingleR, Azimuth, RCTD, scPred, scmapCell vs. manual | GPT-4 vs. GPT-3.5, CellMarker2.0, SingleR, ScType | 15 different commercial and open-source LLMs |
Quantitative Benchmarking Results
Performance Comparison Across Platforms
The table below synthesizes quantitative performance data for SingleR, Azimuth, and GPT-4 from the cited studies.
Table 2: Summary of Benchmarking Results for SingleR, Azimuth, and GPT-4
| Method | Reported Agreement with Manual Annotation | Computational Speed | Key Strengths | Key Limitations |
|---|---|---|---|---|
| SingleR | Best performing for Xenium data, closely matching manual annotation [32]. | Fast and efficient [32]. | Fast, accurate, easy to use; no training required [32]. | Performance depends on quality and relevance of the reference dataset. |
| Azimuth | High accuracy, results closely matching manual annotation [32]. | Not explicitly reported, but considered efficient. | Integrated Seurat workflow; powerful for mapping to curated references [36]. | Requires building a specialized reference; less flexible for novel cell types. |
| GPT-4 | ~75-95% full or partial match rate across most tissues and cell types [13]. Claude 3.5 Sonnet showed >80-90% accuracy for major types [47]. | Fast annotation via API; slower with interactive chat. | Vast knowledge base; requires no reference; handles diverse tissues; allows iterative refinement [13]. | Cost (API fees); "black-box" reasoning; potential for hallucination; performance dips with noisy genes [13]. |
Granular Performance Analysis
- Impact of Cell Type Category: GPT-4's performance varies by cell lineage. It demonstrates highest agreement for homogeneous populations like erythroid cells and adipocytes, and lower agreement for heterogeneous categories like stromal cells, though this sometimes reflects more precise annotation by GPT-4 [13]. It also performs exceptionally well for immune cells like granulocytes [13].
- Effect of Input Genes: For GPT-4, using the top 10 differential genes identified by a two-sided Wilcoxon test yields optimal performance. Including more genes can reduce agreement, as human experts also often rely on a small number of top markers [13].
- Robustness and Reproducibility: GPT-4 demonstrates high robustness, accurately distinguishing between pure and mixed cell types (93% accuracy) and known versus unknown cell types (99% accuracy) [13]. It also shows high reproducibility, generating identical annotations for the same marker genes in 85-91% of cases [13].
The Scientist's Toolkit: Essential Research Reagents and Software
This table details key software tools and resources essential for implementing the cell type annotation methods discussed in this case study.
Table 3: Essential Tools for Cell Type Annotation
| Tool/Resource | Function/Brief Explanation | Primary Use Case |
|---|---|---|
| Seurat [32] | A comprehensive R toolkit for single-cell data analysis, including normalization, clustering, and differential expression. | Standard preprocessing and analysis pipeline for scRNA-seq data. |
| Scanpy [13] | A Python-based toolkit for analyzing single-cell gene expression data, analogous to Seurat. | Preprocessing and analysis in Python-centric workflows. |
| SingleR Package [32] | An R package implementing the SingleR algorithm for reference-based cell type annotation. | Fast and accurate cell type labeling when a reference dataset exists. |
| Azimuth [32] [36] | A web-based application and R package within Seurat for mapping query cells to a curated reference. | Projecting query data onto a pre-built, high-quality reference atlas. |
| GPTCelltype [13] | An R software package developed to interface with GPT-4 for automated cell type annotation using marker genes. | Leveraging GPT-4 for annotation within an R analysis pipeline. |
| AnnDictionary [47] | A Python package built on AnnData and LangChain providing a unified interface for cell type annotation by multiple LLMs. | Flexible, LLM-agnostic annotation in Python workflows, supporting many models. |
| 10x Xenium Data [32] | Imaging-based spatial transcriptomics data providing spatial context and gene expression at single-cell resolution. | Benchmarking annotation methods on spatially-resolved transcriptomics data. |
This benchmarking analysis reveals that the optimal cell type annotation method is context-dependent. SingleR excels in standard scenarios where a high-quality, biologically relevant reference dataset is available, offering a fast, accurate, and easy-to-use solution, particularly for imaging-based spatial transcriptomics data like Xenium [32]. Azimuth is the tool of choice for researchers deeply embedded in the Seurat ecosystem who wish to leverage carefully curated reference atlases for robust mapping [36]. GPT-4 represents a paradigm shift, offering a powerful, reference-free alternative that leverages vast biological knowledge. It is particularly suited for exploratory research across diverse tissues, annotation of novel cell types without established references, and situations where iterative, expert-like refinement of labels is desired [13] [47]. However, its cost and the "black-box" nature of its decisions necessitate expert validation. Future developments in fine-tuned biological LLMs and the integration of hierarchical and multi-omics data promise to further enhance the accuracy, resolution, and biological relevance of automated cell type annotation.
In single-cell RNA sequencing (scRNA-seq) research, cell type annotation is the process of classifying individual cells into known biological types based on their transcriptomic profiles. It is a foundational step that transforms raw gene expression data into biologically meaningful insights, enabling researchers to understand cellular heterogeneity, identify rare cell populations, and explore the composition of tissues in health and disease. Given its critical role, a robust validation strategy is indispensable for ensuring that annotated cell types are accurate and biologically relevant. This guide provides a comprehensive framework for integrating computational and biological evidence to validate cell type annotations, thereby enhancing the reliability of findings for downstream research and drug development.
The Critical Need for Validation in scRNA-seq Annotation
Cell type annotation is typically achieved through a combination of unsupervised clustering and label assignment, often using marker genes from existing databases or through supervised methods with reference datasets [91] [92]. However, this process is fraught with challenges. Manual annotation, while benefiting from expert knowledge, is inherently subjective and can vary significantly between annotators [1]. Automated tools, while offering greater scalability and objectivity, often depend on the quality and comprehensiveness of their reference datasets, which can limit their accuracy and generalizability [1] [72]. Furthermore, clustering algorithms themselves can be unstable, struggling to accurately determine the number of cell types or to capture the intrinsic hierarchical structure of cellular identities [92].
These challenges can lead to misannotation, which propagates errors through all subsequent analyses, from the misinterpretation of cellular functions to the incorrect identification of drug targets. Therefore, a systematic validation strategy is not merely a best practice but a necessity for generating credible and translatable scientific knowledge. This strategy should rest on two pillars: computational validation to ensure analytical robustness, and biological validation to confirm functional relevance.
Computational Validation Strategies
Computational validation involves using in silico methods to assess the confidence, reproducibility, and reliability of the annotations before proceeding to costly laboratory experiments.
Benchmarking and Cross-Method Comparison
A primary computational strategy is to benchmark annotation results against established methods or ground truth datasets. A benchmark study of scRNA-seq simulation methods highlighted that the performance of tools can vary significantly across different evaluation criteria, such as their ability to capture true data properties or retain biological signals [93]. Similarly, when evaluating annotation tools, it is crucial to compare results from multiple algorithms.
Table 1: Key Computational Validation Tools and Their Applications
| Tool/Method | Type | Primary Function in Validation | Key Strength |
|---|---|---|---|
| LICT [1] | LLM-based Annotation | Provides an objective credibility score for annotations. | Reference-free; evaluates reliability based on marker gene expression. |
| scExtract [72] | LLM-based Automation | Automates annotation by extracting methodological details from research articles. | Ensures processing and clustering align with original publication standards. |
| SimBench [93] | Simulation Framework | Generates synthetic scRNA-seq data with known ground truth. | Allows for controlled evaluation of annotation method performance. |
| Cross-method Comparison | Strategy | Compares outputs from multiple annotation tools (e.g., SingleR, scType, CellTypist). | Identifies consensus annotations and highlights discrepancies for further investigation [72]. |
Objective Credibility Evaluation with LLMs
The emergence of Large Language Models (LLMs) offers a novel approach for objective assessment. Tools like LICT (Large Language Model-based Identifier for Cell Types) leverage multiple LLMs to annotate cells and, more importantly, provide a credibility score [1]. This strategy involves:
- Marker Gene Retrieval: For a given annotated cell type, the LLM is queried to generate a list of representative marker genes.
- Expression Pattern Evaluation: The expression of these marker genes is analyzed within the corresponding cell cluster from the input dataset.
- Credibility Assessment: The annotation is deemed reliable if a predefined number of marker genes (e.g., more than four) are expressed in a high percentage (e.g., 80%) of cells within the cluster [1].
This method provides a reference-free, quantitative measure of annotation reliability, helping to distinguish robust annotations from those that may be erroneous or ambiguous.
Figure 1: Workflow for objective credibility evaluation of cell type annotations using an LLM-based strategy.
Biological Validation Strategies
Computational evidence must be corroborated with biological validation to confirm that a computationally defined cell type possesses its expected biological function. This is a critical step for translating findings into therapeutic insights.
Functional Assays for Candidate Genes
A powerful approach is to prioritize candidate genes from scRNA-seq data and test their function using in vitro and in vivo models. A study on tip endothelial cells (ECs) exemplifies this process [94]. The researchers first prioritized candidate genes using a structured framework (GOT-IT guidelines), focusing on genes that were highly specific, novel in the context of angiogenesis, and technically feasible to target.
The prioritized genes were then subjected to a series of functional assays:
- In Vitro Knockdown: siRNA-mediated knockdown of candidate genes in primary human umbilical vein endothelial cells (HUVECs) to assess the impact on core cellular functions.
- Proliferation and Migration Assays: Functional changes were measured using techniques like ³H-Thymidine incorporation for proliferation and wound healing assays for migration [94].
- Sprouting Assays: More complex 3D models, such as spheroid-based sprouting assays, were used to mimic vessel formation, a key function of tip ECs.
This systematic validation revealed that four out of six top-ranked scRNA-seq markers indeed functioned as tip EC genes, underscoring that not all computationally top-ranked markers necessarily exert the predicted function [94].
Orthogonal Validation of Cell Identity
Beyond testing gene function, validating the identity of the cell population itself is crucial. This can be achieved through:
- Immunofluorescence (IF) or Immunohistochemistry (IHC): Confirming the presence of the annotated cell type by visualizing classic protein markers in the original tissue.
- Fluorescence-Activated Cell Sorting (FACS): Using cell surface markers to isolate the putative cell population and independently characterize it.
- Spatial Transcriptomics: Mapping the annotated cell types back to their original tissue locations to confirm they reside in an anatomically plausible niche [92].
Table 2: Key Reagents and Experimental Methods for Biological Validation
| Research Reagent / Method | Function in Validation | Example Application |
|---|---|---|
| siRNA/shRNA | Gene knockdown to assess loss-of-function phenotypes. | Testing the role of a candidate gene (e.g., CD93, TCF4) in endothelial cell migration and sprouting [94]. |
| Primary Cells (e.g., HUVECs) | In vitro model system for functional studies. | Used as a representative cellular system to validate the function of genes identified in tissue-specific scRNA-seq data [94]. |
| ³H-Thymidine Incorporation Assay | Measures cell proliferation. | Quantifying changes in proliferation after candidate gene knockdown [94]. |
| Wound Healing / Migration Assay | Measures cell motility. | Assessing the migratory capacity of cells upon gene perturbation [94]. |
| Spheroid-based Sprouting Assay | 3D model for complex functions like angiogenesis. | Validating the role of a gene in a more physiologically relevant context than 2D culture [94]. |
| Antibodies for IF/IHC/FACS | Orthogonal confirmation of protein-level expression. | Verifying the presence and abundance of a cell type-specific marker protein. |
An Integrated Workflow for Comprehensive Validation
A robust validation strategy seamlessly integrates computational and biological techniques. The following workflow provides a step-by-step guide for researchers.
- Initial Annotation & Computational Confidence Check: Perform cell type annotation using one or more automated tools. Subsequently, employ an objective credibility evaluator like LICT to score the confidence of each annotated cell population [1].
- Prioritization for Validation: Triage the results. Cell types with high confidence scores from multiple computational methods may require less stringent validation, while populations with low scores or high biological importance should be prioritized for downstream experimental validation.
- Biological Target Validation: For prioritized cell types or their defining marker genes, design a functional validation pipeline. This begins with in vitro knockdown/overexpression followed by phenotypic assays, and can progress to more complex in vivo models [94].
- Iterative Refinement: Use the results from biological validation to refine the computational models. For instance, if a gene is functionally validated, it can be added to future marker gene lists for more accurate annotation.
Figure 2: An integrated validation workflow combining computational checks and biological experiments.
Conclusion
Cell type annotation is rapidly evolving from a manual, expert-driven task to a sophisticated, AI-assisted process. The emergence of large language models like GPT-4 and Claude 3.5 Sonnet demonstrates high agreement with manual annotations, offering a powerful balance of speed and accuracy. However, the future of annotation lies not in full automation, but in a collaborative partnership between computational tools and deep biological expertise. As the field progresses, key challenges such as standardizing the annotation of rare cell types, improving model generalizability across platforms, and dynamically updating marker gene databases must be addressed. For biomedical and clinical research, particularly in drug development, robust and precise cell type annotation is the critical gateway to discovering novel cell states, understanding disease mechanisms, and identifying new therapeutic targets within complex tissues.
References
- 1. Evaluation of cell type annotation reliability using a large ... [https://www.nature.com/articles/s42003-025-08745-x]
- 2. How we tackle cell type annotation [https://www.scdiscoveries.com/blog/featured/how-we-tackle-cell-type-annotation/]
- 3. Current best practices in single‐cell RNA‐seq analysis [https://pmc.ncbi.nlm.nih.gov/articles/PMC6582955/]
- 4. Best single-cell RNA-sequencing data analysis tools in 2024 [https://www.biomage.net/blog/best-single-cell-rna-sequencing-data-analysis-tools-in-2024]
- 5. Top 10 Bioinformatics Tools for scRNA-seq in 2025 [https://neovarsity.org/blogs/top-bioinformatics-tools-for-scrna-seq]
- 6. Single Cell Expression Atlas [https://www.ebi.ac.uk/gxa/sc/home]
- 7. scRNASeqDB [https://bioinfo.uth.edu/scrnaseqdb/]
- 8. Single‐cell RNA sequencing technologies and applications [https://pmc.ncbi.nlm.nih.gov/articles/PMC8964935/]
- 9. Current annotation strategies for T cell phenotyping of ... [https://www.frontiersin.org/journals/immunology/articles/10.3389/fimmu.2023.1306169/full]
- 10. The Power of automated cell type annotation [https://singleron.bio/the-power-of-accurate-automated-cell-type-annotation/]
- 11. Annotation of cell types (ACT): a convenient web server for ... [https://genomemedicine.biomedcentral.com/articles/10.1186/s13073-023-01249-5]
- 12. An overview of computational methods in single-cell ... [https://pmc.ncbi.nlm.nih.gov/articles/PMC12065632/]
- 13. Assessing GPT-4 for cell type annotation in single-cell RNA ... [https://www.nature.com/articles/s41592-024-02235-4]
- 14. High-precision cell-type mapping and annotation of single ... [https://pmc.ncbi.nlm.nih.gov/articles/PMC12502291/]
- 15. Dissecting Cellular Heterogeneity Using Single-Cell RNA ... [https://pmc.ncbi.nlm.nih.gov/articles/PMC6449718/]
- 16. Single-cell and spatial transcriptome profiling identifies ... [https://www.sciencedirect.com/science/article/pii/S2090123225003820]
- 17. Single-cell transcriptomics reveals cellular heterogeneity ... [https://www.nature.com/articles/s42003-022-04142-w]
- 18. Establishing single cell RNA transcriptomics: a brief guide [https://pmc.ncbi.nlm.nih.gov/articles/PMC12403637/]
- 19. Tutorial: guidelines for the computational analysis of single ... [https://www.nature.com/articles/s41596-020-00409-w]
- 20. A novel batch-effect correction method for scRNA-seq data ... [https://pmc.ncbi.nlm.nih.gov/articles/PMC10914288/]
- 21. Batch effects in single-cell RNA sequencing data are ... [https://pmc.ncbi.nlm.nih.gov/articles/PMC6152897/]
- 22. Chapter 7 Cell type annotation - Bioconductor [https://bioconductor.org/books/3.13/OSCA.basic/cell-type-annotation.html]
- 23. Batch Effect in Single-cell RNA-seq: Frequently Asked ... [https://www.elucidata.io/blog/batch-effect-in-single-cell-rna-seq-frequently-asked-questions-and-answers]
- 24. Benchmarking integration of single-cell differential ... [https://www.nature.com/articles/s41467-023-37126-3]
- 25. Robustness of single-cell RNA-seq for identifying differentially ... [https://bmcgenomics.biomedcentral.com/articles/10.1186/s12864-023-09487-y]
- 26. A practical guide to single-cell RNA-sequencing for ... [https://genomemedicine.biomedcentral.com/articles/10.1186/s13073-017-0467-4]
- 27. singleCellBase: a high-quality manually curated database of ... [https://biomarkerres.biomedcentral.com/articles/10.1186/s40364-023-00523-3]
- 28. Web Resources for Cell Type Annotation [https://www.10xgenomics.com/analysis-guides/web-resources-for-cell-type-annotation]
- 29. Comparative benchmarking of single-cell clustering ... [https://genomebiology.biomedcentral.com/articles/10.1186/s13059-025-03719-y]
- 30. A Quantitative Framework for Evaluating Single-Cell Data ... [https://pmc.ncbi.nlm.nih.gov/articles/PMC7305633/]
- 31. Benchmarking cell type annotation methods for 10x Xenium ... [https://pmc.ncbi.nlm.nih.gov/articles/PMC11744978/]
- 32. Benchmarking cell type annotation methods for 10x Xenium ... [https://bmcbioinformatics.biomedcentral.com/articles/10.1186/s12859-025-06044-0]
- 33. Comparison of cell type annotation algorithms for revealing ... [https://www.frontiersin.org/journals/systems-biology/articles/10.3389/fsysb.2022.1026686/full]
- 34. Chapter 2 Using the classic mode | Assigning cell types ... [https://bioconductor.org/books/release/SingleRBook/classic-mode.html]
- 35. SingleR [https://aran-lab.com/software/singler/]
- 36. Analysis Approaches for Spatial Gene Expression Data [https://www.10xgenomics.com/analysis-guides/spatial-gex-lit-review]
- 37. A comparison of automatic cell identification methods for single-cell RNA sequencing data | Genome Biology | Full Text [https://genomebiology.biomedcentral.com/articles/10.1186/s13059-019-1795-z]
- 38. scPred: accurate supervised method for cell-type classification ... [https://genomebiology.biomedcentral.com/articles/10.1186/s13059-019-1862-5]
- 39. Automatic cell type identification methods for single-cell RNA sequencing - ScienceDirect [https://www.sciencedirect.com/science/article/pii/S2001037021004499]
- 40. CellTypist | automated cell type annotation for scRNA-seq ... [https://www.celltypist.org/]
- 41. Fully-automated and ultra-fast cell-type identification using ... [https://www.nature.com/articles/s41467-022-28803-w]
- 42. Advancing Automated Cell Type Annotation with Large ... [https://www.sciencedirect.com/science/article/pii/S2001037025004775]
- 43. Systematic benchmarking of high-throughput subcellular ... [https://pmc.ncbi.nlm.nih.gov/articles/PMC12534522/]
- 44. Large language models and their applications in ... [https://www.sciencedirect.com/science/article/pii/S2001037024003209]
- 45. LLM Comparison 2025: GPT-4 vs Claude vs Gemini and ... [https://www.ideas2it.com/blogs/llm-comparison]
- 46. scExtract: leveraging large language models for fully ... [https://pmc.ncbi.nlm.nih.gov/articles/PMC12178070/]
- 47. Benchmarking cell type and gene set annotation by large ... [https://www.nature.com/articles/s41467-025-64511-x]
- 48. LLMs outperform outsourced human coders on complex ... [https://www.nature.com/articles/s41598-025-23798-y]
- 49. LLM Benchmarking Guide: GPT-5 vs Grok-4 vs Claude ... [https://futureagi.com/blogs/llm-benchmarking-compare-2025]
- 50. Annotation of cell types (ACT): a convenient web server for ... [https://pubmed.ncbi.nlm.nih.gov/37924118/]
- 51. ACT [http://xteam.xbio.top/ACT/]
- 52. GPTCelltype: Reference-free and cost-effective automated cell ... [https://winnie09.github.io/Wenpin_Hou/pages/gptcelltype.html]
- 53. GPTCelltype: Automatic cell type annotation with GPT-4 [https://github.com/Winnie09/GPTCelltype]
- 54. Batch correction methods used in single-cell RNA sequencing ... [https://pmc.ncbi.nlm.nih.gov/articles/PMC12315870/]
- 55. Comprehensive generation, visualization, and reporting of ... [https://www.nature.com/articles/s41467-022-29212-9]
- 56. Single-cell RNA-seq: Quality Control Analysis - GitHub Pages [https://hbctraining.github.io/scRNA-seq/lessons/04_SC_quality_control.html]
- 57. 6. Quality Control [https://www.sc-best-practices.org/preprocessing_visualization/quality_control.html]
- 58. Batch Effect Correction [https://www.10xgenomics.com/analysis-guides/introduction-batch-effect-correction]
- 59. A benchmark of batch-effect correction methods for single-cell ... [https://genomebiology.biomedcentral.com/articles/10.1186/s13059-019-1850-9]
- 60. Batch effects in single-cell RNA-sequencing data are ... [https://www.nature.com/articles/nbt.4091]
- 61. Navigating single-cell RNA-sequencing: protocols, tools ... [https://pmc.ncbi.nlm.nih.gov/articles/PMC12085826/]
- 62. Celler: A Genomic Language Model for Long-Tailed Single ... [https://arxiv.org/html/2504.00020v2]
- 63. Exploring and mitigating shortcomings in single-cell ... [https://genomebiology.biomedcentral.com/articles/10.1186/s13059-025-03525-6]
- 64. Embracing the dropouts in single-cell RNA-seq analysis [https://www.nature.com/articles/s41467-020-14976-9]
- 65. Unsupervised cell functional annotation for single-cell RNA ... [https://pmc.ncbi.nlm.nih.gov/articles/PMC9528981/]
- 66. A Practical Guide to Single-Cell RNA-Seq Cluster Annotation [https://www.nygen.io/resources/blog/scrna-seq-cluster-annotation]
- 67. scICE: enhancing clustering reliability and efficiency of ... [https://www.nature.com/articles/s41467-025-60702-8]
- 68. Single Cell Sequencing and The Future of Drug Discovery [https://www.parsebiosciences.com/blog/single-cell-sequencing-and-the-future-of-drug-discovery/]
- 69. Discovery of optimal cell type classification marker genes from ... [https://bmcmethods.biomedcentral.com/articles/10.1186/s44330-024-00015-2]
- 70. Label-free selection of marker genes in single-cell and ... [https://pubmed.ncbi.nlm.nih.gov/41224531/]
- 71. ScInfeR: an efficient method for annotating cell types and ... [https://pmc.ncbi.nlm.nih.gov/articles/PMC12140018/]
- 72. scExtract: leveraging large language models for fully ... [https://genomebiology.biomedcentral.com/articles/10.1186/s13059-025-03639-x]
- 73. Annotating Cell Types in Xenium In Situ Data with Label ... [https://www.10xgenomics.com/analysis-guides/xenium-cell-type-annotation]
- 74. A practical guide for choosing an optimal spatial ... [https://bmcgenomics.biomedcentral.com/articles/10.1186/s12864-025-11235-3]
- 75. Analysis, visualization, and integration of spatial datasets ... [https://satijalab.org/seurat/articles/spatial_vignette.html]
- 76. Technology focus: Xenium - SpatialData [https://spatialdata.scverse.org/en/latest/tutorials/notebooks/notebooks/examples/technology_xenium.html]
- 77. Annotation Metrics [https://prodi.gy/docs/metrics]
- 78. Cell Marker Accordion: interpretable single-cell and spatial ... [https://www.nature.com/articles/s41467-025-60900-4]
- 79. VICTOR: Validation and inspection of cell type annotation ... [https://www.sciencedirect.com/science/article/pii/S2001037024002873]
- 80. Cell type annotation | Official 10x Genomics Support [https://www.10xgenomics.com/support/software/cell-ranger/latest/analysis/running-pipelines/cr-cell-annotation-pipeline]
- 81. Get, set, annotate - an overview of cell type prediction ... [https://www.cellkb.com/blog/cell_type_annotation_review]
- 82. A Cell Type Annotation Tool for Single-Cell RNA-seq Data [https://pmc.ncbi.nlm.nih.gov/articles/PMC7235421/]
- 83. Survey and analysis of hallucinations in large language ... [https://www.frontiersin.org/journals/artificial-intelligence/articles/10.3389/frai.2025.1622292/full]
- 84. The Myth of Machine Learning Non-Reproducibility and ... [https://www.sei.cmu.edu/blog/the-myth-of-machine-learning-reproducibility-and-randomness-for-acquisitions-and-testing-evaluation-verification-and-validation/]
- 85. Challenges to the Reproducibility of Machine Learning ... [https://pmc.ncbi.nlm.nih.gov/articles/PMC7335677/]
- 86. Hallucination (artificial intelligence) [https://en.wikipedia.org/wiki/Hallucination_(artificial_intelligence)]
- 87. AI Hallucinations: What Designers Need to Know [https://www.nngroup.com/articles/ai-hallucinations/]
- 88. Reproducibility in Deep Learning and Smooth Activations [https://research.google/blog/reproducibility-in-deep-learning-and-smooth-activations/]
- 89. Detecting hallucinations in large language models using ... [https://www.nature.com/articles/s41586-024-07421-0]
- 90. What Are AI Hallucinations? [https://www.ibm.com/think/topics/ai-hallucinations]
- 91. Mapping Cell Identity from scRNA-seq: A primer on ... [https://www.sciencedirect.com/science/article/pii/S2001037025001199]
- 92. A Review of Single-Cell RNA-Seq Annotation, Integration, and ... [https://pmc.ncbi.nlm.nih.gov/articles/PMC10417635/]
- 93. A benchmark study of simulation methods for single-cell ... [https://www.nature.com/articles/s41467-021-27130-w]
- 94. Prioritization and functional validation of target genes from ... [https://www.nature.com/articles/s42003-023-05006-7]