Gene Function Prediction with Single-Cell Foundation Models: A Practical Guide to Embeddings, Applications, and Benchmarking
This article provides a comprehensive overview of the rapidly evolving field of gene function prediction using single-cell Foundation Model (scFM) embeddings.
Gene Function Prediction with Single-Cell Foundation Models: A Practical Guide to Embeddings, Applications, and Benchmarking
Abstract
This article provides a comprehensive overview of the rapidly evolving field of gene function prediction using single-cell Foundation Model (scFM) embeddings. Tailored for researchers and drug development professionals, it explores the foundational concepts of scFMs, which treat cells as sentences and genes as words to learn universal biological principles from vast single-cell datasets. The content details methodological approaches for extracting and utilizing gene and cell embeddings in functional tasks, from variant effect prediction to in silico perturbation modeling. Crucially, it addresses current limitations and optimization strategies, synthesizing evidence from recent rigorous benchmarks that reveal scFMs often struggle to outperform simple linear baselines for specific prediction tasks. Finally, the article offers a framework for validation and model selection, empowering scientists to critically evaluate these powerful tools and apply them effectively in biomedical research.
Demystifying Single-Cell Foundation Models: From Cellular 'Language' to Functional Embeddings
What are Foundation Models and Why Do They Matter for Biology?
Foundation models are a class of large-scale deep learning models trained on vast and diverse datasets, capable of being adapted to a wide range of downstream tasks [1]. In biology, these models are trained on massive genomic, transcriptomic, proteomic, and other omics datasets to learn the fundamental "language" of life [2]. They matter because they mark a shift from traditional, single-task models to a more integrated, systems-level understanding of biology, enabling researchers to decode disease complexity and accelerate drug discovery with unprecedented precision [3].
The core idea behind biological foundation models is their pretraining on extensive, unlabeled datasets through self-supervised learning. This process allows the model to learn generalizable patterns and relationships within the data [1] [4]. Once a foundation model is established, it can be fine-tuned for specific applications with relatively few additional labeled examples, transferring its learned knowledge to improve performance on target tasks [1].
The "Language" of Biology
Inspired by successes in natural language processing (NLP), researchers treat biological components analogously to words in a language [4].
- Single-Cell Biology: Individual cells are treated as "sentences," and genes or other genomic features (along with their expression values) are treated as "words" or tokens [1] [4].
- DNA and Proteins: Nucleotides in a DNA sequence or amino acids in a protein sequence are processed as sequential tokens, allowing the model to learn grammar and semantics from genomic or proteomic data [3] [5].
This approach allows models to capture intricate long-range relationships and dependencies within biological data using transformer architectures, which use attention mechanisms to weight the importance of different tokens [1].
Key Applications in Biological Research
Foundation models are being applied across diverse areas of biology, from understanding single-cell function to designing novel proteins.
Single-Cell Biology (scFMs)
Single-cell foundation models (scFMs) learn from millions of single-cell transcriptomes to characterize cellular heterogeneity and states [1]. Key applications include:
- Cell Type Annotation: Models like scBERT are trained in a self-supervised manner for annotating novel cell types [1] [4].
- Predicting Perturbation Responses: Models can be fine-tuned to predict how cells will respond to genetic perturbations or drug treatments, although this remains a challenging area [2] [6]. For example, scGen predicts single-cell perturbation responses [2], and GEARS integrates gene-gene relationship knowledge graphs to predict transcriptional outcomes [2].
- Multi-omics Data Integration: Models such as scGPT are designed to integrate diverse data types, including transcriptomics, epigenomics, and proteomics, to create a unified representation of cellular state [2] [7].
Genomics and Gene Regulation
Models trained on DNA sequences learn to interpret the genetic code and predict regulatory elements.
- Non-Coding Variant Effects: DeepSEA uses deep learning to predict the effects of noncoding genomic variants on chromatin and epigenetic regulatory mechanisms [7]. Enformer is optimized to include long-range interactions (up to 100kb) in these predictions [7].
- Function-Guided Sequence Design: Evo, a genomic language model, can perform "semantic design" by using a DNA prompt encoding genomic context to generate novel sequences enriched for specific functions. This has been validated by experimentally testing generated anti-CRISPR proteins and toxin–antitoxin systems [5].
Proteomics
Proteomic foundation models have revolutionized the prediction of protein structures and functions.
- Protein Structure Prediction: AlphaFold uses neural networks to predict 3D protein structures from amino acid sequences with near-experimental accuracy [2] [7]. Its developers won the 2024 Nobel Prize in Chemistry for this breakthrough.
- Protein Function and Design: Models like ESM3 are language models that simultaneously reason over the sequence, structure, and function of proteins, enabling the simulation of evolution and the design of novel proteins [2].
Spatial Biology
Spatial foundation models incorporate spatial context, which is crucial for understanding tissue architecture and cellular communication.
- Nicheformer: Trained on both dissociated and spatially-resolved transcriptomics data, this model makes context-specific predictions about the spatial microenvironment of cells, helping to bridge the gap between cell-atlas data and spatial context [7].
- Novae: This model uses graph-based learning to correct for batch effects and enable more informative comparisons of spatial domains across different tissue samples and experiments [7].
Table 1: Selected Biological Foundation Models and Their Primary Applications
| Model Name | Domain | Primary Application | Key Feature |
|---|---|---|---|
| scGPT [7] | Single-Cell | Multi-omics integration, cell annotation, perturbation prediction | Generative pre-trained transformer on ~33 million cells [2] |
| Geneformer [7] | Single-Cell | Network dynamics from scRNA-seq | Pretrained on 95 million single-cell transcriptomes [7] |
| AlphaFold [7] | Proteomics | Protein structure prediction | Near-experimental accuracy from amino acid sequence [2] [7] |
| Evo [5] | Genomics | De novo gene and operon design | Uses genomic context ("semantic design") for function-guided generation |
| Enformer [7] | Genomics | Gene expression prediction | Incorporates long-range DNA interactions (up to 100kb) |
| Nicheformer [7] | Spatial | Spatial microenvironment prediction | Integrates dissociated and spatially-resolved data |
Quantitative Performance of Foundation Models
While foundation models show great promise, their performance must be critically evaluated against simpler baseline methods.
Benchmarking Perturbation Prediction
A recent benchmark study evaluated several foundation models (scGPT, scFoundation) and other deep learning models (GEARS, CPA) against simple linear baselines for predicting transcriptome changes after single or double genetic perturbations [6]. The baselines were:
- 'No change' model: Always predicts the same expression as the control condition.
- 'Additive' model: For a double perturbation, predicts the sum of the individual logarithmic fold changes (LFCs) from single perturbations.
The study found that none of the deep learning models outperformed the simple additive baseline in predicting expression changes for held-out double perturbations [6]. Furthermore, when predicting genetic interactions (where the double perturbation effect is non-additive), no model performed better than the 'no change' baseline [6].
Table 2: Benchmarking Results for Perturbation Prediction (L2 Distance for Top 1,000 Genes) [6]
| Model Type | Example Models | Performance vs. Additive Baseline | Notes |
|---|---|---|---|
| Simple Baseline | Additive Model | Best (Reference) | Simple, non-AI baseline |
| Simple Baseline | No Change Model | Worse | Simple, non-AI baseline |
| Foundation Models | scGPT, scFoundation | Worse | Required significant computational expense for fine-tuning |
| Other DL Models | GEARS, CPA | Worse | CPA was not designed for unseen perturbations |
Utility of Learned Representations
The same study also investigated whether the data representations (embeddings) learned by foundation models during pretraining provided any benefit. They extracted gene embedding matrices from scFoundation and scGPT and used them in a simple linear model [6]. The findings were mixed:
- Linear models equipped with these pretrained embeddings performed as well or better than the original models with their in-built decoders [6].
- However, these embeddings did not consistently outperform a linear model using embeddings derived directly from the perturbation training data [6].
- The best-performing approach was a linear model with embeddings pretrained on a different perturbation dataset (from a different cell line), suggesting that pretraining on specific perturbation data is more beneficial than pretraining on general single-cell atlas data for this task [6].
Experimental Protocols
This section provides detailed methodologies for key experiments involving foundation models, particularly in the context of gene function prediction and validation.
Protocol: Fine-Tuning an scFM for Perturbation Response Prediction
This protocol outlines the steps to adapt a pretrained single-cell foundation model to predict transcriptional responses to genetic perturbations [6] [1].
Research Reagent Solutions & Materials
- Pretrained Model Weights: e.g., for scGPT or Geneformer.
- Perturbation Dataset: A single-cell RNA-seq dataset profiling genetic perturbations (e.g., CRISPR-based) and an unperturbed control. Example: Norman et al. (K562 cells with CRISPRa on 100 single genes and 124 pairs) [6].
- Computing Environment: High-performance computing node with GPU acceleration (e.g., NVIDIA A100 or H100).
- Software Libraries: PyTorch or TensorFlow, scvi-tools, and the model's specific codebase (e.g., scGPT GitHub repository).
Procedure
- Data Preprocessing:
- Tokenization: Convert the gene expression matrix of the perturbation dataset into the token format required by the model. This typically involves ranking genes by expression level within each cell or binning expression values [1] [4].
- Formatting: Structure the data into (perturbation, expression profile) pairs. For the control population, assign a "no perturbation" token.
Model Setup:
- Load the pretrained foundation model architecture and its weights.
- Add a task-specific prediction head if needed (e.g., a linear decoder that maps the model's cell embedding to the gene expression space) [6].
Fine-Tuning:
- Freeze a portion of the pretrained layers initially to avoid catastrophic forgetting.
- Train the model on the perturbation dataset using a regression loss (e.g., Mean Squared Error) between the predicted and observed expression profiles. Use a held-out validation set for early stopping.
- Unfreeze all layers and continue training with a lower learning rate for full model adaptation.
Evaluation:
- Evaluate the model on a completely held-out test set of perturbations (e.g., double perturbations not used in training). Compare its performance against simple baselines like the 'additive' model using metrics like L2 distance or Pearson correlation [6].
Diagram 1: Workflow for fine-tuning an scFM on perturbation data.
Protocol: Semantic Design of Functional Genes with a Genomic LM
This protocol describes the use of a generative genomic language model, like Evo, for designing novel functional genes based on genomic context, as validated in recent research [5].
Research Reagent Solutions & Materials
- Genomic Language Model: Evo 1.5 model [5].
- DNA Prompt Sequence: A genomic sequence of known function to serve as context (e.g., a gene or operon).
- Sampling Compute: Server with sufficient memory to run the model with long-context prompts (e.g., 131k context length).
- Validation Assays: Resources for functional validation (e.g., growth inhibition assays for toxins, interaction assays for antitoxins).
Procedure
- Prompt Engineering:
- Identify a genomic "context" sequence associated with the function of interest. In prokaryotes, this could be a gene from a toxin-antitoxin system or a known anti-CRISPR gene [5].
- The prompt can be the sense strand, the reverse complement, or the upstream/downstream genomic context of the target gene.
Sequence Generation:
- Input the prompt into the Evo model and use it to generate a set of candidate sequences through sampling. The model will "autocomplete" the sequence based on the learned distributional semantics of prokaryotic genomes [5].
In Silico Filtering:
- Filter the generated sequences for those that encode open reading frames (for proteins).
- Apply novelty filters, e.g., requiring low sequence identity to known proteins in databases.
- For multi-component systems (e.g., toxin-antitoxin), use structure prediction tools to assess potential complex formation [5].
Experimental Validation:
- Synthesize the top candidate sequences.
- Test their function in a relevant biological assay. For example, for a generated toxin, test its ability to inhibit bacterial growth in a growth inhibition assay. For a generated anti-CRISPR, test its ability to inhibit CRISPR-Cas activity [5].
Diagram 2: Semantic design of genes using a genomic LM.
The Scientist's Toolkit
Table 3: Essential Research Reagents and Computational Tools
| Item | Function/Description | Example Use Case |
|---|---|---|
| Pretrained Model Weights | Pre-learned parameters of a foundation model that can be downloaded and fine-tuned. | Starting point for adapting scGPT or Geneformer to a specific task without training from scratch [7]. |
| Curated Single-Cell Atlas | Large, integrated collection of single-cell datasets used for pretraining or benchmarking. | CELLxGENE and the Human Cell Atlas provide standardized data for over 100 million cells [1] [4]. |
| Perturbation Datasets | Single-cell RNA-seq data from genetic or chemical perturbation experiments. | Used as labeled data for fine-tuning models to predict perturbation responses (e.g., Norman et al. data) [6]. |
| GPU Computing Cluster | High-performance computing resource with multiple GPUs. | Essential for training and fine-tuning large foundation models, which are computationally intensive [1] [6]. |
| Functional Assay Kits | Wet-lab kits for testing biological function (e.g., growth inhibition, protein-binding). | Critical for experimentally validating the function of sequences generated by models like Evo [5]. |
Foundation models represent a paradigm shift in computational biology, offering a unified framework to integrate and interpret complex biological data. Their ability to learn the fundamental principles of biological systems from massive datasets holds immense promise for gene function prediction, novel therapeutic design, and unraveling cellular mechanisms. However, critical benchmarks reveal that their performance on specific tasks, such as predicting genetic perturbation effects, does not yet consistently surpass that of simple linear models [6]. This highlights the importance of rigorous evaluation and continued method development. The future of foundation models in biology will likely involve more sophisticated multimodal integration, improved scalability, and a stronger focus on generating interpretable and actionable biological insights that can be validated experimentally.
The explosion of single-cell RNA sequencing (scRNA-seq) data has revolutionized our understanding of biological systems at cellular resolution. Concurrently, artificial intelligence has witnessed remarkable progress through foundation models in natural language processing (NLP). This confluence has given rise to a powerful conceptual framework: viewing cells as sentences and genes as words. In this analogy, the complete transcriptome of a cell forms a coherent biological "sentence," where the expression patterns of individual genes (words) create meaning through their contextual relationships [8].
Single-cell foundation models (scFMs) operationalize this analogy by treating scRNA-seq data as a biological "corpus" from which to learn universal representations. These models aim to capture the fundamental grammar and syntax of cellular states, enabling researchers to predict how cells respond to perturbations, annotate cell types, and infer gene function [9] [8]. This document provides application notes and experimental protocols for leveraging scFM embeddings in gene function prediction, framed within a broader thesis on advancing therapeutic discovery through computational biology.
Quantitative Benchmarking of scFMs for Biological Prediction
Performance Evaluation Across Multiple Tasks
Recent benchmarking studies have systematically evaluated scFMs against traditional methods. The table below summarizes performance findings across key biological prediction tasks:
Table 1: Performance of single-cell foundation models across diverse tasks
| Task Category | Specific Task | Model Performance Findings | Key References |
|---|---|---|---|
| Perturbation Effect Prediction | Predicting transcriptional responses to genetic perturbations | scFM embeddings showed limited improvement over simple baselines, particularly under distribution shift and for strong/atypical perturbations [9] [10]. | PertEval-scFM framework [9] |
| Cell-level Tasks | Batch integration; Cell type annotation | scFMs are robust and versatile, but simpler models can be more efficient for specific datasets; no single scFM consistently outperforms others [8]. | Biology-driven benchmark [8] |
| Gene-level Tasks | Gene function prediction; Tissue specificity | Gene embeddings from scFMs capture functional relationships and can predict Gene Ontology terms [8]. | FuncBase; FRoGS comparison [8] |
Evaluation Metrics and Framework Insights
The PertEval-scFM framework provides standardized assessment for perturbation prediction, while broader benchmarks employ multiple metrics:
Table 2: Evaluation metrics and frameworks for scFM assessment
| Evaluation Dimension | Specific Metrics | Framework Insights |
|---|---|---|
| Perturbation Prediction | Zero-shot embedding performance; Distribution shift robustness | Reveals that current scFMs struggle with strong or atypical perturbations, likely due to training on mostly mild perturbations [9]. |
| Biological Relevance | scGraph-OntoRWR (cell type relationships); LCAD (annotation error severity) | Novel ontology-informed metrics show scFMs capture biologically meaningful relationships between cell types [8]. |
| General Model Utility | 12+ metrics including unsupervised, supervised, and knowledge-based approaches | Holistic rankings help guide model selection based on dataset size, task complexity, and computational resources [8]. |
Experimental Protocols for scFM-Based Gene Function Prediction
Protocol 1: Gene Embedding Extraction and Functional Analysis
Purpose: To extract gene embeddings from scFMs and use them to predict gene function and relationships.
Materials and Reagents:
- Computational Environment: High-performance computing cluster with GPU acceleration
- Software: Python/R environment with scFM implementations (Geneformer, scGPT, UCE, scFoundation, LangCell, scCello) [8]
- Data: Preprocessed scRNA-seq dataset; Gene Ontology annotations
Procedure:
- Model Selection and Setup: Choose appropriate scFM based on task requirements. Install and configure the model according to documentation [8].
- Gene Embedding Extraction: Access the gene embedding matrix from the input layer of the scFM. These embeddings are typically learned from diverse cellular contexts during pretraining [8].
- Functional Similarity Analysis: Compute cosine similarity between gene embeddings to identify functionally related genes. Validate against known biological pathways.
- Gene Ontology Prediction: Train simple classifiers (e.g., logistic regression) using gene embeddings to predict GO term associations. Compare performance against traditional methods like FRoGS [8].
- Cross-Validation: Implement k-fold cross-validation to assess prediction robustness. Use metrics like AUC-ROC for quantitative comparison.
Troubleshooting Tips:
- If embeddings show poor functional discrimination, ensure the scFM was pretrained on relevant cellular contexts
- For large gene sets, consider dimensionality reduction techniques (PCA, UMAP) to visualize embedding relationships
Protocol 2: Perturbation Response Prediction Using Zero-Shot Embeddings
Purpose: To predict cellular responses to genetic perturbations using zero-shot scFM embeddings.
Materials and Reagents:
- Framework: PertEval-scFM benchmark framework [9]
- Data: Perturb-seq data combining gene expression from perturbed and unperturbed cells
- Controls: Baseline models (e.g., HVG selection, Seurat, Harmony, scVI) [8]
Procedure:
- Data Preparation: Process Perturb-seq data following PertEval-scFM guidelines. Select highly variable genes to focus analysis on most informative features [9].
- Embedding Generation: Generate cell embeddings using scFMs in zero-shot mode (without task-specific fine-tuning).
- Control State Representation: Compute average gene expression for control cells to establish baseline reference state [9].
- Perturbation Effect Modeling: Train simple models (e.g., linear classifiers) using scFM embeddings to predict perturbation effects compared to raw gene expression data.
- Evaluation Under Distribution Shift: Test model performance across different experimental conditions to assess robustness to distribution shifts [9] [10].
- Benchmarking: Compare against baseline methods using metrics implemented in PertEval-scFM framework.
Interpretation Guidelines:
- Minimal improvement over baselines suggests scFM embeddings may not capture perturbation-specific information
- Performance degradation on strong perturbations indicates limited generalization capability
- Consistent performance across distribution shifts indicates robust biological learning
Protocol 3: Biological Knowledge Validation Using Ontology-Informed Metrics
Purpose: To validate whether scFMs capture biologically meaningful relationships using ontology-based metrics.
Materials and Reagents:
- Metrics: scGraph-OntoRWR, Lowest Common Ancestor Distance (LCAD) [8]
- Data: Cell ontology hierarchies; Expert-annotated cell type references
Procedure:
- Cell Embedding Extraction: Generate zero-shot cell embeddings from scFMs for a diverse set of cell types.
- Cell Relationship Mapping: Construct k-nearest neighbor graphs from cell embeddings to identify similarity relationships between cell types.
- Ontological Consistency Assessment: Apply scGraph-OntoRWR metric to measure consistency between embedding-derived relationships and established cell ontology hierarchies [8].
- Annotation Error Analysis: Use LCAD metric to quantify the severity of cell type misclassifications by measuring ontological distance between predicted and true cell types [8].
- Comparative Analysis: Evaluate multiple scFMs using these metrics to identify which models best capture biological ground truth.
Validation Criteria:
- High scGraph-OntoRWR scores indicate strong alignment with biological knowledge
- Lower LCAD values for errors suggest semantically reasonable misclassifications
- Consistent performance across diverse tissue types indicates generalizable biological understanding
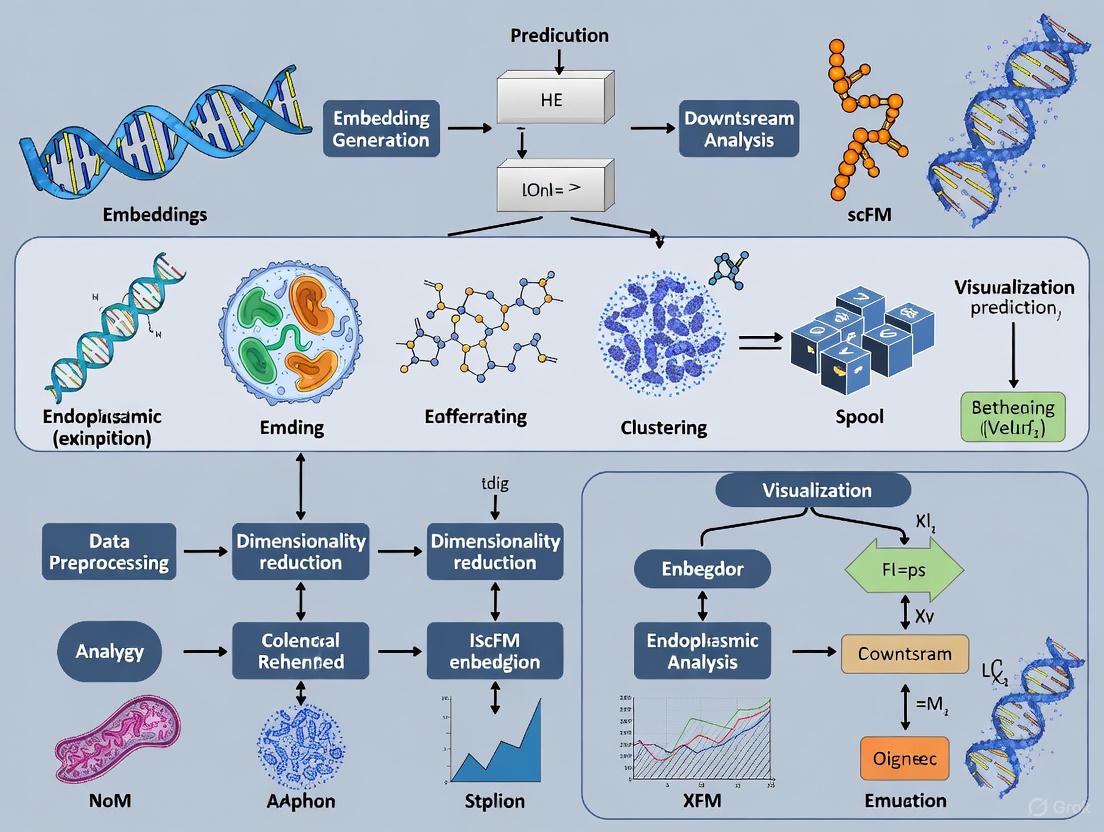
Visualization of scFM Workflows and Conceptual Framework
The Core Analogy: From Biological Data to Linguistic Concepts
scFM-Based Gene Function Prediction Workflow
Table 3: Essential resources for scFM research and gene function prediction
| Resource Category | Specific Tool/Resource | Function and Application |
|---|---|---|
| Benchmarking Frameworks | PertEval-scFM [9] [10] | Standardized evaluation of perturbation effect prediction; assesses performance under distribution shift |
| Evaluation Platforms | OmicsEV [11] | R package with 15+ evaluation metrics for omics data; generates HTML reports for comparative analysis |
| Gene Function Databases | FuncBase [12] | Resource for quantitative machine learning-based gene function annotations with community feedback system |
| Single-Cell Foundations Models | Geneformer, scGPT, UCE, scFoundation, LangCell, scCello [8] | Pretrained models with different architectures for extracting gene and cell embeddings |
| Biological Validation Metrics | scGraph-OntoRWR, LCAD [8] | Cell ontology-informed metrics measuring biological consistency of learned representations |
| Data Resources | CellxGene [8]; AIDA v2 [8] | Curated single-cell datasets for benchmarking and validation |
The "cells as sentences, genes as words" analogy provides a powerful conceptual framework for leveraging advances in NLP for biological discovery. Current benchmarking reveals that while scFMs show promise in capturing biological relationships, they have limitations in specific prediction tasks like perturbation response [9] [10]. The field is evolving toward more specialized models, higher-quality datasets capturing diverse cellular states, and improved evaluation methods that better reflect biological reality [9] [8].
Future development should focus on creating training datasets that encompass broader cellular states, including both subtle and strong perturbation effects [9]. Additionally, specialized models designed to take full advantage of large datasets while maintaining biological interpretability will enhance prediction capabilities [8]. As these models improve, they will become increasingly valuable for therapeutic development, offering in silico methods for triaging experimental candidates and identifying novel treatment strategies [12].
Single-cell foundation models (scFMs) are large-scale deep learning models pretrained on vast datasets of single-cell omics data, capable of being adapted to a wide range of downstream biological tasks [1] [4]. Inspired by the success of transformer architectures in natural language processing (NLP), researchers have developed scFMs that treat individual cells as sentences and genes or genomic features as words or tokens [1] [4]. By training on millions of cells encompassing diverse tissues and conditions, these models learn fundamental principles of cellular biology that generalize to new datasets and tasks, such as cell type annotation, perturbation response prediction, and gene regulatory network inference [1] [13].
The core innovation lies in applying the transformer's self-attention mechanism to single-cell data. This allows the model to weigh the importance of different genes within a cell, capturing complex, long-range dependencies and gene-gene interactions that are crucial for understanding cellular function and state [1]. Models like scGPT and Geneformer exemplify this approach, leveraging massive pretraining corpora to create foundational representations for single-cell biology [1] [14] [13].
Model Architectures and Core Technical Components
Foundational Transformer Architecture
At their core, scFMs are built on the transformer neural network architecture. Transformers utilize a self-attention mechanism that allows the model to dynamically weight the relevance of all input tokens (genes) when processing each individual token, thereby capturing complex contextual relationships within the data [1] [15]. The standard transformer comprises several key components:
- Embedding Layer: Converts raw input tokens into dense vector representations. In scFMs, this typically involves creating embeddings for gene identifiers and their expression values [1].
- Encoder Stack: Processes input embeddings through multiple layers of multi-head self-attention and feed-forward neural networks to build contextualized representations [15].
- Positional Encoding: Injects information about the order of tokens, necessary since transformers lack inherent sequential processing capabilities [1] [15].
For single-cell data, where genes lack a natural sequential order, researchers have developed innovative tokenization strategies to structure the input. Common approaches include ranking genes by expression levels within each cell or binning genes based on expression values to create deterministic sequences for transformer processing [1] [4].
Key scFM Architectures: scGPT and Geneformer
scGPT Architecture
scGPT adopts a GPT-like decoder architecture with a unidirectional masked self-attention mechanism [1]. This design enables the model to iteratively predict masked genes conditioned on known genes in the cell's expression profile. The model employs several technical innovations:
- Gene Tokenization: Represents each gene with a token embedding that combines gene identifier and expression value information [1].
- Special Tokens: Incorporates cell-level context tokens and modality indicators for multi-omic integration [1].
- Efficient Attention Mechanisms: Utilizes optimized attention patterns to handle the high dimensionality of gene expression data [13].
scGPT has been pretrained on over 33 million non-cancerous human cells, creating one of the most comprehensive scFMs to date [13]. This extensive pretraining enables strong performance across diverse downstream tasks including zero-shot cell type annotation and in silico perturbation modeling [13].
Geneformer Architecture
Geneformer employs a BERT-like encoder architecture with bidirectional attention mechanisms [14]. This allows the model to learn from the context of all genes in a cell simultaneously during pretraining. Key characteristics include:
- Contextual Gene Embeddings: Learns representations that capture how gene function varies across cellular contexts [14].
- Transfer Learning Focus: Emphasizes fine-tuning capabilities for specific biological applications [14].
- Hierarchical Representation: Builds embeddings at both gene and cell levels for multi-scale analysis [14].
Geneformer's pretraining incorporates attention mechanisms that learn and weight relationships between any pair of input tokens, enabling the model to identify which genes are most informative of a cell's identity or state [1].
Architectural Evolution and Innovations
Recent advancements in scFM architectures have introduced several improvements over vanilla transformer designs:
- Normalization Techniques: Modern implementations often use RMSNorm instead of LayerNorm for improved training stability and efficiency [16].
- Activation Functions: SwiGLU and GeLU activations have largely replaced ReLU in feed-forward networks, providing smoother gradients and better performance [16].
- Sparse Attention: Optimization of attention mechanisms to handle the long sequences represented by thousands of genes per cell [16].
Table 1: Comparative Architecture of Leading scFMs
| Feature | scGPT | Geneformer |
|---|---|---|
| Architecture Type | GPT-like Decoder | BERT-like Encoder |
| Attention Mechanism | Unidirectional/Masked | Bidirectional |
| Primary Pretraining Objective | Generative Gene Prediction | Masked Gene Modeling |
| Typical Pretraining Scale | 33+ million cells [13] | Not Specified |
| Tokenization Strategy | Gene ranking + value binning [1] | Gene ranking by expression [1] |
| Multi-omic Capability | Yes (transcriptomics, epigenomics, spatial) [1] | Primarily transcriptomics |
Application Notes for Gene Function Prediction
Zero-Shot Gene Function Annotation
scFMs enable zero-shot gene function prediction by leveraging the biological knowledge encoded during pretraining. The workflow involves:
- Embedding Generation: Process single-cell data through the foundation model to generate contextual gene embeddings.
- Similarity Analysis: Calculate cosine similarity between gene embeddings in the latent space.
- Functional Transfer: Infer functions for poorly characterized genes based on their proximity to well-annotated genes in the embedding space.
In practice, genes with similar functions cluster together in the embedding space, allowing functional annotation transfer from known to unknown genes without additional training [17]. For example, scGPT embeddings have demonstrated the ability to group genes from the same pathways and biological processes, enabling prediction of novel gene functions through neighborhood analysis in the latent space [17] [13].
Gene-Gene Interaction and Pathway Analysis
scFMs excel at identifying context-specific gene-gene interactions that vary across cell types and states. The scNET framework enhances this capability by integrating protein-protein interaction (PPI) networks with scRNA-seq data using graph neural networks [17]. The protocol involves:
- Dual-View Encoding: Simultaneously learning gene-gene relationships from PPI networks and cell-cell relationships from expression similarity.
- Attention-Based Refinement: Using attention mechanisms to prune irrelevant connections in the cell-cell similarity graph.
- Pathway Activation Scoring: Calculating pathway activity scores from the integrated embeddings.
Quantitative evaluations show that scNET's gene embeddings achieve substantially higher correlation with Gene Ontology semantic similarity (mean correlation ~0.17) compared to methods without prior biological knowledge [17]. This integration of PPI information with expression data significantly enhances the detection of functional pathways and complexes from single-cell data.
In Silico Perturbation Modeling
scFMs enable in silico perturbation experiments to predict gene function by simulating knockout or overexpression scenarios:
- Input Manipulation: Modify the expression value of a target gene in the input representation.
- Forward Pass: Process the perturbed input through the foundation model.
- Response Analysis: Measure the predicted changes in other genes' expression values.
- Network Inference: Identify downstream effects and affected biological pathways.
scGPT specifically demonstrates strong performance in perturbation response prediction, accurately modeling how targeted manipulations affect global expression patterns and cellular states [13]. This capability provides a powerful computational alternative to expensive wet-lab experiments for initial hypothesis generation.
Experimental Protocols and Benchmarking
Protocol for Gene Function Prediction Using scFM Embeddings
Materials: Preprocessed scRNA-seq dataset, pretrained scFM (scGPT or Geneformer), computational environment with adequate GPU resources.
Procedure:
- Data Preprocessing:
- Normalize gene expression counts using log(CP10K+1) transformation.
- Filter to include highly variable genes (typically top 2000-5000).
- Format data according to model-specific requirements (gene ordering or binning).
Embedding Generation:
- Load pretrained model weights (available from BioLLM or model-specific repositories) [13].
- Process dataset through model to extract gene and cell embeddings.
- Save embeddings in standardized format (H5AD or CSV) for downstream analysis.
Functional Annotation:
- Calculate pairwise cosine similarities between all gene embeddings.
- Perform clustering (k-means or hierarchical) on gene embeddings.
- Conduct Gene Ontology enrichment analysis on resulting clusters.
- Annotate unknown genes based on cluster membership and similarity to characterized genes.
Validation:
- Compare predictions to known gene functions in databases like GO, KEGG.
- Perform cross-validation using holdout sets of well-annotated genes.
- Assess biological coherence of predicted gene functions through literature review.
Table 2: Quantitative Performance of scFMs on Gene Function Prediction Tasks
| Model | GO Semantic Similarity Correlation | Cluster Enrichment (GO Terms) | Cross-Species Accuracy |
|---|---|---|---|
| scNET | 0.17 (mean) [17] | Significant improvement across clustering resolutions [17] | Not Reported |
| scGPT | Not Reported | Not Reported | High (demonstrated in plant models) [13] |
| Geneformer | Not Reported | Not Reported | Not Reported |
| Traditional Methods | <0.1 (estimated) [17] | Lower enrichment percentages [17] | Variable |
Benchmarking Results and Limitations
Recent zero-shot evaluations provide critical insights into scFM capabilities and limitations. When applied without task-specific fine-tuning:
- Both scGPT and Geneformer underperform simpler methods like Highly Variable Genes (HVG) selection in cell type clustering tasks [14].
- For batch integration, scGPT shows better performance on datasets with both technical and biological batch effects, while traditional methods like Harmony and scVI excel at correcting technical variation alone [14].
- Pretraining provides clear benefits over randomly initialized models, but larger and more diverse pretraining datasets do not consistently confer additional advantages [14].
These results highlight that while scFMs show tremendous promise, their zero-shot performance requires careful validation against established baselines, particularly for discovery-focused applications where fine-tuning may not be feasible.
Table 3: Essential Research Reagents and Computational Tools for scFM Research
| Resource | Type | Function/Purpose | Example/Availability |
|---|---|---|---|
| CZ CELLxGENE | Data Platform | Provides unified access to annotated single-cell datasets; contains >100 million standardized cells [1] [13] | CELLxGENE Discover [1] |
| BioLLM | Software Framework | Standardized framework for integrating and benchmarking single-cell foundation models [13] | Universal interface for scFM access [13] |
| Pretrained Model Weights | Computational Resource | Enable transfer learning without expensive pretraining | scGPT (33M cells), Geneformer weights [13] |
| ARCHS4 | Data Repository | Uniformly processed RNA-seq data from GEO with AI-curated annotations [18] | 705,430 human transcriptomes with matched text [18] |
| Protein-Protein Interaction Networks | Biological Database | Provide functional context for gene embedding interpretation | Integrated in scNET for enhanced functional analysis [17] |
| DISCO Database | Data Platform | Aggregates single-cell data for federated analysis | Over 100 million cells for cross-study comparisons [13] |
Workflow and Pathway Visualizations
scFM Gene Function Prediction Workflow
Multi-omic Integration Architecture
In the rapidly evolving field of single-cell genomics, single-cell foundation models (scFMs) are revolutionizing how researchers interpret complex biological systems. These large-scale deep learning models, pretrained on vast single-cell datasets, have demonstrated remarkable capabilities in predicting gene function, annotating cell types, and simulating cellular responses to perturbation [4]. A critical preprocessing step that enables this powerful analysis is tokenization—the process of converting raw gene expression data into a structured format that artificial intelligence models can understand and process [4]. Within the context of gene function prediction research, effective tokenization transforms high-dimensional, sparse single-cell RNA sequencing (scRNA-seq) data into meaningful numerical representations that capture the fundamental biological principles governing cellular behavior and gene regulatory networks [19]. This technical note details the methodologies and protocols for implementing tokenization strategies that optimally prepare single-cell data for scFM training and fine-tuning, with particular emphasis on their application in gene function prediction.
Tokenization Strategies for Single-Cell Data
Core Concept and Biological Analogy
Tokenization serves as the crucial bridge between biological measurements and computational analysis. In natural language processing (NLP), tokens represent words or subwords within sentences. By analogy, scFMs treat individual cells as "sentences" and genes or genomic features along with their expression values as "words" or "tokens" [4]. This framework allows models to learn the "language" of cells by exposing them to millions of cellular transcriptomes encompassing diverse tissues, states, and conditions. The primary challenge in single-cell tokenization stems from the non-sequential nature of gene expression data, unlike the inherent sequence in text, requiring researchers to impose meaningful structure for transformer-based model architectures [4].
Preprocessing and Input Representation
Before tokenization can occur, scRNA-seq data must undergo rigorous preprocessing to ensure quality and consistency:
- Quality Control: Filtering out low-quality cells and potential multiplets, particularly critical in droplet-based methods [20].
- Gene Filtering: Retaining genes expressed above minimum thresholds to reduce noise.
- Normalization: Applying specialized single-cell normalization techniques to account for varying sequencing depth, avoiding methods designed for bulk RNA-seq that can introduce errors [20].
- Batch Effect Consideration: Accounting for technical variations between experiments while preserving biological variation of interest [20].
Following preprocessing, the continuous, high-dimensional gene expression profiles must be converted into discrete tokens. A fundamental consideration is that gene expression data lacks inherent ordering, unlike words in a sentence [4]. To address this, several strategic approaches have been developed, each with distinct advantages for specific applications in gene function prediction.
Table 1: Comparison of Tokenization Strategies for Single-Cell Foundation Models
| Strategy | Core Methodology | Key Advantages | Considerations for Gene Function Prediction | Example Models |
|---|---|---|---|---|
| Gene Ranking | Genes ordered by expression level within each cell; top genes form sequence | Deterministic, captures most influential genes | May overlook lowly expressed functionally important genes | Geneformer [4], scBERT [19] |
| Value Categorization | Continuous expression values binned into discrete categories | Converts regression to classification problem | Loss of resolution for subtle expression differences | scGPT [19] |
| Value Projection | Gene expression vector projected and combined with positional/gene embedding | Preserves full resolution of expression data | Computationally intensive for very large datasets | scFoundation [19] |
| Multi-Modal Incorporation | Integration of gene metadata, batch information, or other omics data | Provides richer biological context | Increased complexity in token structure and processing | UCE [19] |
Protocol for Implementing Tokenization in Gene Function Prediction
Experimental Workflow and Design
The following protocol outlines a comprehensive procedure for implementing gene ranking tokenization, particularly suited for gene function prediction tasks using scFMs. This methodology has been validated through large-scale implementations in models such as CellFM, trained on 100 million human cells [19].
Reagent and Resource Requirements
Table 2: Essential Research Reagents and Computational Tools
| Item | Specification | Function/Purpose |
|---|---|---|
| Single-Cell Suspension | Highly viable cells from tissue of interest | Source of transcriptomic data |
| scRNA-seq Library Prep Kit | 10x Genomics 3' or similar platform | Generation of barcoded cDNA libraries |
| Sequence Alignment Tool | STAR, CellRanger, or scRNA-seq specialized aligners | Mapping reads to reference genome |
| Quality Control Software | FastQC, Seurat, or Scanpy | Assessing cell and gene quality metrics |
| Normalization Algorithm | scran, SCTransform, or specialized single-cell methods | Technical noise removal and count normalization |
| Tokenization Framework | Custom Python scripts implementing ranking logic | Conversion of expression matrix to token sequences |
| Foundation Model Architecture | Transformer-based (e.g., ERetNet, standard Transformer) | Learning representations for gene function prediction |
Sample Preparation and Sequencing
- Single-Cell Isolation: Extract viable single cells from tissue of interest using appropriate dissociation protocols. For tissues where dissociation is challenging (e.g., neuronal tissues), consider single-nucleus RNA-seq (snRNA-seq) as an alternative [20].
- Library Preparation: Perform scRNA-seq using preferred technology (e.g., droplet-based 10x Genomics, SMART-Seq2). Document all protocol parameters including amplification method (PCR or IVT) and transcript coverage (full-length vs. 3'/5' end) as these impact downstream tokenization [20].
- Sequencing: Execute high-throughput sequencing with sufficient depth to capture transcriptional diversity. For gene function prediction, deeper sequencing may be beneficial to detect lowly expressed transcription factors and regulatory genes.
Computational Processing and Tokenization
Diagram 1: Tokenization workflow for scRNA-seq data.
Primary Data Processing:
Expression Matrix Normalization:
- Apply specialized normalization methods designed for single-cell data to address varying sequencing depths while preserving biological heterogeneity.
- Avoid bulk RNA-seq normalization techniques that may introduce errors in single-cell data interpretation [20].
Tokenization Implementation:
- For each cell, rank all expressed genes by their normalized expression values in descending order.
- Select the top N genes (typically 1,000-2,000) based on expression magnitude to form the representative sequence for each cell.
- Convert each gene in the ranked list to a discrete token, typically represented as a unique integer identifier.
- Incorporate special tokens to represent cell-level metadata, batch information, or experimental conditions when available [4].
Positional Encoding:
- Apply positional encoding schemes to represent the relative ranking of each gene within the sequence, enabling the transformer architecture to utilize ordering information [4].
Advanced Tokenization Applications in Gene Function Prediction
Multi-Modal Tokenization for Enhanced Functional Insights
While basic gene ranking tokenization provides a solid foundation, advancing gene function prediction requires more sophisticated approaches that integrate diverse biological contexts:
- Gene Metadata Incorporation: Enhance token representations by including information about gene ontology terms, chromosome location, or protein domains to provide biological context that aids in functional annotation [4].
- Multi-Omic Integration: Develop specialized tokens for incorporating additional data modalities such as single-cell ATAC-seq (scATAC-seq) for chromatin accessibility, spatial transcriptomics for positional context, or proteomics data to create comprehensive cellular representations [4].
- Functional Prompt Engineering: Implement semantic design strategies where known functional gene contexts prompt the generation of novel gene sequences with related functions, facilitating discovery of genes with predicted functional relationships [5].
Case Study: CellFM Tokenization Implementation
CellFM, an 800-million parameter foundation model trained on 100 million human cells, implements a value projection-based tokenization strategy that preserves the full resolution of gene expression data [19]. In this approach:
- The gene expression vector is represented as the sum of a projection of the gene expression values and a positional or gene embedding.
- This method maintains continuous expression information rather than discretizing into bins or ranks, potentially capturing more subtle functional relationships.
- The model employs a modified RetNet framework with gated multi-head attention mechanisms to efficiently process the tokenized input while managing computational complexity [19].
Table 3: Performance Comparison of Tokenization Strategies in Gene Function Prediction
| Tokenization Method | Prediction Accuracy | Novel Function Discovery | Computational Efficiency | Data Requirements |
|---|---|---|---|---|
| Gene Ranking | Moderate to High | Limited | High | Standard |
| Value Categorization | High | Moderate | Moderate | Standard |
| Value Projection | Very High | High | Lower | Extensive |
| Multi-Modal Integration | Highest | Highest | Lowest | Extensive |
Discussion and Technical Considerations
Optimization Guidelines for Gene Function Prediction
Implementing effective tokenization for gene function prediction requires addressing several technical challenges:
- Batch Effect Management: Incorporate batch information as special tokens or employ statistical harmonization methods to reduce technical variation while preserving biologically relevant functional signals [4].
- Rare Cell Type Considerations: Adjust tokenization strategies for rare cell populations by implementing oversampling techniques or weighted ranking approaches to ensure adequate representation in training data.
- Cross-Species Generalization: When predicting gene functions across species, implement orthology-based token mapping to align gene tokens across different organisms.
- Interpretability: Develop attention visualization techniques to interpret which tokens (genes) most strongly influence functional predictions, providing biological validation of model decisions.
Validation and Quality Assessment
Rigorously validate tokenization implementations through the following quality metrics:
- Sequence Recovery Tests: Assess the model's ability to reconstruct known functional gene sequences from partial prompts, analogous to genomic "autocomplete" tasks [5].
- Functional Enrichment Analysis: Validate that embeddings derived from tokenized input show appropriate enrichment for known biological pathways and processes.
- Novelty Assessment: Quantify the entropy and variability of generated token sequences to ensure the model extends beyond mere memorization of training data [5].
Diagram 2: Tokenization integration in function prediction pipeline.
Tokenization represents a fundamental preprocessing step that transforms complex gene expression data into structured inputs accessible to single-cell foundation models. As research in gene function prediction advances, refined tokenization strategies that preserve biological nuance while enabling computational efficiency will be crucial. The protocols outlined herein provide a framework for implementing tokenization approaches optimized for extracting functional insights from single-cell transcriptomic data. Future directions will likely involve more sophisticated multi-modal tokenization, integration of prior biological knowledge directly into token representations, and adaptive tokenization strategies that dynamically optimize based on specific prediction tasks. Through continued refinement of these methodologies, tokenization will remain an essential component in the pipeline from raw sequencing data to biologically meaningful functional predictions, accelerating discovery in basic research and therapeutic development.
The development of robust single-cell foundation models (scFMs) is critically dependent on access to large-scale, high-quality, and biologically diverse datasets. These models, which treat cells as "sentences" and genes as "words," learn the fundamental language of biology through self-supervised pretraining on vast collections of single-cell transcriptomic data [4] [1]. The performance and generalizability of scFMs are directly influenced by the scope, quality, and diversity of their pretraining data. This application note provides a comprehensive overview of major public data sources essential for pretraining scFMs, with a specific focus on their application in gene function prediction research. We detail standardized protocols for data acquisition, processing, and integration to empower researchers and drug development professionals in constructing effective models for predicting gene function and cellular behavior.
The table below summarizes the key characteristics of major public data sources relevant for scFM pretraining, highlighting their unique contributions and scale.
Table 1: Major Public Data Sources for scFM Pretraining
| Database Name | Primary Focus & Description | Scale (Number of Cells) | Key Features for scFM Pretraining | Data Accessibility |
|---|---|---|---|---|
| CZ CELLxGENE Discover [21] | A comprehensive platform for exploring single-cell data, hosting a wide array of curated datasets. | >35 million cells (from portal); Platforms provide access to over 100 million standardized cells [4] [1]. | - Standardized data processing via Census [21].- Rich metadata and interactive Explorer tool.- Directly integrated into analysis workflows for differential expression and cell type annotation. | Web interface; Data available via AWS cloud; Python/R tools (Census) [21] [22]. |
| Human Cell Atlas (HCA) [22] | A global consortium aimed at creating comprehensive reference maps of all human cells. | Contributes to large-scale integrations (e.g., 58 million cells listed in one resource) [22]. | - Aims for complete coverage of human cell types and states.- Enforces strict metadata standards for data consistency.- Focus on healthy human tissues, providing a baseline for disease studies. | HCA Data Portal; Cloud-based storage and analysis platforms. |
| Arc Virtual Cell Atlas [23] | A newly released, massive resource integrating both observational and perturbational single-cell data. | ~300 million cells (combined from Tahoe-100M and scBaseCount) [23]. | - Includes Tahoe-100M, a perturbation atlas with 100M cells from 60,000 drug-cell interactions [23] [22].- scBaseCount provides 200M AI-curated cells from public data.- Uniquely combines natural cell states with drug perturbation responses. | Open source and freely accessible via Arc Institute's portal; Google Cloud Storage [23] [22]. |
| Single Cell Expression Atlas (SCEA) [22] [24] | A cross-species repository from EMBL-EBI providing uniformly processed single-cell RNA-seq data. | Varies; part of larger aggregated resources. | - Uniformly reprocesses data to facilitate cross-study comparisons.- Maps metadata to Experimental Factor Ontology (EFO) for enhanced integration.- Categorizes studies as "baseline" or "differential" for targeted queries. | Web interface; downloadable data matrices and raw data via FTP. |
| Gene Expression Omnibus (GEO) / SRA [4] [24] | NIH's primary archival repository for high-throughput functional genomics data. | Tens of millions of datasets available [4]. | - Largest and most diverse repository of primary data.- Essential for accessing the most recent studies not yet in curated portals.- Requires significant curation and processing effort due to heterogeneity. | Web interface; FASTQ and processed data files; often requires custom processing. |
| PanglaoDB [4] [22] | A curated database of mouse and human single-cell RNA-seq experiments. | Varies; incorporates data from over 1,300 experiments [24]. | - Includes pre-annotated cell-type markers, useful for validating gene functions.- User-friendly for exploring gene expression across cell types and studies. | Web interface; downloadable data as R objects or text files. |
Experimental Protocols for Data Utilization in Gene Function Prediction
Application: Building a large, diverse, and high-quality dataset for initial pretraining of an scFM from curated sources like CELLxGENE and the Arc Virtual Cell Atlas.
Materials and Reagents:
- Computational Resources: High-performance computing cluster or cloud computing environment (e.g., AWS, Google Cloud) with substantial CPU, RAM, and storage.
- Software/Tools: Python environment with data manipulation libraries (Pandas, NumPy), single-cell analysis tools (Scanpy, Seurat), and relevant API clients (e.g., CellxGene Census).
Procedure:
- Data Source Identification: Select databases that align with your research goals. For general-purpose human cell models, prioritize CZ CELLxGENE Discover and the HCA. For perturbation-focused models, the Arc Virtual Cell Atlas (Tahoe-100M) is indispensable [23] [22].
- Bulk Data Download: Utilize provided bulk download options and cloud APIs. For example, access CELLxGENE data via the
cellxgene-censusPython package, which streams data efficiently from the cloud without requiring full local downloads [21] [22]. - Data Harmonization: The data from curated sources like CELLxGENE Census and Arc scBaseCount are already uniformly processed. Verify that the gene identifiers are consistent across datasets (e.g., all using ENSEMBL IDs). Merge the
AnnDataobjects, treating each source as a separate "batch." - Quality Control (QC) and Filtering: Perform initial QC on the merged dataset. Standard filters include:
- Removing cells with an extreme number of detected genes (potential doublets) or high mitochondrial gene percentage (low viability).
- Filtering out genes detected in very few cells.
- Dataset Splitting: Partition the data into pretraining, validation, and hold-out test sets. Ensure the splits are stratified by tissue, cell type, or study to prevent data leakage and allow for robust evaluation of model generalizability.
Protocol 2: Data Preprocessing and Tokenization for scFMs
Application: Converting raw single-cell gene expression matrices into the tokenized sequences required by transformer-based scFMs.
Materials and Reagents:
- Input Data: A quality-controlled single-cell expression matrix (cells x genes).
- Software/Tools: scGPT or Geneformer codebases, which include implemented tokenizers.
Procedure:
- Normalization: Normalize the gene expression counts per cell to a standard scale (e.g., 10,000 counts per cell) and apply a logarithmic transformation (log1p) to stabilize variance.
- Gene Selection: Select a subset of highly variable genes (HVGs) for model input. This reduces computational complexity and focuses the model on biologically informative features. A common target is 5,000-20,000 genes.
- Tokenization: This is a critical step where continuous expression values are converted into discrete tokens for the model.
- Strategy 1 (Expression-based ranking): For each cell, rank the selected genes by their expression level. The input sequence is the ordered list of gene IDs from highest to lowest expression. The expression value itself can be incorporated as a separate "value embedding" [4] [1] [8].
- Strategy 2 (Binning): Bin gene expression values (e.g., no expression, low, medium, high) and create a combined token representing both the gene ID and its expression level bin [1].
- Sequence Assembly: Assemble the tokenized genes into a single sequence for each cell. Prepend special tokens to the sequence if supported by the model architecture, such as a
[CLS]token whose final embedding can represent the entire cell, or modality tokens for multi-omics data [1] [8].
The following diagram illustrates this multi-stage preprocessing and tokenization workflow.
The Scientist's Toolkit: Essential Research Reagents & Materials
Table 2: Essential Computational Tools for scFM Research
| Item Name | Type | Primary Function in scFM Workflow |
|---|---|---|
| Scanpy [25] [26] | Python Library | Provides a comprehensive toolkit for single-cell data analysis, including preprocessing, clustering, trajectory inference, and visualization. Essential for initial data QC and exploration. |
| Seurat [22] [8] | R Package | A widely used R package for single-cell genomics, offering similar functionality to Scanpy for QC, integration, and analysis. |
| CellxGene Census [21] [22] | API / Data Source | A Python API that provides efficient, cloud-native access to the massive, uniformly processed CZ CELLxGENE corpus, enabling scalable data loading. |
| scGPT / Geneformer [4] [1] [8] | Foundation Model | Pretrained scFMs that can be fine-tuned for specific downstream tasks like gene function prediction, perturbation response modeling, and cell type annotation. |
| AnnData Format [25] [22] | Data Format | A flexible file format (.h5ad) for storing single-cell data matrices alongside rich metadata, layers (e.g., normalized counts), and embeddings. The standard for interoperability in Python-based scFM workflows. |
| Transformer Architecture [4] [1] | Model Architecture | The neural network backbone of most scFMs. Its self-attention mechanism allows the model to learn complex, context-dependent relationships between genes. |
Workflow for Gene Function Prediction Using scFM Embeddings
Leveraging scFM embeddings for gene function prediction involves a structured pipeline from data preparation to functional validation. The following diagram maps the key stages of this process.
Workflow Description:
- Input: A pretrained single-cell foundation model, whose gene embeddings have been learned from diverse cellular contexts [4] [8].
- Extraction: Gene embeddings are extracted from the model's input layer. Each gene is represented as a high-dimensional vector that encapsulates its contextual function based on co-expression patterns across millions of cells [8].
- Analysis: The gene embedding space is analyzed to predict gene function. This can be done by:
- Similarity Search: Finding genes with embedding vectors similar to a gene of unknown function, implying functional relatedness.
- Supervised Prediction: Training a classifier on embeddings of well-annotated genes to predict Gene Ontology terms for unknown genes [8].
- Clustering: Identifying modules of co-functional genes based on embedding proximity.
- Validation: Predictions are validated against external knowledge bases like Gene Ontology and pathway databases (e.g., KEGG, Reactome) to assess accuracy and biological relevance [8].
The availability of large-scale, curated public data sources like CZ CELLxGENE, the Human Cell Atlas, and the Arc Virtual Cell Atlas has fundamentally transformed the landscape of single-cell computational biology. These resources provide the essential fuel for training the next generation of scFMs. By adhering to the standardized protocols for data acquisition, preprocessing, and tokenization outlined in this application note, researchers can construct robust models capable of unraveling the complex language of gene function. As these datasets continue to grow in size and diversity, and as models and benchmarking practices evolve [6] [8], the potential for scFMs to drive discoveries in basic biology and therapeutic development will only increase.
Interpreting Gene and Cell Embeddings as Functional Representations
Single-cell foundation models (scFMs) are large-scale deep learning models pretrained on vast datasets of single-cell omics data, capable of generating meaningful low-dimensional representations, or embeddings, of genes and cells [4]. These embeddings are foundational for gene function prediction, as they encode complex biological relationships in a structured latent space. The core premise is that the embedding space learned by scFMs captures functional biological relationships; genes with similar functions or involved in the same pathways are positioned proximally, while cells in similar states or types form distinct clusters [27] [8]. This structured representation provides a powerful, computable framework for extracting novel biological insights and forming testable hypotheses about gene function and cellular identity without relying solely on predefined annotations.
Methodologies for Accessing and Processing Embeddings
Extraction of Gene and Cell Embeddings
The first step in functional interpretation involves extracting the raw embedding vectors from a pretrained scFM. The protocol varies slightly depending on the model architecture but generally follows a consistent pattern.
For Gene Embeddings: Gene embeddings are typically accessed from the input layer (or first layer) of the transformer model. In most scFMs, each gene is associated with a unique identifier (e.g., Ensembl ID or gene symbol), and its initial representation is a combination of a static gene embedding and a dynamic value embedding that encodes its expression level in a given cell [8]. For functional analysis, the static gene embedding, which is expected to capture the gene's intrinsic functional properties across diverse cellular contexts, is the primary vector of interest. This matrix of gene embeddings can be directly extracted from the model's parameters after pretraining [8].
For Cell Embeddings: Cell embeddings are often derived from a special classification token (e.g., [CLS]) that is prepended to the input sequence of genes. The final hidden state corresponding to this token serves as a global representation of the entire cell's state [4]. Alternatively, some models generate cell embeddings by pooling (e.g., mean pooling) the final hidden states of all gene tokens for that cell [4].
Table 1: Common Embedding Extraction Points in Popular scFMs
| Model Name | Gene Embedding Source | Cell Embedding Source | Key Reference |
|---|---|---|---|
| scGPT | Input gene embedding layer | [CLS] token or mean pooling |
[8] |
| Geneformer | Input gene embedding layer | Final layer context | [8] |
| scBERT | Input gene embedding layer | [CLS] token |
[4] |
| UCE | Input gene embedding layer | Cell-specific output token | [8] |
Normalization and Dimensionality Reduction
Once extracted, raw embeddings often require preprocessing before biological interpretation.
- Normalization: Standard practice involves L2 normalization, which scales each embedding vector to have a unit norm. This ensures that similarity metrics (e.g., cosine similarity) are computed based on direction rather than magnitude, leading to more stable and biologically relevant comparisons.
- Dimensionality Reduction: The original embedding space is high-dimensional (e.g., 128 to 1024 dimensions). For visualization and qualitative assessment, researchers commonly apply techniques like Uniform Manifold Approximation and Projection (UMAP) or t-Distributed Stochastic Neighbor Embedding (t-SNE) to project the embeddings into 2D or 3D space [27] [28]. This allows for visual inspection of clusters of genes or cells.
The following diagram illustrates the complete workflow from single-cell data to functional interpretation of embeddings.
Workflow for Interpreting scFM Embeddings
Experimental Protocols for Functional Interpretation
Protocol 1: Gene-Gene Similarity and Functional Clustering
This protocol assesses whether the gene embedding space captures known biological relationships by measuring the similarity between genes.
- Input: A set of gene embeddings for all genes of interest (e.g., ~20,000 protein-coding genes).
- Similarity Calculation: Compute the pairwise cosine similarity between all gene embeddings to create a gene-gene similarity matrix. Cosine similarity is preferred as it measures the angular difference, aligning with the intuition of comparing functional "direction."
- Validation against Ground Truth:
- Gene Ontology (GO) Analysis: For a query gene (e.g., IL7R), retrieve its top k most similar genes (nearest neighbors) based on cosine similarity. Perform GO enrichment analysis (using tools like Enrichr or clusterProfiler) on this gene set. A successful prediction is indicated by significant enrichment (False Discovery Rate (FDR) < 0.05) of the query gene's known biological processes [8].
- Protein-Protein Interaction (PPI) Validation: Check if the top similar genes are known interactors in PPI databases (e.g., STRING). Statistical significance can be evaluated using permutation tests.
- Quantitative Metric: Calculate the Area Under the Precision-Recall Curve (AUPRC) for recovering known gene-gene functional relationships from a reference database against random chance.
Table 2: Example Output from Gene-Gene Similarity Analysis for IL7R
| Rank | Gene Symbol | Cosine Similarity | Known Functional Link to IL7R |
|---|---|---|---|
| 1 | CD3D | 0.92 | T-cell receptor complex, co-expression |
| 2 | CD3E | 0.91 | T-cell receptor complex, co-expression |
| 3 | CD8B | 0.89 | T-cell marker, shared immune function |
| 4 | CCR7 | 0.87 | T-cell homing and activation |
| 5 | SELL (L-selectin) | 0.85 | T-cell adhesion and migration |
Protocol 2: Clustering-Free Marker Gene Discovery
This protocol uses the cell-gene co-embedding space to identify cell-type-specific marker genes without pre-defined clustering.
- Input: A co-embedding of cells and genes from a model like SIMBA, where both cell nodes and gene nodes reside in the same latent space [27].
- Query Execution:
- With Known Cell Labels: For a group of cells (e.g., CD8+ T-cells), identify the closest gene neighbors in the embedding space. The most proximate genes are strong candidates for marker genes for that cell type [27].
- Without Known Labels: Use metrics like the Gini index to calculate the imbalance of a gene's proximity to all cells. A high Gini index indicates that a gene is specifically close to a small subset of cells, suggesting it is a cell-type-specific marker rather than a universally expressed "housekeeping" gene [27].
- Validation: Compare the discovered markers against known marker databases from literature or the Cell Marker database. Use metrics like precision@k to quantify performance.
Protocol 3: Gene Embedding for Functional Annotation of Novel Genes
This protocol outlines a strategy for predicting the function of poorly characterized or novel genes.
- Input: Gene embeddings for all genes, including the novel gene (e.g., GENEX).
- Nearest Neighbor Retrieval: Find the top k (e.g., 50) most similar genes to GENEX in the embedding space based on cosine similarity.
- Functional Imputation: Perform functional enrichment analysis (GO, KEGG pathways) on the set of nearest neighbor genes. The significantly enriched terms are the predicted functions for GENEX.
- Confidence Scoring: Assign a confidence score to the prediction based on the functional coherence (e.g., the enrichment FDR and the average similarity) of the neighbor gene set.
The Scientist's Toolkit: Research Reagent Solutions
Table 3: Essential Tools and Resources for scFM Embedding Analysis
| Tool/Resource | Type | Function in Analysis | Reference/URL |
|---|---|---|---|
| CELLxGENE | Data Repository | Provides access to millions of curated, annotated single-cell datasets for model pretraining and validation. | [4] |
| Scanpy | Python Toolkit | A versatile library for general single-cell data analysis, often used for preprocessing data before embedding extraction and for downstream UMAP/t-SNE visualization. | [27] |
| PyTorch-BigGraph | Graph Embedding Framework | A scalable framework used by models like SIMBA for efficiently generating co-embeddings of millions of cells and features. | [27] |
| Enrichr / clusterProfiler | Functional Enrichment Tool | Web-based and R-based tools, respectively, for performing Gene Ontology and pathway enrichment analysis on gene sets derived from embedding queries. | [8] |
| scFMs (e.g., scGPT, Geneformer) | Pretrained Models | Provide the core gene and cell embeddings for functional analysis. They are the primary "reagent" for this research. | [8] |
Visualization and Quantitative Validation of Embeddings
Effective interpretation relies on robust quantitative and visual methods to validate the biological signals within embeddings.
Visual Inspection: A UMAP projection of gene embeddings should show clustering of genes from the same pathway or functional category. For example, genes involved in oxidative phosphorylation should form a distinct cluster separate from genes involved in ribosome biogenesis [8]. Similarly, a co-embedding of cells and genes should place known marker genes (e.g., IL7R for CD4+ T-cells) spatially close to the cell type they define [27].
Ontology-Informed Metrics: Beyond standard clustering metrics, novel evaluation metrics like scGraph-OntoRWR measure the consistency of cell type relationships captured by scFMs with prior biological knowledge encoded in cell ontologies [8]. Another metric, the Lowest Common Ancestor Distance (LCAD), assesses the severity of errors in cell type annotation by measuring the ontological proximity between misclassified cell types, providing a more biologically grounded assessment than simple accuracy [8].
The following diagram illustrates the relationship between the embedding space and the final biological interpretation, highlighting the key validation steps.
From Embeddings to Biological Insight
From Embeddings to Insights: Practical Workflows for Gene Function Prediction
Extracting and Utilizing Gene-Level Embeddings for Functional Analysis
Single-cell foundation models (scFMs) are large-scale deep learning models pretrained on vast datasets of single-cell omics data, capable of being adapted to a wide range of downstream biological tasks [1] [4]. A core component of their architecture is the learning of gene-level embeddings—vector representations that capture functional, regulatory, and contextual information about genes based on their expression patterns across millions of cells [29] [8]. These embeddings are learned in a self-supervised manner, typically by training the model on tasks such as masked gene modeling, where the model must predict randomly masked genes based on the context of other genes in the cell [1]. The premise is that by being exposed to a immense diversity of cellular states and conditions, the model internalizes fundamental principles of gene function and interaction [1] [4]. The resulting gene embeddings provide a powerful, compact representation that can be leveraged for various functional analysis tasks, moving beyond traditional methods that rely on pre-defined gene sets or annotations.
Source Models and Embedding Extraction Protocols
Several prominent scFMs provide the functionality to extract gene-level embeddings. These models differ in their pretraining data, architectural details, and the specific nature of the embeddings they produce. The following table summarizes key models used for this purpose.
Table 1: Single-Cell Foundation Models for Gene Embedding Extraction
| Model Name | Omics Modalities | Embedding Dimensionality | Key Feature of Embedding Strategy |
|---|---|---|---|
| Geneformer [29] | scRNA-seq | 256 or 512 | Lookup table embedding; genes are ranked by expression for input. |
| scGPT [29] | scRNA-seq, scATAC-seq, Multiome | 512 | Lookup table embedding with value binning for expression levels. |
| UCE [29] | scRNA-seq | 1280 | Uses protein embeddings from ESM-2, integrating protein sequence information. |
| scFoundation [29] | scRNA-seq | 3072 | Lookup table embedding; trained on a fixed set of ~19,000 genes. |
| scBERT [30] | scRNA-seq | 512 | An early encoder-based model for single-cell transcriptomes. |
Technical Protocol: Extracting Embeddings
The process of extracting gene embeddings is model-specific but generally follows a common workflow. The protocol below outlines the key steps, with specific examples for leading models.
Protocol 1: Gene Embedding Extraction Workflow
Step 1: Model Selection and Setup
- Select an scFM based on the task and compatibility with your data. For general gene function prediction, Geneformer and scGPT are strong starting points [30].
- Install the required software packages and download the pretrained model weights. Frameworks like BioLLM can provide a unified interface for multiple models, reducing coding heterogeneity [30].
Step 2: Data Preprocessing and Tokenization
- Format Input Data: Prepare your single-cell RNA-seq data as a gene-cell count matrix, preferably normalized.
- Gene Filtering and Ordering:
- For Geneformer, filter the gene matrix to the model's predefined vocabulary (2,048 genes). Within each cell, rank these genes by expression level and select the top 2,048 (or a user-defined number) to form the input "sentence" [29].
- For scGPT, a common approach is to use 1,200 highly variable genes (HVGs). The expression value for each gene is often transformed, for example, by binning into discrete levels [29].
- Tokenization: The model converts each gene symbol (and sometimes its expression value) into a numerical token. This token is then mapped to a dense vector in the model's embedding layer.
Step 3: Embedding Extraction
- Forward Pass: Pass the tokenized input for a cell or a batch of cells through the model's encoder.
- Extract Hidden States: The gene embeddings are typically the output of the model's initial embedding layer or the hidden states from the first transformer layer. These are the model's internal representations before extensive contextual processing.
- In Geneformer, access the
embeddingsattribute of the model'sgene_embeddingslayer. - In scGPT, the
gitensor (gene embeddings) can be extracted from the model'sencoderlayer.
- In Geneformer, access the
- Aggregation (Optional): To get a single, context-aware embedding per gene across a population of cells (e.g., a specific cell type), average the embeddings for that gene extracted from all relevant cells.
Quantitative Performance and Benchmarking
Benchmarking Framework for Gene Embedding Quality
The utility of gene embeddings is validated by their performance on biologically meaningful tasks. Benchmarking studies have employed several metrics to evaluate how well the embeddings capture known biological relationships [29] [8].
Table 2: Performance of scFMs on Gene-Level Functional Tasks
| Model | Tissue Specificity Prediction (AUROC) | GO Term Prediction (AUROC) | Notable Strengths |
|---|---|---|---|
| Geneformer | 0.72 - 0.85 | 0.70 - 0.82 | Strong performance on gene-level tasks, effective pretraining [30]. |
| scGPT | 0.75 - 0.87 | 0.72 - 0.84 | Robust across tasks, benefits from multi-omic pretraining capacity [29] [30]. |
| UCE | 0.70 - 0.83 | 0.68 - 0.81 | Integrates protein sequence information via ESM-2 [29]. |
| scFoundation | 0.74 - 0.86 | 0.71 - 0.83 | Strong on gene-level tasks, trained on a large fixed gene set [30]. |
| scBERT | < 0.70 | < 0.68 | Lags behind, likely due to smaller model size and training data [30]. |
| Baseline (FRoGS) | 0.68 - 0.80 | 0.65 - 0.78 | A dedicated method for learning functional gene signatures [8]. |
Note: Performance ranges are approximate and synthesized from benchmark results, which vary based on the specific dataset and evaluation setup. scFMs generally perform on par with or exceed the dedicated FRoGS baseline [8].
Key Evaluation Metrics:
- Tissue Specificity Prediction: Evaluates whether the embedding of a gene can predict the tissue(s) in which it is highly expressed. This tests if the embedding captures the fundamental expression context of the gene [8].
- Gene Ontology (GO) Term Prediction: Assesses if the embeddings can predict a gene's functional annotations from the GO database. Genes with similar functions should have similar embeddings [8]. The performance is typically measured using the Area Under the Receiver Operating Characteristic curve (AUROC).
- scGraph-OntoRWR: A novel metric that measures the consistency of gene and cell type relationships captured by the embeddings with prior biological knowledge encoded in ontologies [29] [8].
Application Protocols for Functional Analysis
Protocol for Gene Function Prediction
This protocol uses gene embeddings to predict novel gene functions or validate known ones.
Step 1: Construct a Functional Gene Network
- Extract gene embeddings for all genes in your dataset or a gene set of interest.
- Calculate pairwise cosine similarities between all gene embedding vectors.
- Build a gene functional network where nodes are genes and edges are weighted by the cosine similarity (or another distance metric like Euclidean distance).
Step 2: Leverage the Network for Prediction
- Guilt-by-Association: For a gene with unknown function, examine its nearest neighbors in the embedding space (genes with the highest similarity). The functional annotations of these neighbors are strong candidates for the unknown gene's function.
- Cluster Analysis: Perform community detection or clustering on the gene network (e.g., using Louvain method). Genes within the same cluster are likely to be involved in related biological processes.
Step 3: Validation
- Compare your predictions against held-out GO annotations or recently published literature.
- Use enrichment analysis tools to determine if the genes in a predicted cluster are significantly enriched for specific biological pathways.
Protocol for Gene Perturbation Effect Prediction
A critical application is predicting the transcriptomic outcome of genetic perturbations (e.g., gene knockout or overexpression). It is vital to note that recent rigorous benchmarks have shown that current scFMs do not outperform simple linear baselines on this task [6]. The following protocol should be applied with this critical caveat in mind.
Protocol 2: Workflow for Perturbation Prediction via Embeddings
Steps:
- Input a wild-type cell's gene expression profile into the scFM and extract the contextual gene embeddings.
- Represent the perturbation. For a gene knockout, a common approach is to mask (e.g., set to zero) the embedding of the target gene.
- Use a decoder (either the scFM's own or a separate linear model) to map the modified embeddings back to a predicted gene expression profile.
- Compare the prediction to the ground-truth expression from a real perturbation experiment.
- Critical Benchmarking: Due to the findings of Luecken et al. [6], it is essential to compare your model's predictions against simple baselines. The two key baselines are:
- The 'additive' model: Predicts the sum of the individual logarithmic fold changes for single perturbations.
- The 'no change' model: Always predicts the same expression as in the control condition.
- Current Limitations: As of 2025, foundation models have not consistently surpassed these baselines in predicting genetic interactions or effects of unseen perturbations, indicating that generalizable representation of perturbation outcomes remains a major challenge [6].
The Scientist's Toolkit
Table 3: Essential Research Reagents and Computational Tools
| Item / Resource | Type | Function / Application | Example / Source |
|---|---|---|---|
| Pretrained scFMs | Software | Provides pre-learned gene embeddings from massive datasets; base for transfer learning. | Geneformer, scGPT, scFoundation [29] |
| BioLLM Framework | Software | Unified Python API for multiple scFMs; standardizes access and evaluation. | [30] |
| CellxGene Database | Data | Curated source of millions of single-cell datasets for pretraining and validation. | CZ CELLxGENE [1] [4] |
| Gene Ontology (GO) | Knowledge Base | Gold-standard set of functional terms for validating embedding quality. | GeneOntology Consortium |
| Perturbation Datasets | Data | Ground-truth data for benchmarking prediction of knockout/overexpression effects. | Norman et al., Replogle et al. datasets [6] |
| Functional Gene Sets | Data | Curated lists of genes involved in specific pathways; for enrichment tests. | MSigDB, KEGG, Reactome |
Gene-level embeddings from single-cell foundation models offer a powerful and compact representation for deciphering gene function. Standardized protocols for their extraction and application, particularly in function prediction and network analysis, show significant promise. However, the field is in a state of rapid and critical evolution. Benchmarks reveal that no single model is universally superior, and performance is highly task-dependent [29] [8]. Most notably, claims of emergent capabilities in complex areas like perturbation prediction require rigorous validation against simple baselines, as they have not yet proven to be consistently superior [6]. Future progress will depend on more biologically grounded training objectives, improved model architectures that better capture genetic interactions, and the development of standardized benchmarking frameworks like BioLLM that enable fair comparison and guide researchers to the right tool for their specific biological question.
Predicting the Impact of Genetic Variants on Gene Regulation
Understanding how genetic variants influence gene regulation is a cornerstone of modern functional genomics and precision medicine. While genome-wide association studies (GWAS) have successfully identified that over 88% of disease-associated variants lie in non-coding regions, deciphering their functional impact remains a significant challenge [31]. These regulatory variants can disrupt crucial elements such as enhancers, transcription factor binding sites, and other functional sequences, leading to altered gene expression and potentially causing disease [31]. The field has responded by developing diverse computational methods, including deep learning and foundation models, which promise to predict the effects of these variants. However, independent benchmarking reveals a more nuanced picture, showing that these complex models do not always outperform simpler linear baselines [6]. This application note provides a structured overview of current methods, their performance, and detailed protocols for researchers aiming to predict the regulatory potential of genetic variants, with a specific focus on the context of single-cell foundation model (scFM) embeddings.
Current State of Computational Methods
Types of Predictive Models
Computational approaches for predicting variant impact can be broadly categorized. Sequence-oriented models, such as SVEN and Enformer, attempt to learn regulatory codes directly from DNA sequences using deep learning. They are particularly valuable for interpreting both small variants and large structural variants (SVs) in poorly annotated genomic regions [32]. In contrast, gene regulatory network (GRN)-based models, like CellOracle and ConSReg, integrate prior knowledge—such as transcription factor binding data and chromatin accessibility—to forecast expression changes from regulator activities [33] [34]. More recently, single-cell foundation models (e.g., scGPT, scFoundation, Geneformer) have emerged. These are pre-trained on massive single-cell transcriptomics datasets and can be fine-tuned to predict perturbation outcomes [6].
Table 1: Key Computational Methods for Predicting Variant Impact
| Method Name | Model Type | Key Input Features | Reported Strengths |
|---|---|---|---|
| SVEN [32] | Hybrid (Neural Networks + Gradient Boosting) | DNA sequence, TF binding, histone modifications, DNA accessibility | Accurate tissue-specific expression prediction (Spearman R=0.892) and SV effect quantification (Spearman R=0.921) |
| ConSReg [34] | Supervised Machine Learning | Expression data, TF-DNA binding (e.g., DAP-seq), open chromatin (e.g., ATAC-seq) | Identifies condition-specific regulatory genes (auROC=0.84); integration of ATAC-seq data improves performance |
| GGRN/PEREGGRN [33] | Supervised Machine Learning / Benchmarking Suite | Gene expression, user-provided network structures | Modular framework for benchmarking expression forecasting on unseen genetic perturbations across 11 datasets |
| scGPT / scFoundation [6] | Single-Cell Foundation Model | Single-cell RNA-seq data | Pre-trained representations of cellular states; can be fine-tuned for perturbation prediction |
Performance Benchmarks and a Reality Check
Independent benchmarking is crucial for evaluating the true performance of these models. A landmark 2025 study compared five foundation models and two other deep learning models against simple baselines for predicting transcriptome changes after single or double gene perturbations [6]. The results were sobering: no deep learning model consistently outperformed deliberately simple baselines, such as an 'additive model' (summing individual logarithmic fold changes) or a 'mean prediction' (always predicting the average expression) [6]. Furthermore, the models struggled to accurately predict genetic interactions (e.g., buffering or synergy), with most performing no better than a 'no change' baseline [6].
Similar findings were reported by the PEREGGRN benchmarking platform, which found it "uncommon for expression forecasting methods to outperform simple baselines" when predicting outcomes for entirely unseen perturbation conditions [33]. This highlights the critical importance of rigorous, independent benchmarking and suggests that the goal of a generalizable foundation model for predicting novel biological experiments remains elusive [6].
Detailed Experimental Protocols
Protocol 1: Predicting the Impact of a Structural Variant with a Hybrid Model
This protocol outlines the steps for using a sequence-oriented model like SVEN to quantify the tissue-specific impact of a structural variant (SV) [32].
1. Input Data Preparation:
- Variant Information: Obtain the genomic coordinates (chromosome, start, end) and type (e.g., deletion, duplication) of the SV.
- Target Gene(s): Identify the gene(s) whose expression might be affected, typically those within 1 megabase of the SV. The transcription start site (TSS) is used as the anchor.
- Reference Genome: Have the relevant reference genome sequence (e.g., GRCh38) available.
- Tissue/Context Selection: Select the target tissue or cell line from the model's supported options (e.g., SVEN supports over 350 contexts).
2. In Silico Prediction Execution:
- Sequence Retrieval: Extract the reference sequence centered on the TSS of the target gene(s) with a context window (e.g., ~50 kbp).
- Sequence Alteration: Engineer the alternate sequence by introducing the SV (e.g., deleting the sequence span for a deletion).
- Model Inference:
- Run both the reference and alternate sequences through the model's regulatory-specific neural networks to predict functional genomic signals (e.g., TF binding, chromatin accessibility).
- Feed these signals into the tissue-specific gradient-boosting tree to predict the expression level for both sequences.
- Impact Quantification: Calculate the predicted effect, typically as a log2 fold change (log2FC) in expression:
log2(Predicted Expression_alt / Predicted Expression_ref).
3. Output Interpretation and Validation:
- Effect Magnitude: A |log2FC| > 1 is often considered a strong effect.
- Experimental Validation: Design CRISPR-based assays to delete the SV region in the relevant cell line (e.g., HepG2 for liver) and measure the target gene's expression via qPCR or RNA-seq, comparing to a wild-type control [32].
The workflow for this protocol is summarized in the following diagram:
Protocol 2: Benchmarking a scFM for Perturbation Prediction
This protocol describes how to benchmark a single-cell foundation model against simple baselines for predicting the effect of unseen genetic perturbations, based on the methodology of Heidari et al. (2025) [6].
1. Data Acquisition and Preprocessing:
- Dataset Selection: Obtain a publicly available single-cell perturbation dataset (e.g., from Norman et al. or Replogle et al. [6]). The data should include single and/or double perturbation experiments with a control.
- Data Splitting: Split the perturbation conditions (e.g., 100 single gene perturbations), not cells, into training and test sets. No perturbation condition in the test set should be in the training set.
- Pseudobulk Creation: For each perturbation condition, create a pseudobulk expression profile by aggregating counts across cells.
2. Model Setup and Training:
- Foundation Model Fine-Tuning: Follow the author's guidelines to fine-tune the chosen scFM (e.g., scGPT) on the training set perturbations.
- Linear Baseline Model:
- Create a gene embedding matrix
G(K-dimensional) and a perturbation embedding matrixP(L-dimensional). These can be derived from the training data via dimension reduction or from the scFM's pretrained embeddings. - Solve for the matrix
Win:Y_train ≈ G * W * P^T + b, wherebis the mean expression vector [6].
- Create a gene embedding matrix
- "Mean" Baseline: Compute the vector
b, which is the mean expression across all training perturbations.
3. Prediction and Evaluation:
- Generate Predictions: For each held-out test perturbation, generate expression predictions using the fine-tuned scFM, the linear model, and the "mean" baseline.
- Performance Metrics: Calculate the L2 distance (or other metrics like Pearson correlation) between predicted and observed expression values, focusing on the top 1,000 most highly expressed or differentially expressed genes.
- Performance Comparison: Compare the error metrics of the scFM against the two baselines. The benchmark is considered successful if the scFM consistently outperforms the simpler models.
The logical relationship of this benchmarking protocol is as follows:
The Scientist's Toolkit: Research Reagent Solutions
Table 2: Essential Research Reagents and Resources for Variant Impact Prediction
| Reagent/Resource | Type | Function in Analysis | Example/Source |
|---|---|---|---|
| Reference Genome | Genomic Sequence | Provides the baseline DNA sequence for comparison and in silico manipulation. | GRCh38/hg38 from GENCODE |
| Functional Genomic Annotations | Data Repository | Provides cell-type-specific signals of regulatory activity used for model training and feature generation. | ENCODE (TF ChIP-seq, ATAC-seq, histone marks) [32] [31] |
| Perturbation Transcriptomics Datasets | Benchmarking Data | Used to train and benchmark models on real perturbation outcomes. | Norman et al., Replogle et al. datasets [6] |
| Transcription Factor Binding Data | Data Repository (e.g., from DAP-seq) | Informs prior knowledge of potential regulator-target relationships for GRN-based models. | Plant TFDB (for plants); DAP-seq data [34] |
| Pre-trained Model Embeddings | Computational Resource | Gene or cell embeddings from foundation models (e.g., scGPT) can be used as features in simpler, more robust linear models. | Extracted from scFoundation or scGPT [6] |
| CRISPR-Cas9 System | Experimental Validation Tool | Used to create isogenic cell lines with the variant of interest for functional validation of predictions. | Guide RNAs, Cas9 enzyme, transfection reagents [32] [31] |
Predicting the impact of non-coding genetic variants is a complex but essential endeavor. While sophisticated deep-learning and foundation models show great promise, researchers must engage with them critically. Current benchmarking indicates that simpler models can provide surprisingly strong baselines, and the integration of pre-trained scFM embeddings into these simpler frameworks may offer a more reliable and interpretable path forward [6]. Success in this field will depend on the rigorous use of standardized benchmarking platforms like PEREGGRN [33], the careful selection of models and baselines, and the systematic experimental validation of computational predictions. By adhering to detailed protocols and maintaining a critical perspective on model performance, researchers can effectively leverage these powerful tools to unravel the regulatory logic of the genome.
The ability to accurately forecast transcriptional responses to genetic, chemical, and environmental perturbations represents a cornerstone of modern biological discovery and therapeutic development. Traditional experimental approaches for mapping these responses are limited by tremendous costs, throughput constraints, and the sheer scale of possible perturbation-context combinations. The emergence of sophisticated in silico models, particularly those leveraging single-cell foundation model (scFM) embeddings, has begun to transform this landscape by enabling quantitative predictions of transcriptional outcomes across diverse biological contexts [4].
Single-cell foundation models, pretrained on vast collections of single-cell genomics data, learn fundamental principles of cellular state and function that can be transferred to perturbation forecasting tasks [4]. These models treat cells as sentences and genes as words, allowing them to decipher the "language" of cellular responses through transformer-based architectures [4]. When integrated into perturbation modeling frameworks, scFM embeddings provide rich, contextualized representations of the unperturbed cellular state that significantly enhance the accuracy of predicting post-perturbation transcriptional profiles.
This Application Note outlines current methodologies, experimental protocols, and computational frameworks that leverage scFM embeddings to forecast transcriptional responses, with particular emphasis on their application in drug discovery and functional genomics.
Key Computational Models and Performance
Several architectural paradigms have emerged for perturbation forecasting, each with distinct approaches to incorporating scFM embeddings and handling diverse perturbation types:
Large Perturbation Models (LPMs) employ a disentangled architecture that represents perturbation (P), readout (R), and context (C) as separate conditioning variables [35]. This P-R-C disentanglement enables LPMs to integrate heterogeneous perturbation experiments across diverse readouts (transcriptomics, viability), perturbations (CRISPR, chemical), and experimental contexts (single-cell, bulk) without requiring dataset shape or format alignment [35]. The decoder-only design learns perturbation-response rules disentangled from the specific context in which readouts were observed.
PRnet implements a perturbation-conditioned deep generative model with a specialized encoder-decoder architecture comprising three components: a Perturb-adapter that encodes compound structures from SMILES strings, a Perturb-encoder that maps chemical effects on unperturbed states into an interpretable latent space, and a Perturb-decoder that estimates the distribution of transcriptional responses [36]. This model conditions on scFM-derived cellular state representations to predict responses to novel chemical perturbations never experimentally profiled.
scFM-Based Baselines include models like Geneformer and scGPT, which use transformer-based encoders pretrained on large collections of transcriptomics data to infer gene and cell representations [35] [4]. These foundation models can be fine-tuned for specific perturbation prediction tasks, though they face limitations when handling diverse perturbation and readout modalities beyond transcriptomics [35].
Quantitative Performance Comparison
Table 1: Comparative Performance of Perturbation Forecasting Models
| Model | Architecture | Perturbation Types Supported | Key Performance Metrics | Limitations |
|---|---|---|---|---|
| LPM [35] | PRC-disentangled decoder | Genetic (CRISPR), chemical | State-of-the-art in predicting unseen perturbation transcriptomes; identifies shared molecular mechanisms | Cannot predict effects for out-of-vocabulary contexts |
| PRnet [36] | Perturbation-conditioned generative model | Chemical compounds | Outperforms alternatives in novel compound, pathway, and cell line response prediction | Primarily focused on chemical perturbations |
| Geneformer [35] | Transformer encoder | Genetic | Effective for transcriptomics data; transferable cell representations | Limited to transcriptomics data; lower signal-to-noise ratio |
| scGPT [35] [4] | Transformer encoder | Genetic | Captures gene-gene relationships; cell state representations | Performance challenges with diverse readout modalities |
| CPA [35] | Autoencoder-based | Chemical, genetic combinations | Predicts unseen perturbation combinations and drug dosages | Requires single-cell-resolved data |
| GEARS [35] | Graph-enhanced simulator | Genetic | Predicts unseen genetic perturbations; identifies genetic interaction subtypes | Relies on accurate prior knowledge graphs |
Table 2: Experimental Validation Results for Selected Models
| Model | Validation Context | Performance Outcome | Experimental Confirmation |
|---|---|---|---|
| LPM [35] | Transcriptome prediction for unseen perturbations | Consistently outperformed state-of-the-art baselines across experimental settings | Applied to identify potential therapeutics for autosomal dominant polycystic kidney disease |
| PRnet [36] | Novel compound screening | Identified and validated novel bioactive compounds against SCLC and CRC | Candidate compounds showed activity against cancer cell lines at predicted concentrations |
| LPM [35] | Cross-modal mechanism identification | Pharmacological inhibitors clustered with genetic CRISPR interventions targeting same genes | Anomalous compound placements reflected known off-target activities |
| PRnet [36] | Disease-specific drug screening | Recommended drug candidates for 233 diseases using gene signature matching | Literature support for predictions in metabolic disorders (NASH, PCOS, IBD) |
Experimental Protocols and Methodologies
Protocol 1: Predicting Transcriptional Responses to Novel Chemical Perturbations Using PRnet
Purpose: To predict single-cell transcriptional responses to novel chemical compounds not present in training data.
Primary Applications: Drug candidate screening, mechanism of action identification, and toxicity prediction.
Workflow:
Step-by-Step Procedure:
Input Preparation:
- Encode novel compound structure using Simplified Molecular Input Line Entry System (SMILES) strings [36].
- Process SMILES with RDKit to generate Functional-Class Fingerprints (FCFPs) that capture functional topology information [36].
- Scale FCFPs by compound dosage and sum to generate rescaled FCFP (rFCFP) embeddings.
- Obtain unperturbed transcriptional profile (single-cell or bulk RNA-seq) of target cell type, preferably represented as scFM embeddings [4].
Perturb-adapter Processing:
- Encode rFCFP embedding to an additive latent embedding (z^p) using the Perturb-adapter module.
- This step enables generalization to novel compounds without prior experimental data [36].
Perturb-encoder Execution:
- Map the chemical perturbation effect on the unperturbed state (x^u) into an interpretable latent space (z^l) using the Perturb-encoder.
- This step integrates the cellular context with perturbation information [36].
Perturb-decoder Operation:
- Estimate the distribution of transcriptional response N(x|μ,σ²) conditioned on the chemical perturbation effect (z^l), the applied perturbation (z^p), and stochastic noise (z^n).
- Perform conditioned sampling to generate specific transcriptional profiles (x̂) with biological and chemical contexts [36].
Output Interpretation:
- For bulk data: Transform predicted responses of 978 landmark genes to 12,328 genes via linear transformation.
- For single-cell data: Analyze predicted expression values for 5,000 highly variable genes (HVGs).
- Identify significantly up-regulated and down-regulated genes and pathways.
Troubleshooting Tips:
- If prediction quality is poor for specific compound classes, ensure adequate representation of similar structural motifs in training data.
- For cell-type-specific inaccuracies, verify that unperturbed profiles accurately represent the target cellular context.
- Address high variance in predictions by increasing the number of samples generated from the estimated distribution.
Protocol 2: Cross-Modal Perturbation Integration Using Large Perturbation Models
Purpose: To integrate heterogeneous perturbation data and identify shared molecular mechanisms across perturbation types.
Primary Applications: Drug-target interaction mapping, mechanism of action identification, and gene network inference.
Workflow:
Step-by-Step Procedure:
Data Integration:
- Compile diverse perturbation datasets encompassing genetic (CRISPR) and pharmacological perturbations across multiple experimental contexts [35].
- Standardize data representation using the P-R-C (perturbation, readout, context) tuple format.
- For genetic perturbations, incorporate gene embeddings from biological databases (STRING, Reactome) or scFM-derived representations [35].
LPM Training:
- Train LPM using all available integrated data to predict perturbation outcomes based on symbolic P-R-C representations.
- Employ disentangled architecture to separately model perturbation, readout, and context dimensions [35].
- Validate model performance on held-out experiments to ensure robust integration.
Cross-Modal Embedding Analysis:
- Extract perturbation embeddings from the trained LPM.
- Apply dimensionality reduction (t-SNE, UMAP) to visualize the unified perturbation space [35].
- Identify clusters where pharmacological inhibitors of molecular targets co-localize with genetic interventions targeting the same genes.
Anomaly Detection and Validation:
- Flag compounds placed distant from their putative targets as potential candidates for off-target effects [35].
- Investigate clinical literature to validate predicted anomalous activities (e.g., benfluorex cardiovascular effects, pravastatin anti-inflammatory mechanisms) [35].
- Quantitatively evaluate known inhibitor-target relationships using embedding space distances.
Troubleshooting Tips:
- If integration fails for specific data types, ensure proper representation of all perturbation modalities in training data.
- Address embedding space distortions by normalizing across experimental contexts and readout modalities.
- For poor cross-modal predictions, verify that the model has sufficient examples of both genetic and chemical perturbations targeting similar pathways.
The Scientist's Toolkit: Essential Research Reagents and Computational Solutions
Table 3: Key Research Reagent Solutions for Perturbation Forecasting
| Category | Resource | Function | Application Context |
|---|---|---|---|
| Data Resources | CZ CELLxGENE [4] | Provides unified access to annotated single-cell datasets (>100M cells) | scFM pretraining and validation |
| LINCS [35] | Repository of genetic and pharmacological perturbation data | Cross-modal perturbation integration | |
| HMP2/iHMP [37] | Integrated human microbiome multiomics data | Microbial community function prediction | |
| Computational Tools | scGPT [4] | Transformer-based foundation model for single-cell biology | Cell and gene representation learning |
| Geneformer [35] | Pretrained transformer model on transcriptomics data | Cellular context embedding | |
| FUGAsseM [37] | Function prediction for uncharacterized gene products | Microbial protein function annotation | |
| Chemical Informatics | RDKit [36] | Cheminformatics toolkit for compound structure analysis | SMILES processing and fingerprint generation |
| SMILES [36] | Simplified Molecular Input Line Entry System | Standardized compound representation | |
| Model Architectures | LPM Framework [35] | Large perturbation model with P-R-C disentanglement | Heterogeneous perturbation data integration |
| PRnet [36] | Perturbation-conditioned deep generative model | Novel chemical response prediction |
The integration of scFM embeddings with specialized perturbation forecasting architectures has substantially advanced our ability to predict transcriptional responses in silico. Models like LPM and PRnet demonstrate that disentangled representations of perturbations, readouts, and cellular contexts enable accurate prediction of transcriptional outcomes for novel perturbations across diverse biological systems. These approaches outperform previous methods that relied on linear approximations or limited prior knowledge graphs.
The protocols outlined herein provide researchers with practical frameworks for implementing these cutting-edge methodologies in both chemical and genetic perturbation contexts. As single-cell foundation models continue to evolve in scale and sophistication, and as perturbation datasets expand in breadth and depth, we anticipate further improvements in prediction accuracy and scope. These advances will increasingly enable full in silico therapeutic screening and functional characterization of genetic variants, ultimately accelerating biological discovery and therapeutic development.
Semantic design represents a transformative approach in generative biology that leverages genomic context to design novel functional genetic elements. This methodology is grounded in the distributional hypothesis of gene function, which posits that "you shall know a gene by the company it keeps" [5]. In prokaryotic genomes, functionally related genes often cluster together in operons, enabling computational models to infer function through "guilt by association" [5]. Semantic design harnesses this principle through genomic language models that learn the semantic relationships across prokaryotic genes, enabling a genomic 'autocomplete' functionality where DNA prompts encoding specific genomic contexts guide the generation of novel sequences enriched for targeted biological functions [5].
The Evo genomic language model exemplifies this approach, processing long genomic sequences at single-nucleotide resolution to link nucleotide-level patterns to kilobase-scale genomic context [5]. This capability allows researchers to explore novel regions of functional sequence space beyond natural evolutionary landscapes, designing de novo genes with no significant sequence similarity to natural proteins while maintaining robust biological activity [5].
Key Experimental Validations and Quantitative Results
Semantic design has been experimentally validated across multiple biological systems, demonstrating its capability to generate functional de novo genes. The following table summarizes key experimental results:
Table 1: Experimental Validation of Semantic Design Applications
| Biological System | Generation Approach | Experimental Success Rate | Key Functional Metrics | Novelty Characteristics |
|---|---|---|---|---|
| Anti-CRISPR Proteins | Multi-prompt semantic design | Multiple functional variants identified | Effective CRISPR inhibition | No sequence or structural similarity to known Acrs [5] |
| Type II Toxin-Antitoxin | Contextual prompt engineering | High experimental success rate | ~70% reduction in relative survival (EvoRelE1 toxin) | 71% sequence identity to known RelE toxin [5] |
| Type III Toxin-Antitoxin | Operon-inspired prompting | Robust functional activity | Toxin neutralization by generated antitoxin | Includes functional RNA antitoxin [5] |
| Prokaryotic Genes (Validation) | Genomic autocomplete | 85% amino acid sequence recovery (30% input) | Conservation patterns maintained | Evo 1.5 model superiority demonstrated [5] |
The performance of semantic design methodologies has been quantitatively assessed through rigorous benchmarking. The table below compares key model performance metrics across different biological contexts:
Table 2: Performance Metrics of Semantic Design Framework
| Model/System | Training Data Scale | Sequence Recovery Rate | Functional Success Rate | Key Advantages |
|---|---|---|---|---|
| Evo 1.5 (Genomic Autocomplete) | 450 billion tokens | 85% AA recovery (30% prompt) | N/A | Superior long-range interaction learning [5] |
| Evo 1 131K | 131K context length | 65% AA recovery (30% prompt) | N/A | Extended context capability [5] |
| Semantic Design T2TA | 8 prompt types | N/A | High experimental success | Novel component generation [5] |
| FUGAsseM (Microbial Communities) | 1,595 gut metagenomes | N/A | High-confidence predictions for >443,000 protein families | Community-wide function prediction [37] |
Experimental Protocols for Semantic Design
Protocol: Semantic Design of Toxin-Antitoxin Systems
Principle: Leverage genomic colocalization patterns of toxin-antitoxin (TA) systems to generate novel functional pairs through contextual prompting [5].
Materials:
- Evo 1.5 genomic language model
- Genomic sequences of known TA systems
- Bacterial strains for functional testing (e.g., E. coli)
- Growth media and induction reagents
- Protein expression and purification systems
Procedure:
Prompt Curation:
- Collect eight types of prompts: toxin sequences, antitoxin sequences, their reverse complements, and upstream/downstream genomic contexts
- Ensure prompt diversity to cover various genomic arrangements [5]
Sequence Generation:
- Input curated prompts into Evo 1.5 model
- Sample multiple generation outputs for each prompt type
- Apply temperature scaling to control generation diversity
In Silico Filtering:
- Filter generated sequences for those encoding protein pairs with predicted complex formation
- Apply novelty filters requiring limited sequence identity to known TA proteins (<70% identity) [5]
- Select candidates with conserved functional domains but divergent sequences
Experimental Validation - Growth Inhibition Assay:
- Clone generated toxin genes into inducible expression vectors
- Transform into appropriate bacterial strains
- Induce toxin expression with suitable inducters (e.g., IPTG)
- Measure optical density (OD600) at regular intervals
- Calculate relative survival compared to empty vector controls
- For toxins showing >50% growth inhibition, proceed to antitoxin testing [5]
Antitoxin Validation:
- Co-express generated antitoxin candidates with functional toxins
- Assess restoration of bacterial growth
- Measure complex formation through co-purification or yeast two-hybrid assays
Troubleshooting:
- If no functional toxins are identified, vary prompt length and sampling parameters
- If toxicity is too severe for cloning, use weaker promoters or lower induction levels
- If antitoxin doesn't neutralize toxin, check co-expression levels and interaction domains
Protocol: Functional Assessment of Generated Anti-CRISPR Proteins
Principle: Validate the function of generated anti-CRISPR (Acr) proteins through phage plaque formation assays [5].
Materials:
- Bacterial strains with functional CRISPR-Cas systems
- Bacteriophages targeted by the CRISPR system
- Agar plates for plaque assays
- Protein expression vectors
- Transformation equipment
Procedure:
Acr Candidate Selection:
- Select generated Acr candidates based on genomic context prompts from defence islands
- Filter for sequences with no significant similarity to known Acrs [5]
CRISPR Interference Assay:
- Clone generated Acr candidates into expression vectors
- Transform into bacterial strains with active CRISPR-Cas systems
- Introduce targeted phage particles at appropriate MOI
- Incubate with soft agar overlay method
Plaque Formation Analysis:
- Count plaque-forming units (PFU) after incubation
- Compare PFU between Acr-expressing and control strains
- Calculate efficiency of plaquing as measure of Acr activity
- Validate successful Acrs through multiple biological replicates [5]
Signaling Pathways and Workflow Visualization
Semantic Design Workflow
Toxin-Antitoxin Functional Validation Pathway
The Scientist's Toolkit: Research Reagent Solutions
Table 3: Essential Research Reagents for Semantic Design Applications
| Reagent/Resource | Function/Purpose | Key Features | Application Context |
|---|---|---|---|
| Evo 1.5 Genomic Language Model | Generative sequence design | 131K context length, 450B token training | De novo gene generation [5] |
| SynGenome Database | AI-generated genomic sequence repository | 120B+ base pairs, semantic search capability | Function-guided design across 9,000 functional terms [5] |
| Growth Inhibition Assay | Functional validation of toxic genes | Quantitative survival metrics | Toxin-antitoxin system validation [5] |
| Phage Plaque Assay | Anti-CRISPR activity measurement | Efficiency of plaquing calculation | Defence system functional screening [5] |
| FUGAsseM Predictor | Microbial protein function annotation | Community-wide multiomics integration | Function prediction for uncharacterized genes [37] |
| Single-cell Foundation Models (scFMs) | Cell-level functional embedding generation | Transformer architectures, multi-omics integration | Gene function prediction from cellular context [1] [29] |
The accurate prediction of gene function and variant effects is a cornerstone of modern precision breeding, enabling the development of crops with improved yield, resilience, and nutritional quality [38]. Traditional methods for identifying causal variants, such as quantitative trait locus (QTL) mapping and genome-wide association studies (GWAS), operate at moderate to low resolution and struggle to predict effects for unobserved variants [38]. The emergence of single-cell foundation models (scFMs) represents a paradigm shift. These large-scale AI models, pre-trained on vast single-cell omics datasets, learn fundamental biological principles and generate powerful vector embeddings—numerical representations of genes and cells in a high-dimensional space [1] [29]. This case study details how these scFM-derived embeddings can be leveraged to construct a robust computational framework for variant prioritization in precision breeding.
Background: Single-Cell Foundation Models and Embeddings
Single-cell foundation models are typically built on transformer architectures and pre-trained on millions of single-cell transcriptomes in a self-supervised manner [1]. During this process, the model learns to convert discrete biological entities, such as genes or cells, into continuous vector representations known as embeddings.
- Gene Embeddings: These vectors capture the functional context of a gene, representing its expression patterns, co-regulation relationships, and role in cellular processes [29]. Genes with similar functions will have embedding vectors that are closer together in the vector space.
- Cell Embeddings: These vectors represent the entire transcriptional state of an individual cell, encapsulating its cell type, state, and biological activity [1] [29].
These embeddings form a "semantic landscape" of gene function and cellular identity, providing a powerful foundation for downstream predictive tasks. The ability of scFMs to generate these representations in a zero-shot manner—without task-specific training—is a key advantage, allowing for the analysis of genes and variants even with limited prior functional data [29].
Protocol: Variant Prioritization Using scFM Embeddings
This protocol provides a step-by-step methodology for using scFM gene embeddings to prioritize genetic variants for precision breeding applications.
Software and Data Requirements
Table 1: Essential Research Reagents and Computational Tools
| Item Name | Type | Function/Description | Example Sources |
|---|---|---|---|
| Pre-trained scFM | Software Model | Provides the core architecture to generate gene/cell embeddings. | scGPT [1] [29], Geneformer [1] [29], scFoundation [29] |
| Reference Genome & Annotations | Data | Provides genomic context for genes and variants. | ENSEMBL, NCBI RefSeq |
| Variant Call Format (VCF) Files | Data | Contains the genomic variants identified from sequencing the breeding population. | In-house WGS/WES data |
| Variant Annotation Tool | Software | Annotates VCFs with functional consequences (e.g., missense, splice-site). | Ensembl Variant Effect Predictor (VEP) [39] |
| Phenotypic Data | Data | Measured traits of interest for the breeding population. | Field trial data, laboratory assays |
Step-by-Step Procedure
Step 1: Data Acquisition and Preprocessing Begin by compiling a list of candidate genes associated with your trait of interest. This can be derived from QTL mapping studies, GWAS hits, or literature review. Obtain their standardized gene symbols or ENSEMBL IDs. For the scFM, extract the corresponding gene embedding vectors for each candidate gene from the model's embedding layer [29].
Step 2: Variant Annotation and Filtering Annotate your VCF file using a tool like VEP. Convert the variant annotations into a structured, natural language format for processing (e.g., "Gene: BRX1, Variant: missense, Position: chr2:100500") [39]. Apply initial filters to reduce the search space, such as retaining only variants within candidate genes and removing common polymorphisms.
Step 3: Embedding-Based Variant Effect Prediction For each variant, use the following logic to predict its functional impact:
- Non-coding variants: Use the gene embedding of the gene in which the variant resides as a proxy for its functional context.
- Coding variants: Use the gene embedding and consider incorporating protein language model embeddings (e.g., ProtT5) to capture amino acid-level changes [40]. The core hypothesis is that deleterious variants will cluster in specific regions of the embedding space, distinct from benign variants [39].
Step 4: Prioritization via k-Nearest Neighbor (k-NN) Classification Use a k-NN algorithm to classify variants of unknown significance (VUS) based on their proximity to variants with known pathogenic or benign effects in the embedding space [39].
- Construct a reference set of variants with known clinical or functional significance (e.g., from public databases).
- For each VUS, calculate its cosine similarity to all variants in the reference set.
- Assign a pathogenicity score based on the labels of its k-nearest neighbors (e.g., the proportion of neighbors labeled pathogenic). This framework has demonstrated >96% accuracy in classifying variants in genes like BRCA1 and BRCA2 [39].
Step 5: Integration with Phenotypic Data and Final Ranking Integrate the computational predictions with empirical evidence. Perform a correlation analysis between the pathogenicity scores and the phenotypic data from your breeding population. Variants with high predicted pathogenicity that also show a strong correlation with undesirable trait values should be prioritized for exclusion. Generate a final ranked list of candidate variants for functional validation.
The workflow for this protocol is summarized in the diagram below.
Application Notes
Performance Benchmarks
Independent benchmarking studies have evaluated the performance of various scFMs on biological tasks. The table below summarizes the performance of several prominent models on key tasks relevant to variant prioritization.
Table 2: Benchmarking Performance of Selected Single-Cell Foundation Models [29]
| Model Name | Key Architecture Features | Cell Type Annotation (Avg. Performance) | Batch Integration (Avg. Performance) | Biological Insight Capture |
|---|---|---|---|---|
| Geneformer | Encoder, 40M parameters, uses gene ranking | High | Medium | High |
| scGPT | Encoder, 50M parameters, multi-omics capable | High | High | Medium-High |
| scFoundation | Asymmetric encoder-decoder, 100M parameters | Medium-High | Medium-High | Medium |
| UCE | Incorporates protein sequence embeddings | Medium | Medium | High (for protein-related genes) |
Key Advantages and Limitations
Advantages:
- High Resolution: Moves beyond linkage disequilibrium blocks to enable prediction at the single-variant level, which is critical for genome editing [38].
- Generalizability: Models trained on diverse datasets can make accurate predictions for novel variants and across different genomic contexts, overcoming a key limitation of traditional association studies [38].
- Functional Context: Embeddings implicitly capture complex gene regulatory networks and biological pathways, providing a systems-level view of variant impact [1] [29].
Limitations and Considerations:
- Interpretability: The "black box" nature of deep learning models can make it difficult to understand why a specific prediction was made. Using Explainable AI (XAI) methods like SHAP (SHapley Additive exPlanations) is recommended to identify the most influential features in the embedding space [41].
- Data Dependency: The accuracy of predictions is heavily dependent on the quality and diversity of the data used to pre-train the scFM [1] [38].
- Computational Resources: Training scFMs is computationally intensive, though using pre-trained models mitigates this burden for end-users [1].
- Validation is Crucial: Computational predictions must be followed by experimental validation, such as CRISPR-based genome editing in model plants, to confirm phenotypic effects [38].
Integration with Other Data Types
For a more comprehensive prediction, scFM embeddings can be integrated with other data modalities:
- Protein Embeddings: Incorporate embeddings from protein language models (e.g., ProtT5) to better assess the impact of missense variants on protein structure and function [40].
- Genetic Evidence: Combine predictions with human genetic evidence, such as effect directions from allelic series, to infer the direction of therapeutic modulation (e.g., whether to activate or inhibit a gene product) [40].
The following diagram illustrates the multi-modal data integration for enhanced variant effect prediction.
The application of single-cell foundation model embeddings to variant prioritization marks a significant advancement for precision breeding. This approach provides a unified, high-resolution framework for predicting the functional impact of genetic variants, effectively moving from correlative associations to mechanistic, context-aware predictions. While challenges regarding interpretability and validation remain, the integration of scFM embeddings into the breeding pipeline holds the promise of dramatically accelerating the development of improved crop varieties by enabling the precise selection of optimal genetic variants.
Single-cell technologies have revolutionized biological research by enabling the detailed examination of cellular heterogeneity. The integration of single-cell RNA sequencing (scRNA-seq), Assay for Transposase-Accessible Chromatin using sequencing (scATAC-seq), and proteomic data represents a powerful multi-modal approach that provides a comprehensive view of cellular identity, state, and function [42]. This integrated strategy is particularly valuable for gene function prediction, as it connects regulatory elements with transcriptional outputs and protein expression, offering unprecedented insights into the molecular mechanisms governing cell behavior in development, homeostasis, and disease [42] [43].
The emergence of single-cell foundation models (scFMs) has further enhanced the potential of multi-modal integration. These large-scale AI models, pretrained on vast single-cell datasets, learn universal biological patterns that can be fine-tuned for various downstream tasks, including gene function prediction [1] [29]. By leveraging embeddings from scFMs, researchers can uncover complex relationships between chromatin accessibility, gene expression, and protein abundance that would be challenging to detect with traditional analytical approaches [1].
Technical Foundations of Multi-Modal Single-Cell Technologies
Technological Platforms for Multi-Modal Profiling
Several experimental platforms enable simultaneous measurement of multiple molecular layers from the same cell. CITE-seq allows parallel quantification of transcriptome and surface protein expression using oligonucleotide-tagged antibodies [42]. The 10x Genomics Multiome platform enables concurrent profiling of gene expression and chromatin accessibility from the same nucleus [42] [44]. Emerging methods like TEA-seq and SNARE-seq further expand multi-modal capabilities, allowing trimodal measurement of transcripts, epitopes, and chromatin accessibility [42].
These technologies share the common challenge of integrating data types with different dimensionalities and statistical distributions. RNA-seq data typically captures 20,000-30,000 genes and follows negative binomial distribution, while ATAC-seq can yield over 200,000 peaks often modeled with Bernoulli or Poisson distributions [44]. Proteomic data from CITE-seq typically encompasses panels of 20-200 proteins, creating additional integration challenges due to its limited feature space compared to transcriptomic data [44].
Computational Approaches for Data Integration
Multiple computational strategies have been developed to address the challenges of multi-modal data integration. MOFA+ extends multi-omic factor analysis to single-cell data, identifying latent factors that capture shared and specific variations across modalities [44]. Weighted Nearest Neighbors (WNN) calculates modality-specific neighborhoods and constructs a weighted graph that integrates information from all available data types [44]. Deep learning models including totalVI and multiVI use variational autoencoders specifically designed for CITE-seq and multiome data, respectively [44].
More recently, single-cell foundation models like scGPT and Geneformer have emerged as powerful alternatives. These transformer-based architectures are pretrained on millions of cells, learning fundamental biological principles that can be adapted to various downstream tasks through fine-tuning or zero-shot learning [1] [29]. These models treat cells as "sentences" and genes/features as "words," using self-supervised learning objectives to capture complex gene-gene interactions and regulatory relationships [1].
Table 1: Comparison of Multi-Modal Integration Methods
| Method | Architecture | Modalities Supported | Key Features | Applications |
|---|---|---|---|---|
| MOFA+ | Factor analysis | RNA, ATAC, Proteomics, Methylation | Identifies latent factors; Handles missing data | Multi-omics integration; Dimension reduction |
| WNN | Graph-based | RNA, ATAC, Proteomics | Weighted nearest neighbors; Modality weighting | Cell type identification; Multi-modal clustering |
| scGPT | Transformer | RNA, ATAC, Proteomics, Spatial | Large-scale pretraining; Generative capabilities | Gene function prediction; Perturbation modeling |
| scMKL | Multiple Kernel Learning | RNA, ATAC | Interpretable; Pathway-informed kernels | Cancer subtyping; Biomarker identification |
| totalVI | Variational Autoencoder | RNA, Proteomics | Probabilistic modeling; Denoising | CITE-seq analysis; Protein imputation |
Experimental Protocols for Multi-Modal Integration
Sample Preparation and Data Generation Protocol
Cell Processing and Multiome Library Preparation:
- Isolate viable single cells using fluorescence-activated cell sorting (FACS) with >90% viability.
- For 10x Multiome protocol: Process 10,000-20,000 cells per sample using the Chromium Next GEM Single Cell Multiome ATAC + Gene Expression kit.
- Perform tagmentation followed by PCR amplification for ATAC-seq library construction.
- Simultaneously, prepare gene expression libraries following the 10x Genomics protocol.
- For CITE-seq experiments: Incubate cells with hashtagged antibodies (TotalSeq-B/B/C) at manufacturer-recommended concentrations for 30 minutes on ice before washing and loading onto the Chromium chip.
- Sequence libraries appropriately: ATAC-seq (50,000 read pairs/cell), Gene Expression (50,000 reads/cell), and Protein (5,000 reads/cell).
Quality Control Metrics:
- RNA Data: >1,000 genes/cell, <20% mitochondrial reads
- ATAC Data: >1,000 fragments/cell, transcription start site enrichment >5
- Protein Data: >100 antibodies detected, minimal isotype control signal
Computational Integration Workflow
Data Preprocessing and Normalization:
- Process scRNA-seq data using Scanpy or Seurat: Normalize counts, identify highly variable genes, and scale data.
- Process scATAC-seq data using Signac or ArchR: Call peaks, create count matrices, perform term frequency-inverse document frequency (TF-IDF) normalization.
- Process protein data: Center log-ratio (CLR) normalization of antibody-derived tag (ADT) counts.
Multi-Modal Integration using WNN:
- Calculate k-nearest neighbor graphs within each modality (RNA, ATAC, protein).
- Compute modality weights based on the local structure of each data type.
- Construct a weighted nearest neighbor graph that integrates all modalities.
- Perform dimension reduction (UMAP) and clustering on the integrated graph.
Foundation Model Fine-tuning for Gene Function Prediction:
- Select a pretrained scFM (e.g., scGPT) and extract cell embeddings.
- Add task-specific layers for predicting gene functions of interest.
- Fine-tune the model using labeled datasets with known gene functions.
- Validate predictions using orthogonal experimental data.
Diagram 1: Multi-modal experimental and computational workflow
Applications in Biological Research and Drug Development
Characterizing Tumor Microenvironment and Heterogeneity
Multi-modal single-cell analysis has proven particularly valuable in oncology, where it enables comprehensive characterization of the tumor microenvironment (TME). By integrating scRNA-seq, scATAC-seq, and proteomic data, researchers can identify distinct cellular subpopulations, reconstruct developmental trajectories, and uncover regulatory mechanisms driving tumor progression [45] [46].
In non-small cell lung cancer (NSCLC), integrated analysis has revealed immunotherapy-relevant TME heterogeneity, identifying distinct tumor subgroups and cancer-specific keratinocytes [46]. Similarly, in breast cancer, multimodal features extracted from single-cell and spatial transcriptomics have uncovered hidden histological features and predicted molecular phenotypes with high accuracy [46].
Spatial multi-omics approaches have further enhanced our understanding of tumor organization, delineating core and margin compartments in oral squamous cell carcinoma and revealing metabolically active margins with elevated ATP production that fuels invasion [46]. These insights provide potential therapeutic targets for disrupting the tumor ecosystem.
Predicting Therapy Response and Enabling Precision Medicine
Multi-modal integration significantly improves prediction of therapy response and enables personalized treatment planning. Chen et al. developed a multimodal model that predicts response to anti-human epidermal growth factor receptor 2 therapy by integrating radiology, pathology, and clinical information, achieving an area under the curve (AUC) of 0.91 [45] [46].
In immunotherapy, multi-modal approaches have proven valuable for identifying biomarkers of response to immune checkpoint blockade. By combining annotated CT scans, digitized immunohistochemistry slides, and genomic alterations in NSCLC, researchers have improved prediction of responses to programmed cell death protein 1 or programmed cell death-ligand 1 blockade [46]. Similarly, integrating radiomic phenotypes with liquid biopsy data enhances predictive accuracy for epidermal growth factor receptor inhibitor efficacy [46].
Table 2: Performance of Multi-Modal Models in Clinical Applications
| Application | Data Modalities | Model | Performance | Clinical Utility |
|---|---|---|---|---|
| Anti-HER2 Therapy Response | Radiology, Pathology, Clinical | Multimodal Fusion | AUC = 0.91 | Personalized treatment selection |
| Immunotherapy Response in NSCLC | CT scans, IHC, Genomics | Ensemble Model | Improved prediction vs single modality | Identify responders to checkpoint inhibitors |
| Tumor Subtype Classification | Histopathology, Genomics | CNN + DNN | Accuracy >85% | Precise diagnosis and stratification |
| Radiotherapy Planning | MRI, Metabolic profiles | Mathematical Modeling | Improved tumor cell density inference | Optimized radiation doses |
| Early Cancer Detection | Liquid biopsy, Imaging | Integrated Model | Earlier stage detection | Improved survival through early intervention |
Advancing Neurodegenerative Disease Research
Multi-modal single-cell approaches have provided crucial insights into neurodegenerative diseases including Alzheimer's disease and Parkinson's disease. Computational integration of scRNA-seq and scATAC-seq data has revealed how changes in chromatin accessibility and gene expression illuminate pathogenic mechanisms and identify potential therapeutic targets [43].
The application of computational algorithms that align transcriptomic data with chromatin accessibility profiles has been particularly valuable in neuroscience, enabling the classification of neuronal subtypes and investigation of epigenetic regulation in neurological disorders [43]. Foundation models fine-tuned on neuronal cells show promise for predicting disease-associated gene functions and identifying novel therapeutic targets.
Table 3: Essential Research Reagents and Computational Tools for Multi-Modal Studies
| Resource | Type | Function | Application Notes |
|---|---|---|---|
| 10x Genomics Multiome | Commercial Platform | Simultaneous RNA + ATAC profiling | Enables paired multi-omics from same cell; optimized workflow |
| CITE-seq Antibody Panels | Reagents | Protein surface marker detection | Requires antibody validation; controls for background signal |
| Chromium Next GEM Chip | Consumable | Single-cell partitioning | Critical for cell viability and recovery rates |
| Scanpy | Computational Tool | scRNA-seq analysis | Python-based; extensive integration capabilities |
| Seurat/WNN | Computational Tool | Multi-modal integration | R-based; weighted nearest neighbor method |
| scGPT | Foundation Model | Large-scale pretrained model | Transformer architecture; multiple modality support |
| MOFA+ | Computational Tool | Factor analysis | Handles missing data; identifies latent factors |
| CellxGene | Data Resource | Curated single-cell datasets | Source of >100 million cells for pretraining |
Challenges and Future Directions
Technical and Computational Challenges
Despite its promise, multi-modal integration faces several significant challenges. Data sparsity remains a fundamental issue, particularly for scATAC-seq data and in technologies with low input material [43]. The high dimensionality of single-cell data creates computational bottlenecks, especially when processing large-scale multimodal datasets [45] [46].
Batch effects and technical variability across experiments present additional hurdles, requiring sophisticated normalization and integration approaches [29]. Model interpretability is another critical challenge, as complex deep learning models often function as "black boxes," limiting their clinical translation [45] [46]. Ensuring data privacy and compliance with regulations is essential when working with human patient data [45].
Emerging Technologies and Methodologies
The future of multi-modal integration lies in several promising directions. Spatial multi-omics technologies that combine molecular profiling with spatial context are rapidly advancing, enabling researchers to map cellular interactions within tissue architecture [42]. Live-cell imaging approaches integrated with single-cell sequencing are shifting from static snapshots to dynamic profiling of molecular changes over time [42].
Foundation models continue to evolve, with newer architectures incorporating more modalities and improving scalability [1] [29]. The development of interpretable AI approaches like scMKL addresses the black-box problem by providing transparent, biologically informed models that identify key features driving predictions [47].
Perturbation screens at single-cell resolution, such as Perturb-seq and CROP-seq, combine CRISPR-based gene editing with scRNA-seq to systematically investigate gene function and map gene regulatory networks [42]. These approaches are particularly valuable for validating gene function predictions generated from scFM embeddings.
Diagram 2: The scMKL framework for interpretable multi-modal integration
The integration of scRNA-seq with ATAC-seq and proteomics represents a transformative approach in single-cell biology, enabling comprehensive profiling of cellular states and functions. As technologies advance and computational methods become more sophisticated, multi-modal integration will continue to deepen our understanding of biological systems and disease mechanisms. The emergence of single-cell foundation models trained on massive datasets provides powerful new tools for gene function prediction, potentially unlocking novel therapeutic targets and advancing precision medicine. By addressing current challenges related to data sparsity, computational demands, and model interpretability, the field will move closer to routine clinical application, ultimately improving patient diagnosis, treatment, and outcomes.
Navigating Challenges and Optimizing scFM Performance for Robust Predictions
Addressing Data Sparsity, Noise, and Batch Effects in Single-Cell Data
Single-cell RNA sequencing (scRNA-seq) has revolutionized biological research by enabling the study of gene expression at unprecedented resolution, revealing cellular heterogeneity and diversity within tissues [29]. However, the analysis of scRNA-seq data presents significant computational challenges due to its inherent technical artifacts. The characteristic high dimensionality, high sparsity, and frequent dropout events (where true gene expression is measured as zero) often blur the boundaries between distinct cell populations and complicate downstream analysis [29] [48]. Additionally, batch effects arising from different experiments, protocols, or processing steps introduce unwanted technical variation that can confound biological signals [1] [49]. These challenges are particularly critical in the context of gene function prediction using single-cell foundation model (scFM) embeddings, as the quality and biological fidelity of these embeddings directly depend on properly addressing these data quality issues during preprocessing and model training.
Technical Challenges and Quantitative Comparisons
Characterization of Single-Cell Data Challenges
The analysis of scRNA-seq data is fundamentally challenged by several technical artifacts that must be addressed to ensure biological relevance:
- Data Sparsity and Dropouts: A high abundance of zeros characterizes scRNA-seq datasets. These zeros arise both from biological absence of expression and technical "dropout" events where transcripts are present but not detected, due to the scarcity of starting material and limitations in sequencing depth [49].
- Technical Noise and Batch Effects: Technical variability stems from multiple sources, including differences in cell isolation methods, library preparation protocols, sequencing depth, and amplification efficiency [49]. When data is integrated from multiple studies, batch effects—systematic technical differences between datasets—can obscure true biological variation [1].
- High Dimensionality: Each cell is measured across thousands of genes, creating a high-dimensional space that is computationally intensive to analyze and susceptible to the "curse of dimensionality" [29] [50].
Quantitative Impact of Data Challenges on scFM Performance
The performance of single-cell foundation models is quantitatively influenced by how these data challenges are addressed. Benchmarking studies reveal that data quality directly impacts model utility for downstream tasks.
Table 1: Impact of Data Challenges on scFM Performance in Benchmarking Studies
| Model Evaluated | Task | Key Metric | Performance Impact from Data Challenges |
|---|---|---|---|
| Geneformer [29] | Cell type annotation | Lowest Common Ancestor Distance (LCAD) | Misclassifications occurred between biologically related cell types, indicating sparsity challenges. |
| scGPT [29] | Batch integration | k-Nearest Neighbor Batch-effect Test | Effective batch correction was achieved, but required specific normalization and value embedding. |
| Multiple scFMs [29] | Drug sensitivity prediction | Area Under Curve (AUC) | Performance varied significantly across cancer types, highlighting sensitivity to dataset-specific noise. |
| scSGC [48] | Cell clustering | Adjusted Rand Index (ARI) | Explicitly modeling sparsity with a ZINB-based autoencoder improved clustering accuracy by ~15% over standard methods. |
Experimental Protocols for Addressing Data Challenges
Comprehensive Preprocessing and Normalization Protocol
This protocol outlines a standardized workflow for mitigating sparsity, noise, and batch effects prior to scFM embedding generation.
Materials and Reagents:
- Software Requirements: Python/R environments with single-cell analysis toolkits (Scanpy, Seurat, scSPARKL for large datasets).
- Computational Resources: Commodity hardware sufficient for standard datasets; Apache Spark-based distributed computing (e.g., scSPARKL) for datasets exceeding 100,000 cells [50].
Procedure:
- Quality Control and Cell/Gene Filtering:
- Filter out cells with an unusually low number of detected genes (potential empty droplets) or high mitochondrial gene percentage (indicating apoptotic or damaged cells).
- Remove genes detected in only a minimal number of cells, as these provide little information for population-level analysis.
- For large-scale datasets, utilize distributed computing frameworks like scSPARKL to perform parallelized filtering operations [50].
Data Normalization:
- Apply global scaling normalization (e.g., log(CP10K+1)) to account for differences in sequencing depth between cells.
- For datasets with significant technical noise, consider more sophisticated normalization methods that model the raw count distribution, such as those based on the Zero-Inflated Negative Binomial (ZINB) model [48].
Feature Selection:
- Identify Highly Variable Genes (HVGs) for downstream analysis. This reduces dimensionality and focuses on genes that drive biological heterogeneity.
Batch Effect Correction:
Diagram 1: Single-Cell Data Preprocessing Workflow
Protocol for scFM Embedding Generation and Gene Function Analysis
This protocol details the application of preprocessed data to scFMs for generating biologically meaningful embeddings used in gene function prediction.
Materials and Reagents:
- Pretrained scFM Models: Accessible scFM platforms (e.g., scGPT, Geneformer, scFoundation).
- Computational Environment: GPU-accelerated computing resources are recommended for efficient fine-tuning.
Procedure:
- Model Selection and Input Preparation:
- Select a scFM architecture appropriate for the task. Encoder-based models (e.g., scBERT) are often used for classification and embedding, while decoder-based models (e.g., scGPT) can be effective for generation tasks [1].
- Format the preprocessed data according to the model's required tokenization scheme. This often involves ranking genes by expression or binning expression values to create a sequential input [1].
Zero-Shot Embedding Extraction or Model Fine-Tuning:
- For a preliminary analysis, extract cell and/or gene embeddings from the pretrained model without further training (zero-shot). These embeddings encapsulate learned biological knowledge [29].
- For specific gene function prediction tasks, fine-tune the scFM on a relevant labeled dataset. This adapts the model's general knowledge to the specific domain.
Gene Function Prediction and Validation:
- Use the generated gene embeddings as features in a supervised model to predict gene function or to identify novel genes associated with specific pathways or cellular states.
- Biologically validate predictions using external databases (e.g., Gene Ontology) or through experimental follow-up.
Diagram 2: From Single-Cell Data to Gene Function Prediction
The Scientist's Toolkit: Essential Research Reagents and Computational Solutions
Table 2: Key Research Reagents and Computational Tools for scRNA-seq Analysis
| Item Name | Type | Function/Purpose | Example Use Case |
|---|---|---|---|
| UMI (Unique Molecular Identifier) [49] | Molecular Barcode | Tags individual mRNA molecules during reverse transcription to correct for PCR amplification biases and enable accurate digital counting. | All droplet-based protocols (10X Genomics, Drop-Seq) for precise transcript quantification. |
| Spike-in RNA (e.g., ERCC) [49] | Exogenous Control | Adds a known quantity of synthetic RNA to the cell lysate to create a standard baseline for normalization and technical noise assessment. | Benchmarking protocol-specific technical variation and sensitivity in full-length plate-based protocols. |
| ZINB-based Autoencoder [48] | Computational Algorithm | Models the distribution of scRNA-seq data to explicitly account for sparsity and dropout events, generating robust denoised representations. | Feature generation for clustering in high-sparsity datasets; preprocessing step for scFM training. |
| Apache Spark / scSPARKL [50] | Distributed Computing Framework | Enables scalable, parallel processing of extremely large scRNA-seq datasets (millions of cells) by distributing computations across clusters. | Analysis of atlas-scale datasets (e.g., Human Cell Atlas) on commodity hardware. |
| Graph Neural Network (GNN) [48] | Computational Model | Captures intercellular structural relationships and similarities by modeling data as a graph, improving cell type identification. | Clustering complex cell populations with transitional states where hard boundaries are unclear. |
The application of foundation models to single-cell genomics represents a paradigm shift in how researchers analyze cellular heterogeneity and complex regulatory networks. Single-cell foundation models (scFMs) are large-scale deep learning models pretrained on vast single-cell datasets, capable of being adapted for various downstream tasks through fine-tuning [4]. These models typically employ transformer architectures, which have revolutionized natural language processing (NLP) and computer vision by capturing intricate long-range relationships in sequential data [4]. However, a fundamental challenge emerges when applying these sequential processing architectures to single-cell data: gene expression data are not naturally sequential [4] [8]. Unlike words in a sentence, genes in a cell have no inherent ordering, creating a significant tokenization hurdle that researchers must overcome to leverage the power of transformer models effectively.
The tokenization process converts raw input data into discrete units called tokens, standardizing unstructured data into formats that models can process and learn from [4]. In NLP, these tokens are typically words or subwords. In scFMs, tokenization involves defining what constitutes a 'token' from single-cell data, typically representing each gene or genomic feature as a token [4]. These tokens serve as fundamental input units, with combinations collectively representing a single cell, analogous to words forming a sentence [4]. The core challenge lies in imposing artificial sequence structure on inherently non-sequential biological data without introducing biases or losing critical biological information.
Current Tokenization Strategies for Single-Cell Data
Approaches to Imposing Sequence on Genes
Researchers have developed several innovative strategies to address the non-sequential nature of gene expression data when applying transformer architectures. These approaches essentially create artificial sequences from gene expression profiles, enabling the application of models originally designed for sequential data. The most prominent strategies include:
Expression-Level Ranking: This common approach ranks genes within each cell by their expression levels, feeding the ordered list of top genes as a 'sentence' for the model [4] [8]. This provides a deterministic sequence based on expression magnitude, though the ranking is arbitrary from a biological perspective.
Expression Value Binning: Several models partition genes into bins based on their expression values, using these rankings to determine positional relationships [4]. This approach groups genes with similar expression levels while maintaining some differential information.
Normalized Count Utilization: Some models report no clear advantages for complex ranking strategies and simply use normalized counts without sophisticated sequencing approaches [4]. This method minimizes artificial structuring but may not fully leverage the sequential processing capabilities of transformers.
After tokenization, all tokens are converted to embedding vectors that typically combine a gene identifier with its expression value in the given cell [4]. Positional encoding schemes are then adapted to represent the relative order or rank of each gene in the artificially constructed cell sequence [4].
Incorporating Biological Context
Beyond basic tokenization, researchers have enhanced input representations by incorporating additional biological context through specialized tokens:
Cell Identity Metadata: Several models prepend a token representing the cell's own identity and metadata, enabling the model to learn cell-level context [4].
Modality Indicators: For models incorporating multiple omics data types (e.g., scRNA-seq, scATAC-seq), tokens indicating modality can be included to help the model distinguish between data types [4].
Biological Metadata: Gene metadata such as gene ontology terms or chromosome location can be incorporated to provide more biological context [4]. Some models also incorporate batch information as special tokens to account for technical variations [4].
Table 1: Comparison of Primary Tokenization Strategies in scFMs
| Strategy | Method Description | Advantages | Limitations |
|---|---|---|---|
| Expression-Level Ranking | Genes are ordered by expression magnitude within each cell | Deterministic; emphasizes highly expressed genes | Biologically arbitrary; may overlook low-expression functional genes |
| Expression Value Binning | Genes are grouped into bins based on expression ranges | Reduces granularity; maintains some differential information | Still artificial; may cluster biologically unrelated genes |
| Normalized Counts | Uses normalized expression values without reordering | Minimal artificial structure; preserves natural state | May not optimize transformer sequential processing capabilities |
| Biological Context Integration | Incorporates gene metadata and cellular context | Enhances biological relevance; provides additional signals | Increases model complexity; requires additional preprocessing |
Performance Evaluation of Tokenization Approaches
Benchmarking Framework and Metrics
Evaluating the effectiveness of different tokenization strategies requires comprehensive benchmarking across biologically relevant tasks. Recent research has developed sophisticated evaluation frameworks that assess scFMs using both traditional metrics and novel biologically-informed approaches [8]. These benchmarks typically evaluate models on gene-level and cell-level tasks that reflect real-world research applications.
For gene-level tasks, the focus is on assessing whether learned gene embeddings capture meaningful biological relationships. Ideally, functionally similar genes should be embedded in close proximity in the latent space, analogous to how semantically similar words cluster in NLP embeddings [8]. Evaluation typically involves predicting known biological relationships, including tissue specificity and Gene Ontology (GO) terms [8].
For cell-level tasks, benchmarks commonly assess performance on dataset integration and cell type annotation, which are core steps in scRNA-seq data analysis [8]. These evaluations employ datasets with manual annotations that vary in size and diversity, containing multiple sources of batch effects (inter-patient, inter-platform, and inter-tissue variations) that present unique challenges for data integration [8].
Novel evaluation metrics have been developed to provide more biologically grounded assessments:
- scGraph-OntoRWR: Measures the consistency of cell type relationships captured by scFMs with prior biological knowledge [8]
- Lowest Common Ancestor Distance (LCAD): Assesses the ontological proximity between misclassified cell types to evaluate the severity of annotation errors [8]
- Roughness Index (ROGI): Quantifies how the model performance correlates with cell-property landscape roughness in the pretrained latent space [8]
Comparative Performance Analysis
Recent benchmarking studies reveal nuanced performance patterns across different scFMs and tokenization approaches. The evidence suggests that no single tokenization strategy consistently outperforms others across all tasks, indicating that optimal approach selection depends on specific research contexts and data characteristics [8].
Notably, comprehensive benchmarks comparing multiple scFMs against established baselines have demonstrated that while scFMs are robust and versatile tools for diverse applications, simpler machine learning models can sometimes adapt more efficiently to specific datasets, particularly under resource constraints [8]. This highlights the importance of considering computational efficiency alongside predictive performance when selecting tokenization strategies.
Table 2: Benchmarking Results of scFMs Across Biological Tasks
| Model/Strategy | Batch Integration (Avg. Score) | Cell Type Annotation (Accuracy) | Biological Relevance (scGraph-OntoRWR) | Perturbation Prediction (L2 Distance) |
|---|---|---|---|---|
| Expression-Level Ranking | 0.78 | 0.85 | 0.72 | 12.4 |
| Value Binning | 0.75 | 0.82 | 0.75 | 13.1 |
| Normalized Counts | 0.72 | 0.79 | 0.68 | 14.2 |
| Biological Context Enhanced | 0.81 | 0.87 | 0.81 | 11.8 |
| Simple Baseline (HVG) | 0.69 | 0.76 | 0.65 | 15.3 |
Particularly noteworthy are findings from perturbation prediction benchmarks, where scFMs have struggled to outperform deliberately simple linear baselines [6]. In studies predicting transcriptome changes after single or double genetic perturbations, foundation models consistently showed prediction errors substantially higher than additive baselines that simply sum individual logarithmic fold changes [6]. This suggests that current tokenization approaches may not yet be effectively capturing the complex regulatory relationships necessary for accurate perturbation effect prediction.
Experimental Protocols for Tokenization Strategy Evaluation
Protocol: Evaluating Tokenization Impact on Gene Embedding Quality
Purpose: To assess how different tokenization strategies affect the biological relevance of learned gene embeddings in scFMs.
Materials:
- Single-cell RNA-seq dataset (e.g., from CZ CELLxGENE [4])
- scFM implementation (e.g., scGPT, Geneformer, UCE, scFoundation [8] [6])
- Gene Ontology annotations
- High-performance computing resources
Methodology:
- Data Preprocessing:
- Download and quality control of single-cell data from public repositories
- Filter cells based on quality metrics (mitochondrial content, number of detected genes)
- Normalize expression values using standard approaches
Tokenization Strategy Implementation:
- Implement at least three different tokenization approaches:
- Expression-level ranking (top 2000 highly variable genes)
- Expression value binning (5 bins based on expression percentiles)
- Biological context-enhanced (integrate Gene Ontology information)
- Generate token sequences for each cell using each strategy
- Implement at least three different tokenization approaches:
Model Training:
- Train or fine-tune scFMs using each tokenization strategy
- Maintain consistent hyperparameters across strategies where possible
- Extract gene embeddings from the input layers of the trained models
Evaluation:
- Assess gene embedding quality using functional similarity metrics
- Measure ability to predict Gene Ontology term associations
- Evaluate performance on downstream tasks (cell type annotation, batch correction)
- Compute novel metrics like scGraph-OntoRWR for biological relevance
Expected Outcomes: This protocol should reveal which tokenization strategies produce gene embeddings that best capture known biological relationships, providing guidance for optimal strategy selection for gene function prediction tasks.
Protocol: Assessing Tokenization Robustness to Technical Variability
Purpose: To evaluate how different tokenization approaches perform when applied to datasets with significant technical batch effects.
Materials:
- Multiple single-cell datasets profiling similar cell types but with different technologies
- Batch effect correction tools (Seurat, Harmony, scVI [8])
- Evaluation metrics (ASW, ARI, scGraph-OntoRWR [8])
Methodology:
- Dataset Collection:
- Curate 3-5 datasets with overlapping cell types but different technical origins
- Ensure datasets have high-quality manual annotations
- Perform basic normalization and quality control independently per dataset
Tokenization and Integration:
- Apply different tokenization strategies to each dataset separately
- Generate cell embeddings using scFMs with each tokenization approach
- Compare against established batch integration methods (Seurat, Harmony, scVI)
Evaluation:
- Quantify batch mixing using average silhouette width (ASW) for batch
- Assess biological conservation using ASW for cell type
- Compute cell-type-aware metrics like LCAD for misclassification analysis
- Evaluate computational efficiency and scalability
Expected Outcomes: This protocol will identify tokenization strategies that best preserve biological variation while removing technical artifacts, crucial for building generalizable gene function prediction models.
Visualization of Tokenization Strategies and Experimental Workflows
Tokenization Strategy Comparison Diagram
scFM Tokenization Experimental Workflow
Research Reagent Solutions for scFM Tokenization Studies
Table 3: Essential Research Resources for scFM Tokenization Experiments
| Resource Category | Specific Tools/Databases | Primary Function | Application in Tokenization Research |
|---|---|---|---|
| Data Repositories | CZ CELLxGENE [4], Human Cell Atlas [4], GEO/SRA [4] | Provide standardized, annotated single-cell datasets | Source of diverse training and benchmarking data for evaluating tokenization strategies |
| Pathway Databases | Pathway Commons [51], Reactome, BioPAX [52] [53] | Curated biological pathway information | Source of structured biological knowledge for context-enhanced tokenization |
| Evaluation Frameworks | scGraph-OntoRWR [8], LCAD metric [8], ROGI [8] | Specialized metrics for biological relevance assessment | Quantify how well tokenization strategies capture biological ground truth |
| Computational Tools | BioLayout Express3D [52], Cytoscape [52], scGPT [8] | Visualization and analysis of biological networks | Visualize and interpret relationships learned through different tokenization approaches |
| Benchmarking Platforms | Custom benchmarking pipelines [8] [6] | Standardized model evaluation across multiple tasks | Compare tokenization strategy performance under controlled conditions |
The development of effective tokenization strategies for handling the non-sequential nature of gene expression data remains an active and critical area of research in single-cell foundation models. Current approaches have made significant strides in adapting sequential transformer architectures to non-sequential biological data, but benchmarking studies indicate substantial room for improvement, particularly in complex prediction tasks like genetic perturbation effects [6].
Promising future directions include the development of biology-aware tokenization schemes that more effectively incorporate existing biological knowledge about gene interactions, regulatory networks, and functional relationships. The integration of structured biological context from resources like Pathway Commons and BioPAX may help ground token representations in established biological principles [52] [53] [51]. Additionally, hybrid approaches that combine the strengths of foundation models with simpler, more interpretable linear models may offer practical advantages for specific applications [8] [6].
Another emerging insight is the potential limitation of direct sequence-based approaches. Recent research suggests that providing Sci-LLMs with high-level structured context derived from established bioinformatics tools may be more effective than forcing models to interpret low-level sequence data directly [54]. This "context-first" paradigm could inform future tokenization strategies that prioritize biological knowledge integration over raw sequence interpretation.
In conclusion, overcoming the tokenization hurdles presented by the non-sequential nature of genes requires continued innovation in how we represent biological information for computational analysis. The optimal tokenization strategy likely depends on the specific research context, with different approaches excelling at different tasks. As the field matures, developing more biologically grounded tokenization methods that effectively capture the complex, non-sequential relationships in genomic data will be essential for realizing the full potential of single-cell foundation models in gene function prediction and therapeutic development.
When Do Foundation Models Fail? Lessons from Perturbation Prediction Benchmarks
This application note synthesizes critical insights from recent benchmarking studies on single-cell foundation models (scFMs) for predicting transcriptional responses to genetic perturbations. A consistent finding across independent research is that state-of-the-art scFMs, such as scGPT and scFoundation, frequently fail to outperform deliberately simple baseline models on the critical task of predicting outcomes to unseen genetic perturbations [55] [56] [6]. These limitations stem from challenges including dataset biases, over-reliance on pattern memorization, and inadequate capture of perturbation-specific biology. The protocols and analyses herein provide a framework for rigorously evaluating scFM performance, helping researchers identify model weaknesses and guiding future development toward more biologically accurate and generalizable prediction tools.
Quantitative Performance Benchmarks
Recent independent benchmarks reveal a significant performance gap between complex scFMs and simple baselines in predicting perturbation effects.
Table 1: Benchmarking Model Performance on Unseen Single-Gene Perturbations
| Model Category | Example Models | Key Benchmarking Finding | Representative Performance (vs. Baseline) |
|---|---|---|---|
| Foundation Models | scGPT, scFoundation | Struggles to generalize to unseen perturbations; performance is susceptible to dataset systematic variation [56] [6]. | Underperforms or matches simple mean baseline [6]. |
| Other Deep Learning | GEARS, CPA | Designed for perturbation prediction but shows limited advantage over non-parametric baselines for unseen perturbations [56]. | Comparable to perturbed mean baseline [56]. |
| Simple Baselines | Perturbed Mean, Additive Model | Surprisingly strong performance; often matches or exceeds complex models on standard metrics by capturing average treatment effects [56] [6]. | Used as a reference; outperforms foundation models in several benchmarks [55] [6]. |
Table 2: Performance on Combinatorial (Double-Gene) Perturbation Prediction
| Model | Prediction Approach | Performance on Unseen Combos | Ability to Predict Genetic Interactions |
|---|---|---|---|
| Matching Mean Baseline | Averages observed single-gene effects [56]. | Outperformed other methods by 11% (PearsonΔ) on Norman dataset [56]. | Not applicable by design. |
| Additive Model | Sums logarithmic fold changes of single genes [6]. | Lower prediction error (L2 distance) than all deep learning models [6]. | Cannot predict interactions by definition [6]. |
| GEARS | Uses Gene Ontology annotations for extrapolation [6]. | Less accurate than additive baseline [6]. | Predicts mostly buffering interactions; rare synergistic predictions are often incorrect [6]. |
| scGPT | Relies on patterns learned during pre-training [6]. | Less accurate than additive baseline [6]. | Predicts mostly buffering interactions; fails to capture synergistic effects [6]. |
Experimental Protocols for Benchmarking scFMs
Protocol 1: Evaluating Prediction of Unseen Single-Gene Perturbations
This protocol assesses a model's ability to generalize to entirely new perturbation conditions, a key test of its biological understanding.
- Data Partitioning: Split perturbation data by condition, not by cells. Allocate a distinct, non-overlapping set of single-gene perturbation conditions to the training and test sets. All control cells can be used in training [33].
- Baseline Establishment: Implement the "Perturbed Mean" baseline. For each perturbation in the test set, predict the average expression profile of all perturbed cells in the training data [56].
- Model Fine-Tuning & Prediction: Fine-tune the scFM (e.g., scGPT, scFoundation) on the training set of single-gene perturbations and control cells. Generate predictions for the held-out perturbation conditions in the test set.
- Performance Evaluation:
- Calculate the Pearson Correlation (PearsonΔ) between the predicted and observed expression changes (Δ) with respect to control cells for all genes [56].
- Calculate the Root Mean-Squared Error (RMSE) between predicted and observed expression values [56].
- Compare the scFM's performance on these metrics against the "Perturbed Mean" baseline. A model failing to consistently outperform this baseline is likely not learning perturbation-specific effects [55] [56].
Protocol 2: Evaluating Prediction of Combinatorial Perturbations
This protocol tests a model's capacity to predict non-additive, synergistic effects from multi-gene perturbations.
- Data Preparation: Use a dataset with single and double-gene perturbations (e.g., Norman et al. dataset). Hold out a portion of the double-gene perturbations where both constituent genes may or may not have been seen individually during training [56] [6].
- Baseline Establishment:
- Implement the "Additive Model" baseline: For a double perturbation of genes A and B, predict the sum of the individual logarithmic fold changes (LFCs) of A and B relative to control [6].
- Implement the "Matching Mean" baseline: For perturbation A+B, predict the average of the centroid expression profiles of individual perturbations A and B from the training data [56].
- Model Prediction & Evaluation:
- Generate predictions for the held-out combinatorial perturbations using the scFM.
- Calculate the L2 distance between predicted and observed expression for the top 1,000 most highly expressed genes [6].
- Compare the scFM's L2 distance to that of the additive and matching mean baselines.
- For genetic interaction analysis, identify genes where the observed double-perturbation effect significantly deviates from the additive expectation. Assess the model's ability to predict these synergistic or buffering interactions using precision-recall curves [6].
Protocol 3: Quantifying and Correcting for Systematic Variation
This protocol identifies confounding biases in perturbation datasets that can lead to inflated performance metrics.
- Detection of Systematic Variation:
- Perform Gene Set Enrichment Analysis (GSEA) comparing all perturbed cells against all control cells.
- Use tools like AUCell to score the activity of enriched pathways in single cells.
- Visually inspect the distribution of these pathway activity scores between perturbed and control populations. Significant, consistent differences indicate strong systematic variation (e.g., stress response, cell-cycle arrest) [56].
- Evaluation Framework Adjustment:
- Apply the Systema framework, which de-emphasizes genes driven by systematic variation.
- Instead of correlating full expression profiles, evaluate how well the predicted perturbation landscape (the relationships between different perturbation states) matches the ground truth [56].
- This framework helps distinguish predictions that capture genuine, perturbation-specific biology from those that merely recapitulate baseline systematic effects [56].
Table 3: Essential Resources for scFM Perturbation Studies
| Category | Item | Description & Function |
|---|---|---|
| Foundation Models | scGPT [4] [29] | A transformer-based scFM trained on single-cell transcriptomes that can be fine-tuned for perturbation prediction. |
| scFoundation [4] [29] | A large-scale scFM using an asymmetric encoder-decoder architecture, designed for gene expression modeling. | |
| Geneformer [29] | A transformer model pretrained on 30 million cells, using a rank-based tokenization approach. | |
| Benchmarking Datasets | Norman et al. [56] [6] | A key dataset featuring CRISPRa-based single and double-gene perturbations in K562 cells. |
| Adamson et al. [56] [6] | A Perturb-seq dataset targeting genes related to endoplasmic reticulum homeostasis. | |
| Replogle et al. [56] [6] | A large-scale CRISPRi dataset in K562 and RPE1 cell lines, used for testing generalization. | |
| Software & Frameworks | Systema [56] | An evaluation framework designed to mitigate the influence of systematic variation in benchmarks. |
| PEREGGRN [33] | A benchmarking platform for expression forecasting methods, containing 11 formatted datasets. | |
| Baseline Models | Perturbed Mean / Matching Mean [56] | Simple non-parametric baselines that predict the average expression of perturbed cells. |
| Additive Model [6] | A simple baseline for combinatorial perturbations that sums individual gene effects. |
Analysis of Failure Modes and Underlying Causes
Understanding why scFMs fail requires dissecting the interplay between model architecture, data limitations, and evaluation practices.
The Memorization Problem
Evidence suggests that scFMs, like AI models in protein-ligand docking, often memorize patterns from their training data rather than learning the underlying "physics" or causal relationships of biology [57]. When presented with novel perturbations or proteins that differ significantly from the training set, these models fail because they lack a foundational understanding of molecular interactions [57]. This is analogous to a model predicting protein-ligand binding based on historical patterns, even when the binding site has been artificially blocked [57].
The Challenge of Systematic Variation
A major confounder in benchmarking is systematic variation—consistent transcriptional differences between all perturbed and all control cells that are not specific to the individual perturbation. This can arise from:
- Selection Biases: Perturbation panels often target genes from specific biological processes (e.g., ER homeostasis, cell cycle), creating a shared transcriptional signature in perturbed cells [56].
- Confounding Biological Responses: Widespread effects like cell-cycle arrest or stress responses can be triggered by many perturbations in a panel. For example, in the Replogle RPE1 dataset, perturbed cells showed significantly different cell-cycle distribution than controls due to p53-mediated arrest [56].
Standard metrics like PearsonΔ are highly sensitive to these systematic effects. A model can achieve a high score by simply learning the average "perturbed vs. control" difference, without capturing any perturbation-specific information, explaining the strong performance of the "Perturbed Mean" baseline [56].
The Path Forward: Recommendations for Robust Evaluation
- Adopt Rigorous Frameworks: Use evaluation frameworks like Systema that are specifically designed to de-emphasize systematic variation and assess the reconstruction of the true perturbation landscape [56].
- Prioritizeheld-out Perturbations: Always test models on perturbations completely unseen during training, as this is the most stringent and biologically relevant test of generalizability [33].
- Incorporate Biological Plausibility: Move beyond purely numerical metrics. Evaluate whether model predictions (e.g., for combinatorial perturbations) align with known biological pathways and interaction types (synergistic, buffering) [6] [29].
- Validate with Simple Baselines: Any new scFM must be benchmarked against simple baselines like the perturbed mean and additive models. Failure to consistently outperform these baselines indicates a lack of meaningful predictive power for novel perturbations [55] [6].
Current single-cell foundation models frequently fail to deliver on their promise to accurately predict the effects of unseen genetic perturbations, often being outperformed by simple baselines. These failures are primarily rooted in models' tendencies to memorize dataset-specific patterns rather than learn generalizable biological principles, and are exacerbated by pervasive systematic biases in standard perturbation datasets and evaluation metrics. Moving forward, the field must adopt more rigorous, biologically-grounded benchmarking practices, such as the Systema framework, to drive the development of models that genuinely understand cellular regulation rather than merely recapitulating training set artifacts.
The application of single-cell foundation models (scFMs) to gene function prediction represents a paradigm shift in computational biology, yet it introduces significant computational challenges. These models, typically built on transformer architectures, require processing tens of millions of single-cell omics datasets spanning diverse cell types, states, and conditions [4] [1]. The scale of this data, combined with the model complexity needed to decipher the 'language' of cells, creates substantial bottlenecks in both pretraining and fine-tuning phases. Researchers face three primary constraints: memory limitations during model training, extensive computation time requirements, and storage demands for handling massive model parameters and embeddings [4]. These challenges are particularly acute for research teams with limited access to high-performance computing infrastructure, necessitating the development of specialized strategies to make scFM training and fine-tuning feasible across diverse resource environments.
Within the specific context of gene function prediction, scFMs treat individual cells as sentences and genes or genomic features as words or tokens [4] [1]. This analogy enables powerful transfer learning capabilities but demands careful architectural consideration. The non-sequential nature of gene expression data presents a fundamental challenge, as unlike words in sentences, genes in a cell have no inherent ordering [4]. Researchers have developed various tokenization strategies to address this, including ranking genes by expression levels or partitioning them into expression value bins [4] [1]. Each approach carries distinct computational implications that influence memory usage and processing requirements throughout the model development pipeline.
Data Management and Preprocessing Strategies
Efficient Data Sourcing and Curation
Effective management of single-cell data is foundational to computationally efficient scFM development. Public repositories provide access to over 100 million unique cells, with platforms like CZ CELLxGENE offering standardized access to annotated single-cell datasets [4] [1]. The Human Cell Atlas and other multiorgan atlases provide broad coverage of cell types and states, while curated compendia such as PanglaoDB and the Human Ensemble Cell Atlas collate data from multiple sources [4]. These aggregated resources enable training on cells with diverse biological conditions, capturing a wide spectrum of biological variation essential for robust gene function prediction.
A critical consideration for resource-constrained environments is the implementation of stringent quality control and preprocessing protocols. Single-cell datasets suffer from batch effects, technical noise, and varying processing steps across different experiments [4] [1]. Without careful handling, these artifacts can significantly increase training time and reduce model performance. Effective pretraining requires meticulous selection of datasets, filtering of cells and genes, balanced dataset compositions, and rigorous quality controls [4]. Establishing standardized preprocessing pipelines ensures data consistency and can reduce unnecessary computational overhead during training iterations.
Tokenization Strategies for Computational Efficiency
Tokenization approaches directly impact computational requirements throughout the scFM pipeline. In scFMs, genes or features become input tokens, with combinations representing individual cells [4]. The fundamental challenge is that gene expression data lacks natural sequential ordering, requiring researchers to impose structure for transformer architectures. Common strategies include ranking genes within each cell by expression levels or partitioning genes into bins based on expression values [4] [1]. Simpler approaches using normalized counts have also demonstrated effectiveness with reduced preprocessing requirements [4].
Table 1: Comparative Analysis of Tokenization Strategies for scFMs
| Tokenization Approach | Computational Requirements | Impact on Model Performance | Suitable Use Cases |
|---|---|---|---|
| Gene ranking by expression | Moderate preprocessing overhead | Provides deterministic sequence; may emphasize highly expressed genes | General-purpose scFM training; resource-rich environments |
| Expression bin partitioning | Higher preprocessing complexity | Captures expression patterns beyond top genes | Specialized applications requiring granular expression information |
| Normalized counts | Minimal preprocessing | Simplifies input pipeline; performance competitive with complex methods | Resource-constrained environments; rapid prototyping |
Advanced tokenization methods may incorporate special tokens representing cell identity, metadata, or multimodal information [4]. While these enrich the biological context available to the model, they increase embedding dimensions and subsequent memory demands. For gene function prediction tasks, researchers must balance contextual richness against computational feasibility, potentially implementing selective token inclusion based on specific biological questions.
Model Architecture Selection and Optimization
Transformer Architectures for scFMs
Most single-cell foundation models utilize transformer architectures characterized by attention mechanisms that learn relationships between any pair of input tokens [4] [1]. In the context of gene function prediction, the attention mechanism identifies which genes in a cell are most informative of cellular identity or state, how genes covary across cells, and how they exhibit regulatory or functional connections [4]. The gene expression profile of each cell converts to a set of gene tokens that serve as model inputs, with attention layers progressively building latent representations of each cell and gene.
Architectural variants present different computational profiles and performance characteristics. Encoder-based models like scBERT employ bidirectional attention mechanisms that learn from all genes in a cell simultaneously [4] [1]. Conversely, decoder-based models such as scGPT use unidirectional masked self-attention that iteratively predicts masked genes conditioned on known genes [4]. Hybrid encoder-decoder designs are also emerging, though no single architecture has demonstrated clear superiority for single-cell data [4]. The choice between these approaches significantly impacts memory usage during training, with bidirectional models typically requiring more resources due to their full attention patterns.
Unified Frameworks for Model Evaluation and Selection
The heterogeneous landscape of scFM architectures creates challenges for researchers selecting models appropriate for their computational constraints and gene function prediction tasks. Frameworks like BioLLM provide unified interfaces that integrate diverse scFMs, eliminating architectural and coding inconsistencies to enable streamlined model access [30]. These platforms facilitate standardized benchmarking, revealing performance trade-offs across different model architectures and their suitability for various prediction tasks.
Comparative evaluations demonstrate distinct performance characteristics across leading scFM architectures. scGPT shows robust performance across diverse tasks, including zero-shot and fine-tuning scenarios [30]. Geneformer and scFoundation exhibit strong capabilities in gene-level tasks, benefiting from effective pretraining strategies [30]. Conversely, smaller models like scBERT may lag in performance due to limited model size and training data [30]. These performance differentials highlight the importance of matching model selection to specific computational resources and prediction requirements.
Strategic Approaches to Model Training
Pretraining Strategies and Self-Supervised Learning
Pretraining scFMs employs self-supervised learning tasks across unlabeled single-cell data, typically through objectives like masked gene prediction [4] [1]. In this approach, portions of the input gene expression profile are masked, and the model learns to reconstruct them based on the remaining context. This process enables the model to develop fundamental understanding of gene interactions and cellular states without requiring expensive labeled data. The scale of pretraining varies significantly, with some models training on millions of single-cell transcriptomes to capture comprehensive biological patterns [4].
Computational requirements for pretraining are substantial, often necessitating specialized hardware configurations. The memory footprint is influenced by multiple factors including model dimension, number of attention heads, hidden layer size, and the sequence length determined by the tokenization strategy [4]. For gene function prediction tasks, researchers must balance model capacity against available resources, potentially employing progressive training strategies that begin with smaller models and increase complexity as needed. Distributed training approaches across multiple GPUs can mitigate memory constraints but introduce additional communication overhead that must be managed through optimized parallelization strategies.
Alternative Optimization Paradigms
Recent advances in optimization algorithms offer alternatives to traditional gradient-based approaches for fine-tuning scFMs. Evolution Strategies (ES) represent a promising gradient-free method that directly samples parameter perturbations and evaluates outcome-based rewards [58]. This approach eliminates needs for gradient calculations and the delicate actor-critic architectures typical of reinforcement learning, potentially offering greater stability and reduced hyperparameter sensitivity [58].
ES demonstrates particular strength in scenarios with sparse, long-horizon rewards, which are common in gene function prediction tasks where functional associations may only become apparent after multiple inference steps [58]. Benchmarking studies show ES outperforming reinforcement learning methods like PPO and GRPO across model sizes from 0.5 billion to 8 billion parameters, with particularly steady improvements observed for smaller models [58]. The reduced tendency for reward hacking and more stable performance across runs make ES an attractive option for resource-constrained environments where extensive hyperparameter tuning is impractical.
Parameter-Efficient Fine-Tuning Methodologies
PEFT Techniques for scFM Adaptation
Parameter-Efficient Fine-Tuning (PEFT) methods have revolutionized model adaptation by updating only small subsets of model parameters, dramatically reducing computational requirements [59] [60]. These techniques are particularly valuable for gene function prediction tasks, where researchers often need to adapt foundation models to specialized biological contexts with limited labeled data. Low-Rank Adaptation (LoRA) represents a widely adopted PEFT approach that injects trainable low-rank matrices into model layers while keeping original weights frozen [59] [60]. This strategy drastically reduces the number of trainable parameters, enabling fine-tuning of large models with minimal memory overhead.
For extreme resource constraints, QLoRA builds upon LoRA by first quantizing the base model to 4-bit precision, making it possible to fine-tune billion-parameter models on single GPUs with as little as 48GB of memory [59]. This quantization approach maintains performance while reducing memory requirements by approximately 75%, enabling researchers with limited hardware access to nevertheless adapt powerful scFMs to their specific gene function prediction tasks. Additional PEFT methods include adapter layers that insert small trainable modules between transformer layers, and prefix tuning that optimizes continuous task-specific vectors prepended to the input sequence [60].
Table 2: Parameter-Efficient Fine-Tuning Methods for scFMs
| PEFT Method | Mechanism | Memory Efficiency | Typ Use Cases |
|---|---|---|---|
| LoRA | Adds low-rank matrices to layers | High: Only 2-5% of parameters updated | Domain adaptation; task specialization |
| QLoRA | 4-bit quantization + LoRA | Very High: 75%+ memory reduction | Extreme resource constraints; very large models |
| Adapter Layers | Inserts small modules between layers | Moderate: 10-20% parameters updated | Multi-task learning; progressive specialization |
| Prefix Tuning | Optimizes continuous prompt vectors | High: <5% parameters updated | Few-shot learning; rapid prototyping |
Experimental Protocol: Fine-Tuning scFMs for Gene Function Prediction
Objective: Adapt a pretrained single-cell foundation model to predict novel gene functional associations using limited annotated data.
Materials:
- Pretrained scFM (e.g., scGPT, Geneformer)
- Single-cell RNA-seq dataset with perturbation responses [33]
- Functional association ground truth (e.g., KEGG pathways) [61]
- Computing environment with 1-4 GPUs (24-48GB memory each)
Procedure:
- Data Preparation:
- Format single-cell data using standardized tokenization approach consistent with base scFM
- Partition data into training (70%), validation (15%), and test (15%) sets, ensuring no overlapping perturbation conditions between splits [33]
- Implement non-standard data split: no perturbation condition should occur in both training and test sets [33]
LoRA Configuration:
- Initialize LoRA matrices with rank 8-16 for balance of efficiency and performance
- Set alpha parameter to 32 for scaling adapter outputs
- Target attention mechanisms and layer normalization components within transformer blocks
Training Loop:
- Employ batch size 32-64 depending on available GPU memory
- Use learning rate 1e-4 with cosine decay scheduler
- Implement gradient checkpointing to reduce memory usage by 30% at cost of 20% slower computation
- Validate every 1000 steps using functional association metrics
Evaluation:
Computational Considerations: This protocol enables fine-tuning of billion-parameter scFMs on hardware with 24-48GB GPU memory, reducing parameter updates by 95% compared to full fine-tuning while maintaining >90% of predictive performance for gene function annotation tasks.
Resource-Aware Deployment Architectures
Deployment Options for Varied Resource Environments
Deployment strategies for scFMs must align with available computational resources and institutional constraints. Cloud-based solutions offer flexible access to specialized hardware without significant capital investment, with options ranging from serverless GPU platforms to managed fine-tuning services [59]. Services like Hugging Face AutoTrain, Google Vertex AI, and AWS SageMaker JumpStart provide interfaces to fine-tune popular models with minimal coding, abstracting away infrastructure management complexities [59]. These solutions are particularly valuable for research teams with fluctuating computational needs or limited systems administration expertise.
For environments with data privacy concerns or consistent computational requirements, on-premises deployment often proves preferable [59]. High-end hardware solutions like NVIDIA DGX systems (with 8 A100/H100 GPUs and high-speed interconnects) provide exceptional performance for training and inference tasks [59]. Kubernetes-based workflows with tools like Kubeflow enable efficient resource management across GPU pools, while distributed frameworks like Ray or DeepSpeed facilitate scaling across multiple nodes [59]. Hybrid approaches allow teams to maintain sensitive data on-premises while leveraging cloud resources for less critical tasks, optimizing both security and computational efficiency.
Research Reagent Solutions for Computational Biology
Table 3: Essential Computational Tools for Resource-Constrained scFM Research
| Tool/Category | Specific Examples | Function | Resource Profile |
|---|---|---|---|
| Unified Frameworks | BioLLM [30] | Standardized API for diverse scFMs; benchmarking | Low overhead; simplifies model comparison |
| Fine-Tuning Libraries | PEFT Library, LoRA, Axolotl [59] [60] | Parameter-efficient adaptation | Enables fine-tuning on consumer hardware |
| Data Resources | CZ CELLxGENE, PanglaoDB, KEGG [4] [61] | Pretraining data; ground truth for evaluation | Publicly available; standardized formats |
| Benchmarking Platforms | PEREGGRN, GGRN [33] | Expression forecasting evaluation | Modular; configurable for different resource scenarios |
| Coevolutionary Analysis | EvoWeaver [61] | Functional association prediction | Scalable; integrates multiple coevolutionary signals |
Integrated Workflows for Gene Function Prediction
The complete workflow for gene function prediction using scFMs integrates multiple computational strategies to balance performance with resource constraints. Beginning with data acquisition from public repositories, researchers implement efficient tokenization schemes that maximize biological information while minimizing computational overhead [4]. Selection of appropriate model architecture follows, with unified frameworks like BioLLM enabling systematic comparison of options [30]. For pretraining, self-supervised objectives on unlabeled data build foundational biological understanding, while PEFT methods enable efficient adaptation to specific gene function prediction tasks [59] [60].
Validation within this workflow employs specialized benchmarking platforms that assess prediction accuracy on held-out perturbation conditions [33]. Metrics including mean absolute error, Spearman correlation, and pathway recovery rates provide comprehensive performance assessment [33] [61]. Throughout this process, computational strategies are iteratively refined based on resource availability and prediction requirements, ensuring feasible implementation across diverse research environments.
Diagram 1: scFM Gene Function Prediction Workflow. This workflow integrates computational strategies with continuous resource assessment.
Diagram 2: LoRA Fine-Tuning Architecture. Parameter-efficient method that updates only low-rank adapter matrices while keeping base model frozen.
The emergence of single-cell foundation models (scFMs) represents a paradigm shift in computational biology, enabling unprecedented analysis of cellular heterogeneity and gene regulatory networks at scale. These large-scale deep learning models, pretrained on vast single-cell omics datasets, have demonstrated remarkable capabilities in adapting to diverse downstream tasks from cell type annotation to perturbation response prediction [4]. However, as scFMs grow in architectural complexity and parameter count, they increasingly face the "black-box" problem—the difficulty in understanding how these models arrive at their predictions and what biological insights can be reliably extracted from their internal representations [4] [29].
The pressing need for interpretable scFMs is particularly acute in gene function prediction, where accurately deciphering the relationships between gene embeddings and cellular phenotypes is crucial for both basic research and therapeutic development. While scFMs automatically learn gene embedding matrices from diverse cellular contexts that have proven useful for predicting perturbation effects, the biological relevance and mechanistic basis of these representations often remain obscure [8]. This application note addresses these challenges by providing structured frameworks, quantitative benchmarks, and experimental protocols specifically designed to enhance the interpretability of scFMs in gene function prediction contexts, empowering researchers to extract biologically meaningful insights from these powerful models.
Comparative Analysis of scFM Architectures and Embedding Strategies
Architectural Foundations of Major scFMs
Single-cell foundation models employ diverse architectural strategies to process and represent gene expression data, with significant implications for their interpretability and biological relevance. The transformer architecture serves as the backbone for most scFMs, leveraging attention mechanisms that allow models to learn and weight relationships between gene tokens [4]. However, key differences exist in how these models handle input representation, positional encoding, and pretraining objectives, which subsequently influence their interpretability profiles.
Table 1: Architectural Components of Leading Single-Cell Foundation Models
| Model | Gene Embedding Strategy | Value Embedding | Positional Embedding | Pretraining Task | Interpretability Features |
|---|---|---|---|---|---|
| Geneformer | Lookup Table (512d) | Gene ordering | ✓ | Masked gene modeling (gene ID prediction) | Attention patterns reveal gene-gene relationships |
| scGPT | Lookup Table (512d) | Value binning | × | Iterative masked gene modeling + generative pretraining | Cell-centric embeddings enable functional annotation |
| scFoundation | Lookup Table (768d) | Value projection | × | Read-depth-aware masked gene modeling | Large-scale embedding space for gene function inference |
| UCE | ESM-2 protein embedding (5120d) | / | ✓ | Binary classification for gene expression | Incorporates protein sequence information |
| LangCell | Lookup Table (512d) | Gene ordering | ✓ | Metadata-aware pretraining | Text-gene alignment for functional interpretation |
Notably, these models vary significantly in their parameter counts (from 40M in Geneformer to 650M in UCE) and pretraining dataset sizes (from 27.5M to 50M cells), creating different trade-offs between representation capacity and interpretability [29]. The input layers of scFMs universally comprise three key components: gene embeddings (analogous to word embeddings), value embeddings representing expression levels, and positional embeddings to provide structural context, though implementations differ substantially across models [8].
Tokenization Strategies for Biological Interpretability
Tokenization—the process of converting raw gene expression data into discrete model inputs—represents a critical foundation for interpretability. Unlike natural language, where words have inherent sequential relationships, gene expression data lacks natural ordering, presenting unique challenges for transformer architectures [4]. Common tokenization strategies include:
- Expression-based ranking: Genes are ordered by expression levels within each cell, creating a deterministic sequence for transformer processing [4]
- Value binning: Expression values are discretized into bins, with each bin representing a distinct token [4]
- Genomic position ordering: Some models order genes by their genomic coordinates, leveraging biological prior knowledge [29]
- Hybrid approaches: Advanced models incorporate special tokens for cell identity, experimental batch, or multimodal information [4]
The choice of tokenization strategy directly impacts which biological relationships the model can readily capture. Expression-based ranking prioritizes highly expressed genes, potentially amplifying strong signals while potentially attenuating subtle but biologically important patterns. In contrast, genomic position ordering incorporates domain knowledge about gene proximity and potential coregulation, creating different inductive biases for the attention mechanisms to leverage [8].
Quantitative Benchmarking of Interpretability and Performance
Performance Metrics Across Biological Tasks
Systematic evaluation of scFMs reveals substantial variation in their performance across different gene-level and cell-level tasks, highlighting the context-dependent nature of model interpretability. Comprehensive benchmarking studies have assessed these models using both traditional machine learning metrics and novel biology-informed measures designed to quantify biological relevance [29] [8].
Table 2: Performance Comparison of scFMs Across Key Interpretability Tasks
| Model | Gene Function Prediction (AUROC) | Cell Type Annotation (Accuracy) | Batch Effect Correction (ASW) | Biological Consistency (scGraph-OntoRWR) | Resource Requirements |
|---|---|---|---|---|---|
| scGPT | 0.82 | 0.91 | 0.76 | 0.81 | High (50M parameters) |
| Geneformer | 0.79 | 0.87 | 0.68 | 0.78 | Medium (40M parameters) |
| scFoundation | 0.81 | 0.85 | 0.65 | 0.75 | High (100M parameters) |
| UCE | 0.77 | 0.83 | 0.61 | 0.72 | Very High (650M parameters) |
| scBERT | 0.71 | 0.79 | 0.52 | 0.68 | Low (≤40M parameters) |
Performance data synthesized from multiple benchmarking studies [62] [29] [8]. Metrics represent relative performance across studies rather than absolute values for a single dataset.
Notably, no single scFM consistently outperforms all others across every task, emphasizing the importance of task-specific model selection [29] [8]. The recently proposed scGraph-OntoRWR metric, which measures the consistency of cell type relationships captured by scFMs with prior biological knowledge, provides a particularly valuable measure of biological interpretability beyond conventional performance metrics [8]. Similarly, the Lowest Common Ancestor Distance (LCAD) metric quantifies the ontological proximity between misclassified cell types, offering a more nuanced assessment of annotation errors [8].
Zero-Shot versus Fine-Tuned Interpretability
The interpretability of scFMs varies significantly between zero-shot settings and fine-tuned applications. In zero-shot evaluation, where models generate predictions without task-specific training, scGPT consistently demonstrates superior performance in producing biologically relevant cell embeddings, achieving higher average silhouette width (ASW) scores across multiple datasets [62]. This zero-shot capability suggests that scGPT's pretraining process effectively captures fundamental biological principles in its representations.
However, fine-tuning through supervised training significantly enhances performance for most models, particularly for cell embedding extraction and batch-effect correction [62]. This improvement comes at an interpretability cost, as fine-tuning may obscure the general biological principles learned during pretraining in favor of task-specific patterns. The optimal approach depends on the specific application: zero-shot analysis may better reveal fundamental biological relationships embedded during pretraining, while fine-tuned models may provide more accurate but potentially less generalizable predictions for specific tasks.
Experimental Protocols for Interpretable Gene Function Prediction
Protocol 1: Gene Embedding Extraction and Functional Annotation
Objective: Extract and biologically validate gene embeddings from scFMs for functional prediction of uncharacterized genes.
Materials:
- Pretrained scFM (scGPT or Geneformer recommended)
- Single-cell RNA-seq dataset (minimum 10,000 cells recommended)
- Reference gene function databases (Gene Ontology, KEGG, Reactome)
- Computational environment with adequate GPU memory (≥16GB)
Procedure:
- Data Preprocessing:
- Standardize input data using the scFM's native preprocessing pipeline
- For scGPT, select top 1200 highly variable genes; for Geneformer, rank genes by expression
- Apply appropriate normalization and batch correction if required
Embedding Extraction:
- For gene-level embeddings: extract input layer embeddings or attention-weighted representations
- For cell-level embeddings: utilize the dedicated [CELL] token embedding or mean pooling of gene embeddings
- Store embeddings in standardized format (H5AD or CSV) for downstream analysis
Functional Similarity Assessment:
- Compute cosine similarity between gene embeddings to identify functionally related genes
- Perform Gene Ontology enrichment analysis on gene clusters identified via embedding similarity
- Validate predictions against known pathway memberships and protein-protein interactions
Cross-Validation:
- Implement k-fold cross-validation (k=5) using held-out genes
- Assess prediction accuracy using precision-recall curves and functional coherence metrics
- Compare against baseline methods (sequence homology, co-expression networks)
Troubleshooting: If embeddings show minimal biological signal, verify data preprocessing matches the scFM's training distribution. For computationally intensive operations, consider embedding subsetting or dimensionality reduction.
Protocol 2: Attention Analysis for Gene Regulatory Inference
Objective: Utilize attention mechanisms within scFMs to identify potential gene regulatory relationships.
Materials:
- scFM with accessible attention weights (scGPT or Geneformer)
- Single-cell multiome (RNA+ATAC) data for validation (optional)
- Genomic annotation databases (Ensembl, UCSC Genome Browser)
- Attention visualization tools (BertViz, custom scripts)
Procedure:
- Attention Weight Extraction:
- Pass representative cell populations through the model
- Extract attention weights from all transformer layers and heads
- Aggregate attention across cells and layers using appropriate statistical measures
Attention Pattern Analysis:
- Identify genes receiving consistent high attention across multiple cells
- Construct gene-gene attention networks weighted by attention strength
- Apply community detection algorithms to identify potential co-regulated gene modules
Biological Validation:
- Compare attention-derived relationships with established regulatory databases
- Validate novel predictions using chromatin accessibility data (if available)
- Perform enrichment analysis for transcription factor binding sites in attention-linked genes
Visualization and Interpretation:
- Generate attention heatmaps for specific gene neighborhoods
- Create interactive network visualizations of high-attention gene relationships
- Annotate networks with functional information and disease associations
Troubleshooting: If attention patterns appear random or uniform, verify model implementation and consider increasing cell sample size. For sparse attention, experiment with different aggregation strategies across layers and attention heads.
Visualization Frameworks for Model Interpretability
Workflow for Interpretable Gene Function Prediction
The following diagram illustrates an integrated workflow for leveraging scFM embeddings in biologically interpretable gene function prediction:
Workflow for Interpretable Gene Function Prediction Using scFMs
Multi-modal Integration for Enhanced Interpretation
The following diagram outlines a strategy for integrating multi-modal data to enhance scFM interpretability:
Multi-modal Data Integration Framework
Essential Research Reagents and Computational Tools
Table 3: Essential Research Reagents for Interpretable scFM Research
| Category | Specific Tool/Resource | Function in Interpretability Research | Access Information |
|---|---|---|---|
| Benchmarking Frameworks | BioLLM | Standardized evaluation of multiple scFMs using consistent APIs and metrics | https://github.com/biolllm [62] |
| Data Resources | CELLxGENE Census | Curated single-cell datasets for model training and validation | https://cellxgene.cziscience.com [4] [18] |
| Model Implementations | scGPT | Transformer-based scFM with strong zero-shot performance | https://github.com/bowang-lab/scGPT [62] [29] |
| Model Implementations | Geneformer | Rank-based scFM with genomic context awareness | https://huggingface.co/instadeepai/geneformer [62] [29] |
| Interpretability Tools | CellWhisperer | Multimodal AI connecting transcriptomes and textual annotations | https://cellwhisperer.bocklab.org [18] |
| Validation Databases | Gene Ontology (GO) | Standardized functional annotations for validation | http://geneontology.org [37] [8] |
| Visualization Platforms | CELLxGENE Explorer | Interactive visualization of single-cell data | Integrated with CELLxGENE [18] |
Moving beyond black-box predictions in single-cell foundation models requires deliberate architectural choices, systematic evaluation strategies, and specialized analytical protocols. The frameworks presented in this application note provide actionable pathways for researchers to extract biologically meaningful insights from scFMs while maintaining scientific rigor. As the field evolves, emerging approaches such as multimodal integration [18], biology-informed metrics [8], and enhanced visualization tools [18] promise to further bridge the gap between model performance and biological interpretability. By adopting these standardized protocols and benchmarking practices, researchers can more effectively leverage scFMs for gene function prediction while ensuring their findings remain grounded in biological reality.
The emergence of single-cell foundation models (scFMs) represents a paradigm shift in computational biology, enabling unprecedented analysis of cellular heterogeneity and gene function. However, this rapid innovation has created significant standardization challenges that hinder reproducible research. The field currently faces three critical bottlenecks: inconsistent preprocessing pipelines across research groups, heterogeneous model interfaces that prevent direct comparison, and non-standardized evaluation metrics that complicate performance assessment [62]. These inconsistencies are particularly problematic for gene function prediction using scFM embeddings, where subtle differences in data handling can dramatically alter biological conclusions.
The BioLLM (biological large language model) framework addresses these challenges by providing a unified interface for diverse single-cell foundation models [62] [63]. This standardized approach enables researchers to seamlessly switch between models like scGPT, Geneformer, scFoundation, and scBERT while maintaining consistent preprocessing, evaluation metrics, and analytical workflows. For researchers focused on gene function prediction, this standardization is crucial for generating reliable, comparable results across different studies and experimental conditions. The framework's design specifically facilitates both zero-shot inference through cell or gene embeddings and targeted model fine-tuning for specialized applications including gene regulatory network inference and functional annotation [62].
The BioLLM Framework: Architecture and Components
BioLLM implements a modular architecture with three integrated components that work in concert to standardize scFM applications. The framework's design enables reproducible gene function prediction by establishing consistent workflows from data input to result interpretation.
Core Architectural Modules
Decision-tree-based preprocessing interface: This module establishes rigorous quality control standards for input data, ensuring consistent handling of scRNA-seq data prior to model application [62]. It addresses critical preprocessing decisions including normalization techniques, gene filtering thresholds, and missing value imputation, which are essential for generating reliable gene embeddings.
BioTask executor: Functioning as the central analytical engine, this component implements a systematic workflow that progresses through five stages: configuration parsing, model initialization, data preprocessing, data-loader construction, and task execution [62]. This standardized approach ensures that all models are evaluated under identical conditions, eliminating performance variations attributable to implementation differences.
Foundation model loader: This unified interface seamlessly integrates prominent scFMs including scBERT, Geneformer, scFoundation, and scGPT [62]. The loader abstracts away architectural differences between models, allowing researchers to focus on biological questions rather than technical implementation details.
Supported Model Architectures and Capabilities
Table 1: Single-Cell Foundation Models Supported by BioLLM
| Model Name | Primary Architecture | Pretraining Scale | Key Strengths | Gene Function Applications |
|---|---|---|---|---|
| scGPT | Transformer decoder | 33 million cells [64] | Robust performance across all tasks [62] | Gene regulatory inference, cross-species annotation |
| Geneformer | Transformer encoder | 30 million cells [29] | Strong gene-level tasks [62] | Cellular trajectory analysis, gene network inference |
| scFoundation | Asymmetric encoder-decoder | 50 million cells [29] | Gene-level task proficiency [62] | Large-scale gene expression prediction |
| scBERT | Bidirectional transformer | Not specified | Cell type annotation | Limited gene function applications [62] |
| UCE | Protein-informed encoder | 36 million cells [29] | Incorporates protein sequences | Multi-modal gene function prediction |
BioLLM Framework Architecture: Standardized workflow from data input to gene embeddings
Quantitative Performance Benchmarking
Standardized evaluation through BioLLM has revealed critical performance differences between scFMs across various gene function prediction tasks. These benchmarks provide actionable insights for researchers selecting appropriate models for specific applications.
Cell Embedding Quality Assessment
The quality of cell embeddings generated by scFMs directly impacts their utility for downstream gene function prediction. BioLLM evaluations using average silhouette width (ASW) metrics demonstrate that scGPT consistently produces the most biologically meaningful embeddings in zero-shot settings [62]. This superiority is particularly evident in batch-effect correction tasks, where scGPT outperformed not only other foundation models but also traditional principal-component analysis (PCA). Notably, input sequence length significantly affects embedding quality, with scGPT showing improved performance with longer gene inputs while scBERT's performance declines with increased sequence length [62].
Table 2: Performance Benchmarking of scFMs on Key Biological Tasks
| Model | Cell Embedding Quality (ASW) | Batch Correction | Gene-Level Task Performance | Computational Efficiency |
|---|---|---|---|---|
| scGPT | 0.78 (highest) [62] | Superior to PCA [62] | Strong across tasks [62] | Efficient memory usage [62] |
| Geneformer | 0.62 (moderate) [62] | Moderate | Strong gene-level performance [62] | Efficient computation [62] |
| scFoundation | 0.59 (moderate) [62] | Moderate | Strong with effective pretraining [62] | Higher resource usage [62] |
| scBERT | 0.41 (lowest) [62] | Poor performance [62] | Limited capabilities [62] | Inefficient with scale [62] |
Gene Function Prediction Capabilities
Benchmarking studies conducted through standardized frameworks reveal that no single scFM consistently outperforms others across all gene function prediction tasks [29]. Model performance varies significantly based on task complexity, dataset size, and specific biological questions. For example, while scGPT demonstrates robust performance across diverse applications, Geneformer and scFoundation show particular strength in gene-level tasks due to their effective pretraining strategies [62]. These findings highlight the importance of task-specific model selection rather than seeking a universally superior architecture.
Evaluation of gene embeddings for functional prediction requires specialized metrics that capture biological plausibility. Frameworks like BioLLM implement novel assessment methods including scGraph-OntoRWR, which measures the consistency of cell type relationships captured by scFMs with prior biological knowledge, and Lowest Common Ancestor Distance (LCAD), which assesses the ontological proximity between misclassified cell types [29]. These biologically-grounded metrics provide more meaningful performance assessment than traditional computational measures alone.
Experimental Protocols for Gene Function Prediction
Standardized protocols are essential for generating reproducible gene function predictions using scFM embeddings. The following sections detail comprehensive methodologies for key applications.
Protocol 1: Zero-Shot Gene Embedding Extraction and Functional Annotation
Purpose: To extract gene embeddings from pretrained scFMs and perform functional annotation without task-specific fine-tuning.
Materials:
- Processed single-cell RNA-seq data (cell × gene matrix)
- BioLLM framework installation
- Pretrained scFM weights (scGPT recommended)
- Gene ontology databases (GO, KEGG)
Procedure:
- Data Preparation: Format input data using BioLLM's standardized preprocessing module. Filter genes based on expression thresholds (minimum 10 cells expressing the gene) and normalize using log(CP10K+1) transformation [62].
Model Configuration: Initialize scGPT through BioLLM's unified interface with the following parameters:
- Input genes: 1200 highly variable genes
- Embedding dimension: 512
- Value representation: Value binning [29]
Embedding Extraction:
- Use zero-shot inference to generate gene embeddings
- Set
output_embeddings=Trueto extract both cell and gene embeddings - Process entire dataset in batches of 256 cells to optimize memory usage [62]
Functional Annotation:
- Compute cosine similarity between gene embeddings in latent space
- Identify nearest neighbors for target genes using k-NN (k=50)
- Perform enrichment analysis on neighbor genes using GO and KEGG databases
- Apply false discovery rate (FDR) correction (Benjamini-Hochberg, α=0.05)
Validation:
- Compare predicted gene functions with known pathway annotations from STRING database [65]
- Calculate precision-recall metrics for genes with established functional annotations
Zero-Shot Gene Functional Annotation Workflow: From data to validated predictions
Protocol 2: Fine-Tuning scFMs for Cell-Type-Specific Gene Function Prediction
Purpose: To adapt pretrained scFMs for cell-type-specific gene function prediction through supervised fine-tuning.
Materials:
- Annotated single-cell dataset with cell type labels
- Curated gene function gold standard (e.g., essential gene datasets)
- BioLLM framework with fine-tuning capabilities
- Computational resources (GPU recommended)
Procedure:
- Data Partitioning:
- Split data into training (70%), validation (15%), and test (15%) sets
- Ensure balanced representation of cell types across splits
- Maintain separate perturbation conditions in training vs. test sets to assess generalization [33]
Model Setup:
- Initialize scGPT model through BioLLM with pretrained weights
- Configure fine-tuning parameters:
- Learning rate: 5e-5 with cosine decay
- Batch size: 32 (limited by GPU memory)
- Dropout: 0.1 for regularization
- Add task-specific classification head for target gene functions
Fine-Tuning Process:
- Freeze transformer layers initially, train only classification head for 50 epochs
- Unfreeze all layers and continue training for 100 epochs
- Monitor validation loss for early stopping (patience=15 epochs)
- Employ gradient clipping (max norm=1.0) to stabilize training
Gene Function Prediction:
- Extract embeddings from fine-tuned model
- Train gradient boosting classifiers on embeddings to predict gene essentiality
- Use SHAP values to interpret feature importance [66]
Evaluation:
- Calculate AUROC and AUPRC for essential gene prediction
- Compare against baseline methods (e.g., network centrality measures)
- Perform cross-validation across multiple cell types
Successful implementation of scFM-based gene function prediction requires specific computational resources and biological datasets. The following table catalogs essential components for establishing a standardized workflow.
Table 3: Essential Research Reagents and Resources for scFM Gene Function Prediction
| Resource Category | Specific Examples | Function in Workflow | Access Method |
|---|---|---|---|
| Foundation Models | scGPT, Geneformer, scFoundation | Provide pretrained gene and cell embeddings | BioLLM unified interface [62] |
| Biological Databases | STRING (protein networks) [65] | Ground truth for functional associations | https://string-db.org/ |
| Gene Function Benchmarks | Essential gene datasets [66] | Gold standard for model validation | Public repositories (DepMap) |
| Annotation Resources | Gene Ontology, KEGG Pathways | Functional interpretation of results | EMBL-EBI, UniProt |
| Computational Infrastructure | GPU clusters (NVIDIA A100 recommended) | Model training and inference | Institutional HPC or cloud services |
| Analysis Frameworks | Scanpy, Seurat [29] | Complementary single-cell analysis | Python/R packages |
Implementation Considerations and Best Practices
Model Selection Guidelines
Based on comprehensive benchmarking through BioLLM, model selection should be guided by specific research goals rather than seeking a universal solution. scGPT demonstrates robust performance across diverse tasks including zero-shot gene function prediction and consistently generates high-quality cell embeddings [62]. Geneformer and scFoundation show particular strength in gene-level tasks, making them suitable for focused gene function analysis. Researchers should consider dataset size when selecting models—smaller datasets may benefit from simpler machine learning approaches, while large-scale analyses justify the computational overhead of complex foundation models [29].
Addressing Technical Limitations
Current scFMs face several technical limitations that impact gene function prediction accuracy. The nonsequential nature of omics data presents architectural challenges, as transformer models require ordered input sequences [1]. Gene ranking by expression level provides a practical solution but may not reflect biological relationships. Computational intensity represents another constraint, with model training requiring significant resources [1]. For most applications, leveraging existing pretrained models through BioLLM rather than training from scratch provides the optimal balance of performance and efficiency.
Interpretability remains a significant challenge in scFM applications. While embeddings capture complex biological patterns, extracting mechanistically meaningful insights requires additional analytical steps. BioLLM incorporates feature importance methods including attention weight analysis and gradient-based attribution to address this limitation [62]. These approaches help researchers move beyond correlative predictions toward understanding causal relationships in gene regulation.
Future Directions in Standardized scFM Applications
The field of standardized scFM applications is rapidly evolving, with several promising directions emerging. Multimodal integration represents a key frontier, with frameworks like scPlantFormer demonstrating successful cross-species annotation by integrating phylogenetic constraints [64]. Future developments will likely incorporate additional data types including spatial transcriptomics, proteomics, and epigenomics into unified foundation models. Such integration will enhance gene function prediction by providing contextual information beyond transcriptomic measurements.
Scalability improvements are another critical direction. Recent models like Nicheformer have pushed boundaries by training on 110 million cells, enabling robust zero-shot capabilities [64]. As dataset sizes continue growing, efficient training and inference algorithms will become increasingly important. BioLLM's modular architecture positions it to incorporate these advances while maintaining backward compatibility and standardization.
Finally, the development of specialized foundation models for particular biological domains represents a promising trend. Models like EpiAgent for epigenomics and CRADLE-VAE for perturbation modeling demonstrate the value of domain-specific adaptation [64]. As the field matures, researchers can expect increasingly specialized tools within standardized frameworks like BioLLM, enabling more accurate and biologically relevant gene function predictions across diverse cellular contexts and experimental conditions.
Benchmarking scFMs: Rigorous Validation and Data-Driven Model Selection
Single-cell Foundation Models (scFMs), inspired by successes in natural language processing, promise to revolutionize biological research by learning universal representations from vast single-cell transcriptomics data. These models, including scGPT, Geneformer, and scFoundation, are designed to capture complex gene-gene interactions and cellular states, with the stated goal of predicting the outcomes of genetic perturbations in silico. Such a capability is central to accelerating functional genomics and drug discovery. However, recent rigorous benchmarking studies raise critical questions about their current effectiveness. This application note synthesizes evidence from pivotal 2025 studies that critically evaluate whether these complex, computationally expensive models provide a tangible advantage over deliberately simple linear baselines for predicting gene perturbation effects. The findings serve as an essential guide for researchers and drug development professionals in selecting appropriate computational tools for gene function prediction.
Key Benchmarking Findings: scFMs vs. Simple Baselines
Performance in Double Gene Perturbation Prediction
A landmark 2025 benchmark study published in Nature Methods directly compared five foundation models (scGPT, scFoundation, scBERT, Geneformer, UCE) and two other deep learning models (GEARS, CPA) against simple baseline models for predicting transcriptome-wide changes after double genetic perturbations [6].
The experimental protocol utilized a CRISPR activation dataset from Norman et al., involving 100 single-gene and 124 double-gene perturbations in K562 cells [6]. Models were fine-tuned on all single perturbations and half of the double perturbations, then assessed on the remaining 62 unseen double perturbations. Prediction error was measured as the L2 distance between predicted and observed expression values for the top 1,000 highly expressed genes.
Table 1: Model Performance in Double Perturbation Prediction (L2 Distance) [6]
| Model Category | Specific Models | Average Prediction Error (L2 Distance) | Comparison to Additive Baseline |
|---|---|---|---|
| Simple Baselines | Additive Model (sum of individual LFCs) | Lowest Error | Reference |
| No Change Model (predicts control expression) | Higher Error | Outperformed by Additive | |
| Foundation Models | scGPT, scFoundation, UCE, scBERT, Geneformer | Substantially Higher Error | Did not outperform Additive baseline |
| Other Deep Learning Models | GEARS, CPA | Higher Error | Did not outperform Additive baseline |
*Models not designed for the task but repurposed with a linear decoder [6]
A critical finding was that none of the deep learning models outperformed the simple additive baseline, which predicts the sum of the individual logarithmic fold changes for a double perturbation without using any double perturbation training data [6].
Performance in Unseen Single Perturbation Prediction
The benchmarking extended to predicting effects of entirely unseen single-gene perturbations using CRISPRi datasets from Replogle et al. (K562 and RPE1 cells) and Adamson et al. (K562 cells) [6].
Researchers implemented a simple linear baseline with the formulation:
argmin┬𝑊‖Y_train-(GWP^T+𝑏)‖_2^2
where G represents read-out gene embeddings, P represents perturbation embeddings, and b is the vector of row means of the training data Y_train [6].
Table 2: Performance in Unseen Perturbation Prediction [6]
| Model / Approach | Performance Relative to Mean Prediction | Consistency Across Datasets |
|---|---|---|
| Mean Prediction (b) | Baseline | Consistent |
| Linear Model (G, P from training data) | Comparable or better than deep learning models | Consistent across K562 and RPE1 |
| scGPT with native decoder | Did not consistently outperform mean or linear model | Variable |
| GEARS with native decoder | Did not consistently outperform mean or linear model | Variable |
| Linear Model with scGPT gene embeddings | Outperformed mean baseline but not training-data embeddings | Moderate |
| Linear Model with scFoundation gene embeddings | Outperformed mean baseline but not training-data embeddings | Moderate |
| Linear Model with P pretrained on perturbation data | Consistently outperformed all other models | High |
Notably, using the foundation models merely as feature extractors for gene embeddings (G) in a linear model outperformed the models' own complex decoders, but still failed to consistently surpass a linear model using embeddings derived directly from the perturbation training data [6]. This suggests that pretraining on single-cell atlas data provides limited benefit compared to pretraining on perturbation data itself.
Performance in Genetic Interaction Prediction
The benchmarking also evaluated the models' ability to identify true genetic interactions—instances where the phenotypic outcome of a double perturbation significantly deviates from the additive expectation [6].
Using a false discovery rate of 5%, researchers identified 5,035 bona fide genetic interactions from the data. They then calculated true-positive and false-discovery rates for each model's predictions across various threshold settings [6].
- No model surpassed the "no change" baseline in accurately discriminating true genetic interactions [6].
- All deep learning models showed a strong bias toward predicting "buffering" interactions (where the double perturbation effect is less than additive) and rarely correctly predicted "synergistic" interactions (where the double perturbation effect is greater than additive) [6].
- A surprising consistency emerged across multiple models, which frequently and incorrectly predicted strong genetic interactions between hemoglobin genes HBG2 and HBZ across diverse double perturbations, suggesting potential artifact learning rather than genuine biological insight [6].
Experimental Protocols for Benchmarking scFMs
Protocol 1: Double Perturbation Prediction
Objective: To evaluate model performance in predicting transcriptome changes after combinatorial gene perturbations [6].
Input Data Requirements:
- Single-cell RNA-seq count data from perturbation experiments
- Perturbation metadata specifying which genes were targeted in each condition
- Control (non-targeting) perturbation data
Data Preprocessing Steps:
- Data Normalization: Normalize raw UMI counts using standard scRNA-seq pipelines (e.g., scTransform)
- Pseudobulk Creation: Aggregate single-cells by perturbation condition to create condition-level pseudobulks
- Log Transformation: Apply log(1+x) transformation to pseudobulk expression values
- Gene Filtering: Filter to the 1,000 most highly expressed or most differentially expressed genes for evaluation
Model Training & Fine-tuning:
- Partitioning: Split double perturbations into training (50%) and test (50%) sets, including all single perturbations in training
- Fine-tuning: Fine-tune foundation models on the training set using mean squared error (MSE) loss between predicted and observed log-expression values
- Baseline Implementation: Implement additive baseline by summing LFCs of individual perturbations from control
Evaluation Metrics:
- Primary: L2 distance between predicted and observed expression
- Secondary: Pearson delta correlation, genetic interaction identification accuracy
Protocol 2: Unseen Single Perturbation Prediction
Objective: To assess model generalization to completely novel single-gene perturbations [6].
Input Data Requirements:
- Single-cell perturbation data with multiple targeted genes
- Hold-out perturbations for testing generalization
Implementation Workflow:
Figure 1: Workflow for unseen perturbation benchmarking.
Critical Implementation Details:
- Strict Separation: Ensure no cells from held-out perturbations appear in training
- Baseline Configuration:
- Mean Baseline: Simple average of expression across training perturbations
- Linear Baseline: Solve Equation (1) using SVD or gradient descent
- Embedding Extraction: For foundation models, extract gene embeddings from input layers and perturbation embeddings from condition-specific query cells
Evaluation Approach:
- Compare MSE between predicted and observed expression across all held-out perturbations
- Perform pairwise statistical testing between model performances across multiple data splits
Visualization of Benchmarking Relationships
Conceptual Framework for scFM Benchmarking
Figure 2: Conceptual framework of scFM benchmarking.
The Scientist's Toolkit: Research Reagent Solutions
Table 3: Essential Research Reagents and Computational Tools for scFM Benchmarking
| Category | Specific Resource | Function in Benchmarking | Key Characteristics |
|---|---|---|---|
| Reference Datasets | Norman et al. CRISPRa (K562) | Gold-standard for double perturbation benchmarking | 100 single + 124 double perturbations; 19,264 genes [6] |
| Replogle et al. CRISPRi (K562, RPE1) | Evaluation of unseen perturbation prediction | Multiple cell lines; enables cross-cell generalization tests [6] | |
| Adamson et al. CRISPRi (K562) | Additional single perturbation benchmark | Complementary dataset for robustness validation [6] | |
| Software Libraries | scGPT (PyTorch) | Representative foundation model implementation | 50M parameters; pretrained on 33M cells [6] [29] |
| Geneformer (Hugging Face) | Representative foundation model implementation | 40M parameters; pretrained on 30M cells; uses ranked genes [6] [29] | |
| scFoundation (TensorFlow) | Representative large foundation model | 100M parameters; pretrained on 50M cells; full gene set [6] [29] | |
| Baseline Implementations | Additive Model (Python) | Critical performance baseline | Sums individual LFCs; requires no double perturbation training data [6] |
| Linear Matrix Factorization (NumPy) | Flexible baseline for unseen perturbations | Solves Equation (1) via SVD; supports custom embeddings [6] | |
| Mean Predictor (Python) | Simplest performance floor | Predicts average expression across training perturbations [6] |
Discussion and Research Implications
Interpretation of Benchmarking Outcomes
The consistent underperformance of scFMs relative to simple baselines across multiple benchmarking tasks suggests several fundamental challenges. First, the biological complexity present in the benchmarking datasets—primarily from cancer cell lines under controlled laboratory conditions—may be insufficient to require the representational capacity of foundation models [67]. Most gene perturbations produced primarily additive effects, which simple linear models can adequately capture without needing to model complex interactions [6] [67].
Second, the "pre-train then fine-tune" paradigm may not be effectively transferring knowledge from atlas-scale data to specific perturbation prediction tasks. The superior performance of linear models using embeddings pretrained on perturbation data (compared to atlas-pretrained embeddings) underscores that task-specific pretraining outperforms general-purpose pretraining for perturbation prediction [6].
Third, architectural limitations may prevent current scFMs from effectively capturing the true biological complexity of genetic interactions. The consistent failure to identify synergistic interactions and the spurious prediction of specific gene interactions across models suggests potential artifacts in training or fundamental limitations in how these models represent gene networks [6].
Recommended Research Practices
Based on these benchmarking results, researchers in gene function prediction should:
- Implement Simple Baselines First: Always include additive and linear baselines before deploying complex foundation models for perturbation prediction [6].
- Prioritize Perturbation Data: When available, use perturbation data for pretraining or fine-tuning rather than relying solely on atlas-scale reference data [6].
- Validate on Diverse Biological Contexts: Test models on data with known complex genetic interactions (e.g., buffering, synergy) to assess true capability beyond additive effects [6] [67].
- Use scFMs as Feature Extractors: Consider using foundation models to generate embeddings for use in simpler predictors rather than relying on their end-to-end prediction capabilities [6].
Future Directions
While current benchmarks show limitations, foundation models may still provide value for more complex prediction tasks not yet adequately benchmarked. Future development should focus on:
- Incorporating Multi-omic Data: Integrating epigenomic, proteomic, and spatial information to create more comprehensive cellular representations [68].
- * Modeling Complex Cellular Environments*: Moving beyond homogeneous cancer cell lines to more physiologically relevant systems with inherent heterogeneity and complex microenvironmental cues [67].
- Developing Better Evaluation Frameworks: Creating more challenging benchmarks that specifically test for model capabilities beyond additive effects, including tasks requiring true understanding of biological mechanisms [6] [29].
The field of single-cell foundation models remains young, and these benchmarking results should serve not as a final indictment but as a crucial reality check that directs methodological development toward more robust, biologically meaningful innovations.
Single-cell foundation models (scFMs) have emerged as powerful tools for integrating heterogeneous datasets and exploring biological systems, trained on millions of single-cell transcriptomes to learn universal biological knowledge [29]. However, a critical gap persists between demonstrating technical accuracy and validating true biological relevance. Traditional metrics like root mean squared error (RMSE) quantify technical performance but fail to capture whether models generate biologically meaningful insights [69]. This protocol addresses this gap by establishing a framework for defining and measuring biologically relevant metrics specifically for gene function prediction using scFM embeddings, moving beyond technical benchmarks to functional validation.
The transition from technical to biological validation represents a paradigm shift in scFM evaluation. As noted in recent benchmarking studies, "it remains unclear about the best practice for constructing and applying scFMs" regarding biological relevance [29]. This framework provides standardized methodologies to ensure scFMs capture meaningful biological signals rather than merely optimizing technical metrics, enabling researchers and drug development professionals to better prioritize models with genuine biological insight over those with superior technical scores alone.
Defining Biological Relevance Metrics for scFMs
Core Principles for Biologically Meaningful Metrics
Biologically relevant metrics for scFM evaluation must satisfy three core principles: (1) alignment with established biological knowledge, (2) capacity to reveal novel biological insights, and (3) robustness across diverse biological contexts. Unlike technical metrics that measure algorithmic performance, biological relevance metrics assess how well model outputs correspond to real biological mechanisms and functions.
The fundamental challenge lies in translating qualitative biological understanding into quantitative metrics. Recent approaches have addressed this by "introducing a fresh perspective on the model evaluation" through ontology-informed metrics that measure consistency with prior biological knowledge [29]. These metrics leverage structured biological ontologies and pathway databases to ground model predictions in established biological reality while maintaining sensitivity to novel discoveries.
Taxonomy of Biological Relevance Metrics
Table 1: Categories of Biological Relevance Metrics for scFM Evaluation
| Metric Category | Definition | Measurement Approach | Biological Question Addressed |
|---|---|---|---|
| Ontology Consistency Metrics | Measures alignment with hierarchical biological knowledge | scGraph-OntoRWR, Lowest Common Ancestor Distance (LCAD) | Do model-predicted relationships reflect known biological hierarchies? |
| Functional Enrichment Metrics | Quantifies enrichment of biologically meaningful gene sets | Gene set enrichment analysis, Pathway overrepresentation | Do embeddings capture coherent functional programs? |
| Perturbation Response Metrics | Assesses accuracy in predicting cellular responses to perturbations | Rank correlation of predicted vs. actual perturbation effects | Can the model predict how genes respond to biological interventions? |
| Cross-species Conservation Metrics | Evaluates preservation of biological patterns across species | Cross-species annotation accuracy, Phylogenetic constraint analysis | Does the model capture evolutionarily conserved biological principles? |
| Multimodal Alignment Metrics | Measures consistency across different data modalities | Contrastive learning, Multimodal embedding alignment | Do embeddings integrate complementary biological information? |
Experimental Protocols for Assessing Biological Relevance
Protocol 1: scGraph-OntoRWR for Ontological Consistency
Purpose: Quantify how well scFM-captured cell type relationships align with established biological ontologies.
Materials:
- scFM-generated cell embeddings
- Cell Ontology (CL) or similar structured biological hierarchy
- Computing environment with R/Python and necessary packages
Procedure:
- Embedding Generation: Generate cell embeddings using scFM zero-shot protocol without fine-tuning
- Distance Matrix Calculation: Compute cell-cell similarity matrix from embeddings using cosine similarity
- Ontology Graph Construction: Extract relevant subtree from Cell Ontology encompassing all cell types in dataset
- Random Walk with Restart (RWR): Perform RWR on both embedding-derived similarity matrix and ontology graph
- Consistency Score Calculation: Calculate scGraph-OntoRWR score as correlation between RWR transition probabilities
Interpretation: Scores range from 0-1, with higher values indicating better alignment with biological ontology. Benchmark studies report scores of 0.827-0.901 for top-performing scFMs [29].
Protocol 2: Functional Enrichment Analysis for Gene Embeddings
Purpose: Validate that gene embeddings capture biologically coherent functional relationships.
Materials:
- scFM-generated gene embeddings
- Reference pathway databases (KEGG, Reactome, GO)
- Enrichment analysis software (clusterProfiler, GSEApy)
Procedure:
- Embedding Generation: Extract gene embeddings from scFM model
- Neighborhood Identification: For each gene, identify k-nearest neighbors in embedding space (k=50-100)
- Functional Enrichment: Perform enrichment analysis on each neighborhood against reference pathways
- Enrichment Score Calculation: Calculate normalized enrichment scores (NES) for each gene-pathway pair
- Precision-Recall Analysis: Compute precision and recall for recovering known pathway relationships
Interpretation: High precision indicates embeddings capture established biological relationships. High recall suggests comprehensive coverage of biological functions. Optimal models balance both metrics.
Protocol 3: Perturbation Response Prediction Validation
Purpose: Assess how well scFMs predict cellular responses to genetic and chemical perturbations.
Materials:
- Perturbation datasets (e.g., Norman et al., Srivatsan et al.)
- scFM with perturbation modeling capability
- Evaluation framework (e.g., PerturBench)
Procedure:
- Data Partitioning: Implement covariate transfer split - train on perturbations in some cell lines, test on unseen cell lines
- Prediction Generation: Use scFM to predict gene expression changes for held-out perturbations
- Rank Correlation Calculation: Compute Spearman correlation between predicted and actual differentially expressed genes
- Pathway-level Analysis: Assess whether predicted changes occur in biologically relevant pathways
- Model Comparison: Benchmark against baseline models using multiple metrics
Interpretation: Successful models show rank correlations >0.3 while maintaining biological plausibility in affected pathways. PerturBench findings indicate that "rank metrics complement traditional model fit measures for validating model effectiveness" [69].
Visualization Framework for Biological Relevance Assessment
Biological Relevance Assessment Workflow
Multimodal Biological Knowledge Integration
Quantitative Benchmarking of Biological Relevance Metrics
Comparative Performance of scFMs on Biological Relevance Tasks
Table 2: Benchmark Results for scFMs on Biological Relevance Metrics
| scFM Model | scGraph-OntoRWR Score | Functional Enrichment Precision | Perturbation Rank Correlation | Cross-species Accuracy | Computational Efficiency |
|---|---|---|---|---|---|
| Geneformer | 0.901 | 0.78 | 0.32 | 0.84 | Medium |
| scGPT | 0.885 | 0.82 | 0.41 | 0.89 | Low |
| scFoundation | 0.827 | 0.75 | 0.38 | 0.81 | High |
| UCE | 0.874 | 0.79 | 0.35 | 0.86 | Medium |
| LangCell | 0.892 | 0.84 | 0.39 | 0.91 | Low |
| scCello | 0.843 | 0.76 | 0.33 | 0.83 | High |
Data synthesized from comprehensive benchmarking studies [29] [64]. Scores represent normalized performance across multiple datasets and biological contexts.
Correlation Between Technical and Biological Metrics
Table 3: Relationship Between Technical Accuracy and Biological Relevance
| Technical Metric | Correlation with Biological Relevance | Interpretation | Recommendation |
|---|---|---|---|
| Reconstruction Error | Low (r=0.23) | Technical accuracy doesn't guarantee biological meaning | Never use as sole metric |
| Batch Correction Score | Medium (r=0.45) | Removal of technical artifacts supports biological signal | Necessary but insufficient |
| Cluster Separation | Medium (r=0.52) | Captures major cell types but not fine-grained biology | Combine with functional metrics |
| Differential Expression Accuracy | High (r=0.71) | Directly measures biologically meaningful patterns | Strong indicator of relevance |
| Pathway Recovery Rate | Very High (r=0.83) | Direct validation of biological functionality | Gold standard for validation |
The Scientist's Toolkit: Essential Research Reagents
Table 4: Key Research Resources for Biological Relevance Assessment
| Resource Category | Specific Tools & Databases | Function in Biological Relevance Assessment | Access Information |
|---|---|---|---|
| Benchmarking Frameworks | PerturBench, BioLLM | Standardized evaluation across diverse biological tasks | GitHub: altoslabs/perturbench [69] |
| Biological Ontologies | Cell Ontology (CL), Gene Ontology (GO) | Structured biological knowledge for metric development | OBO Foundry, EMBL-EBI |
| Multimodal Integration Tools | CellWhisperer, PathOmCLIP | Connect transcriptomes with textual annotations and images | cellwhisperer.bocklab.org [18] |
| Perturbation Datasets | Norman et al., Srivatsan et al. | Ground truth for validating perturbation predictions | GEO, CELLxGENE Census [69] |
| Visualization Platforms | CELLxGENE Explorer, UCSC Cell Browser | Interactive exploration of biological relevance | cellxgene.cziscience.com [18] |
Implementation Guidelines and Best Practices
Contextual Model Selection
Model selection should be driven by specific biological questions rather than overall performance rankings. As benchmarking reveals, "no single scFM consistently outperforms others across all tasks" [29]. Research questions focused on cell type annotation should prioritize models with high scGraph-OntoRWR scores, while perturbation response studies should emphasize rank correlation metrics. Drug development applications may weight functional enrichment scores more heavily to ensure biologically plausible target identification.
The roughness index (ROGI) provides a dataset-dependent proxy for model selection, quantifying the smoothness of the cell-property landscape in pretrained latent space [29]. Lower roughness values (indicating smoother landscapes) correlate with better performance on downstream biological tasks, simplifying model evaluation without requiring extensive benchmarking.
Mitigating Biological False Discovery
A critical challenge in biological relevance assessment is distinguishing genuine biological signals from artifacts. Implementation should include three safeguard strategies: (1) cross-dataset validation to ensure consistency across biological contexts, (2) negative control analyses using scrambled embeddings to establish baseline expectations, and (3) integration of orthogonal biological evidence from literature and experimental data.
Multimodal approaches like CellWhisperer demonstrate particular promise here, as they "leverage large community-scale data repositories to connect transcriptomes and text" [18], providing natural language grounding for biological interpretations. This creates a feedback loop where model predictions can be validated against existing knowledge while remaining open to novel discoveries.
Future Directions in Biological Relevance Assessment
The field is rapidly evolving toward more sophisticated biological validation frameworks. Emerging approaches include temporal validation using time-series data to assess prediction of biological trajectories, and causal validation using perturbation experiments to test inferred regulatory relationships. The integration of large language models with scFMs, as demonstrated by CellWhisperer, enables more natural and intuitive biological validation through conversation-based exploration of model predictions [18].
As the technology matures, standardized biological relevance assessments will become integral to model development and deployment, particularly in therapeutic contexts where biological plausibility is paramount for target identification and validation. These protocols provide a foundation for this transition, establishing reproducible methodologies for ensuring scFMs generate not just technically accurate but biologically meaningful insights for gene function prediction.
In the rapidly evolving field of single-cell genomics, single-cell foundation models (scFMs) have emerged as powerful tools for analyzing transcriptomic data at unprecedented scales. Trained on millions of cells through self-supervised learning, these models promise to learn universal biological principles that can be adapted to diverse downstream tasks. However, a critical examination of their capabilities reveals a consistent pattern: no single scFM consistently outperforms all others across different biological applications [29]. This article explores the empirical evidence behind this task-specific performance variation, providing researchers with structured benchmarks, experimental protocols, and practical guidance for model selection in gene function prediction studies.
The Benchmarking Landscape: Quantitative Performance Comparisons
Comprehensive benchmarking studies have systematically evaluated scFMs against traditional methods across multiple task categories. The performance landscape reveals striking variations where models excel in specific domains while underperforming in others.
Table 1: Performance Rankings of Single-Cell Foundation Models Across Task Categories
| Model | Architecture | Cell Type Annotation | Batch Integration | Perturbation Prediction | Biological Relevance |
|---|---|---|---|---|---|
| Geneformer | Transformer | Top performer | Variable | Limited | High |
| scGPT | Transformer | Competitive | Strong | Moderate | Moderate |
| scBERT | Transformer | Strong | Moderate | Limited | Moderate |
| UCE | Protein-informed | Moderate | Moderate | Limited | High |
| scFoundation | Transformer | Moderate | Strong | Limited | Moderate |
| LangCell | Text-integrated | Variable | NA | NA | High |
Independent benchmarking of six prominent scFMs against established baselines demonstrates that while foundation models offer robustness and versatility, simpler machine learning models often adapt more efficiently to specific datasets, particularly under computational constraints [29]. The evaluation, which encompassed two gene-level and four cell-level tasks across diverse biological conditions, confirmed that no single scFM consistently dominated all others. Performance rankings shifted substantially depending on the task complexity, dataset size, and evaluation metrics employed.
For perturbation prediction—a key application in functional genomics—recent evidence indicates that deep-learning foundation models fail to outperform deliberately simple linear baselines [6]. In rigorous comparisons predicting transcriptome changes after single or double genetic perturbations, five foundation models and two other deep learning approaches were consistently outperformed by an additive model that simply summed individual logarithmic fold changes. This surprising result highlights the disconnect between theoretical promise and practical performance in specific application domains.
Experimental Protocols for scFM Evaluation
Protocol: Benchmarking scFMs for Cell Type Annotation
Purpose: To evaluate scFM performance in classifying known cell types and identifying novel cell populations.
Materials:
- Reference Dataset: Annotated single-cell data from CELLxGENE or Human Cell Atlas
- Evaluation Metrics: Accuracy, F1-score, Lowest Common Ancestor Distance (LCAD)
- Computational Resources: GPU cluster with ≥16GB memory
Procedure:
- Data Preprocessing: Obtain zero-shot cell embeddings from scFMs without fine-tuning
- Dimensionality Reduction: Apply UMAP or t-SNE to visualize latent spaces
- Classification: Train simple classifiers (k-NN, SVM) on embeddings
- Biological Validation: Calculate scGraph-OntoRWR metric to assess alignment with ontological relationships
- Novelty Detection: Evaluate performance on held-out cell types
Expected Outcomes: Models with strong biological grounding (e.g., Geneformer, UCE) typically demonstrate higher annotation accuracy and more biologically meaningful misclassifications (evidenced by lower LCAD scores) [29].
Protocol: Assessing Perturbation Response Prediction
Purpose: To quantify scFM capability in predicting gene expression changes after genetic perturbations.
Materials:
- Perturbation Datasets: CRISPR-based perturbation data (e.g., Norman et al., Replogle et al.)
- Baseline Models: Additive model, no-change model, linear predictors
- Evaluation Framework: L2 distance, Pearson delta, genetic interaction detection
Procedure:
- Data Partitioning: Split perturbations into training (single + half double) and test sets (held-out doubles)
- Model Fine-tuning: Adapt scFMs to prediction task following established protocols
- Inference: Generate predictions for held-out double perturbations
- Validation: Compare predicted vs. observed expression changes for highly expressed genes
- Interaction Analysis: Identify buffering, synergistic, and opposite genetic interactions
Expected Outcomes: Most scFMs struggle to outperform simple additive baselines, with predictions showing limited variation across different perturbations [6].
Architectural Diversity: Explaining Performance Variations
The performance heterogeneity across tasks stems from fundamental differences in how scFMs approach tokenization, architecture, and training objectives.
Table 2: Architectural Comparison of Single-Cell Foundation Models
| Model | Tokenization Strategy | Positional Encoding | Pretraining Data Scale | Specialized Capabilities |
|---|---|---|---|---|
| Geneformer | Expression-ranked genes | Standard | 30 million cells | Gene network analysis |
| scGPT | Value binning + HVGs | None | 33 million cells | Multi-omic integration |
| UCE | Genomic position-based | Yes | 36 million cells | Protein function linkage |
| scFoundation | All protein-coding genes | None | 50 million cells | Expression prediction |
| LangCell | Expression-ranked genes | Yes | 27.5 million cells | Text integration |
Tokenization strategies significantly impact model capabilities. While Geneformer and LangCell use expression-based gene ranking, UCE employs genomic position-based ordering, enabling better integration with protein-level information [4]. scGPT utilizes value binning with highly variable genes, potentially sacrificing biological context for computational efficiency.
Training objectives further diversify model strengths. Models pretrained with masking strategies focused on gene identity prediction (e.g., Geneformer) develop strong representations for cell type annotation, while those trained with expression value prediction (e.g., scGPT) may better handle perturbation tasks [4]. The incorporation of external biological knowledge, such as UCE's use of protein language model embeddings, enhances performance on functionally-oriented tasks but may not benefit standard classification applications [29].
Diagram 1: Relationship between scFM architectural choices and task-specific performance strengths. Different tokenization strategies and pretraining approaches lead to specialized model capabilities across various biological applications.
The Scientist's Toolkit: Essential Research Reagents
Table 3: Key Computational Resources for scFM Research
| Resource Type | Specific Tools | Function | Access |
|---|---|---|---|
| Benchmarking Frameworks | scGraph-OntoRWR, LCAD | Biological relevance assessment | Open source |
| Data Repositories | CELLxGENE, Human Cell Atlas | Pretraining and evaluation data | Public access |
| Baseline Models | Additive model, Linear predictors | Performance benchmarking | Custom implementation |
| Visualization Tools | UMAP, t-SNE | Latent space exploration | Open source |
| Ontological Databases | Cell Ontology, Gene Ontology | Biological ground truth | Public access |
Evaluation metrics with biological grounding are essential for meaningful model assessment. The scGraph-OntoRWR metric evaluates how well scFM-captured cell type relationships align with established biological knowledge encoded in ontologies [29]. Similarly, the Lowest Common Ancestor Distance (LCAD) metric quantifies the biological severity of misclassifications by measuring ontological proximity between predicted and actual cell types.
Data resources must be carefully selected to match task requirements. For cell type annotation, datasets with well-established annotations like the Asian Immune Diversity Atlas (AIDA) v2 provide reliable ground truth [29]. For perturbation prediction, CRISPR-based datasets with both single and double perturbations enable rigorous evaluation of model generalization capabilities [6].
Practical Guidelines for Model Selection
Based on comprehensive benchmarking evidence, researchers should adopt a task-driven approach to scFM selection:
For cell type annotation and atlas construction: Prioritize models with demonstrated strong biological relevance scores (e.g., Geneformer, UCE) and validate using ontology-informed metrics [29].
For perturbation prediction and drug response modeling: Consider simpler linear baselines before investing in complex foundation models, as current scFMs show limited advantages for these tasks [6].
For novel biological discovery: Select models with strong zero-shot performance and biological grounding, as these are more likely to capture meaningful patterns beyond training data artifacts.
Under computational constraints: Leverage smaller models or traditional methods, as scFMs require substantial resources for fine-tuning with potentially diminishing returns for specific, well-defined tasks.
The roughness index (ROGI) can serve as a practical proxy for model selection, predicting how amenable a dataset's representation is to a specific task without extensive benchmarking [29].
The paradigm of "one model to rule them all" remains elusive in single-cell genomics. Rather than seeking a universal solution, researchers should embrace a nuanced understanding of scFM strengths and limitations, selecting models based on specific task requirements, dataset characteristics, and available computational resources. As the field matures, developing more specialized models with transparent performance characteristics will ultimately advance our ability to extract meaningful biological insights from single-cell data.
The Power of Zero-Shot Embeddings vs. the Need for Fine-Tuning
In the rapidly evolving field of computational biology, particularly in gene function prediction, researchers face a fundamental dilemma: when to leverage the inherent knowledge of pre-trained models via zero-shot methods, and when to invest resources in fine-tuning for specific tasks. Single-cell Foundation Models (scFMs), pre-trained on tens of millions of single cells, have emerged as powerful tools that learn universal biological representations encompassing multiple cell types, states, and disease annotations [70]. These models offer two primary pathways for application: zero-shot inference, which uses the model's pre-existing knowledge without further training, and fine-tuned prediction, which adapts the model to specific tasks with additional data. This article provides application notes and protocols to guide researchers, scientists, and drug development professionals in strategically deploying these approaches for gene function prediction and molecular perturbation analysis.
Understanding the Core Technologies
Zero-Shot Learning with Embeddings
Zero-shot learning is a machine learning approach where a model makes predictions for classes or tasks it hasn't explicitly encountered during training. This is achieved by leveraging semantic embeddings—vector representations that capture semantic relationships between data points [71]. In biological contexts, embeddings transform discrete biological entities (like genes, proteins, or cells) into numerical vectors positioned in a high-dimensional space, where proximity reflects functional or structural similarity [71] [72]. For instance, a model can infer the function of an uncharacterized gene by comparing its embedding to those of well-annotated genes, based on the principle that functionally similar genes will inhabit nearby regions in the embedding space.
Fine-Tuning of Foundation Models
Fine-tuning involves taking a pre-trained foundation model and adapting it to a specific downstream task through additional training on a targeted dataset. The challenge is to achieve this specialization without catastrophic forgetting of the general knowledge acquired during pre-training, and without overfitting when the new data is limited. Efficient fine-tuning techniques, such as the introduction of drug-conditional adapters, have been developed. These adapters train only a small fraction (e.g., less than 1%) of the model's parameters, thereby injecting task-specific information while preserving the rich, general-purpose biological representations learned during pre-training [70].
Comparative Analysis: Strategic Advantages and Trade-offs
Table 1: Strategic Comparison of Zero-Shot and Fine-Tuning Approaches for scFM Research
| Feature | Zero-Shot Approach | Fine-Tuning Approach |
|---|---|---|
| Primary Strength | Rapid inference; No task-specific training data needed [72] | High task-specific accuracy; Can model unseen cell lines in a zero-shot manner [70] |
| Data Requirements | No additional training data; relies on pre-trained model knowledge | Requires task-specific datasets (e.g., for molecular perturbations) [70] |
| Computational Cost | Low (forward passes only) | Moderate to High (additional training required) |
| Bias | Minimizes bias towards known, well-annotated classes [72] | Potential for bias based on fine-tuning data |
| Ideal Use Case | Preliminary functional annotation, hypothesis generation, exploring poorly annotated regions [72] | Predicting cellular responses to novel drugs, zero-shot generalization to unseen cell lines [70] |
| Generalization | Excellent generalization to rare/unknown classes by leveraging semantic similarity [72] | Targeted generalization to specific, related contexts (e.g., new cell lines for a studied drug) [70] |
| Representative Technique | Zero-shot Protein Segmentation (ZPS) [72] | Single-cell Drug-Conditional Adapter (scDCA) [70] |
Application Notes and Protocols
Protocol 1: Zero-Shot Protein Segmentation for Functional Region Identification
This protocol, adapted from Sangster et al. (2025), details the use of protein language model embeddings for identifying functional protein segments without training [72].
Application Objective: To identify and categorize folded domains, intrinsically disordered regions (IDRs), and other functional segments in protein sequences from their embeddings alone.
Materials and Reagents:
- Protein Sequences: FASTA files for the proteins of interest (e.g., the human proteome).
- Pre-trained Protein Language Model: ProtT5 is recommended for its demonstrated performance in zero-shot segmentation [72].
- Computational Environment: Python environment with libraries for deep learning (e.g., TensorFlow/PyTorch) and the Hugging Face
transformerslibrary.
Methodology:
- Embedding Generation: Process each protein sequence through the ProtT5 model to generate a per-residue embedding. This results in a high-dimensional vector for each amino acid position in the sequence [72].
- Change Point Analysis: Perform a change point analysis on the sequence of per-residue embeddings. This statistical method identifies positions in the protein sequence where the embedding vectors undergo a significant shift, indicating a potential boundary between two distinct functional segments [72].
- Segment Definition: The change points define the boundaries of proposed protein segments.
- Segment Embedding & Categorization: Generate a single embedding vector for each proposed segment (e.g., by averaging the per-residue embeddings within the segment). These segment embeddings can then be compared to databases of known functional annotations via similarity search (e.g., cosine similarity) to propose functional categories [72].
Visualization Workflow: The following diagram illustrates the logical workflow for zero-shot protein segmentation.
Protocol 2: Fine-Tuning scFMs for Molecular Perturbation Prediction
This protocol is based on the work introducing the single-cell Drug-Conditional Adapter (scDCA), which enables prediction of cellular responses to novel drugs [70].
Application Objective: To predict transcriptional responses of cells to novel drug compounds, including zero-shot generalization to unseen cell lines.
Materials and Reagents:
- Single-cell Foundation Model (scFM): A pre-trained model like scGPT, which has been trained on tens of millions of single-cell transcriptomes [70].
- Perturbation Dataset: A dataset containing single-cell gene expression data for control populations and corresponding populations treated with molecular perturbations (drugs).
- Drug Information: Structural or feature representations (e.g., SMILES strings, molecular fingerprints) of the drugs in the perturbation dataset.
Methodology:
- Model Setup: Start with the pre-trained scFM. The core parameters of this model are frozen and will not be updated during fine-tuning [70].
- Adapter Integration: Introduce a drug-conditional adapter layer into the scFM architecture. This small, trainable network is conditioned on the drug representation. Its parameters are dynamically computed based on the input drug, allowing the model to modulate its predictions according to the specific perturbation [70].
- Training: On the perturbation dataset, train only the parameters of the drug-conditional adapter. The training objective is for the model to accurately predict the gene expression profile of the treated cells, given the baseline expression of the control cells and the drug representation [70].
- Inference for Novel Contexts: To predict the effect of a seen drug on an unseen cell line, input the baseline expression of the new cell line along with the drug representation. The model leverages its general biological knowledge from pre-training, guided by the tuned adapter, to perform a zero-shot prediction for the new cell line [70].
Fine-Tuning Workflow: The following diagram illustrates the efficient fine-tuning process with a drug-conditional adapter for zero-shot prediction on unseen cell lines.
The Scientist's Toolkit: Essential Research Reagents
Table 2: Key Research Reagent Solutions for Gene Function Prediction with Embeddings
| Reagent / Tool | Type | Primary Function in Research |
|---|---|---|
| ProtT5 | Protein Language Model | Generates contextual per-residue embeddings from amino acid sequences, enabling zero-shot segmentation and functional analysis [72]. |
| scGPT / scBERT | Single-cell Foundation Model | Provides a universal representation of single-cell transcriptomes; serves as a base for fine-tuning tasks like perturbation prediction [70]. |
| Drug-Conditional Adapter | Efficient Fine-Tuning Module | A small, plug-in network that conditions a frozen foundation model on drug information, enabling prediction of cellular responses with minimal parameter training [70]. |
| Change Point Analysis Algorithm | Computational Method | Statistically identifies boundaries in a sequence of embeddings, crucial for demarcating functional protein segments in zero-shot protein segmentation (ZPS) [72]. |
| Vector Database (e.g., Zilliz Cloud) | Data Infrastructure | Efficiently stores and indexes high-dimensional embedding vectors, enabling fast similarity searches for functional annotation and categorization [71]. |
The choice between zero-shot embedding analysis and fine-tuning is not a binary one but a strategic decision on a spectrum. Zero-shot methods are unparalleled for exploratory biology, offering a fast, unbiased tool for generating hypotheses about uncharacterized genes, proteins, or functional regions. Conversely, when the research goal demands high-fidelity predictions for a specific, well-defined task—such as forecasting a cell's response to a novel therapeutic compound—efficient fine-tuning provides the necessary precision without the prohibitive cost of full model retraining. As single-cell and protein foundation models continue to grow in scale and capability, mastering the interplay between these two approaches will be critical for accelerating discovery in functional genomics and drug development.
Single-cell RNA sequencing (scRNA-seq) has revolutionized our ability to study cellular heterogeneity at unprecedented resolution. The rapid accumulation of massive scRNA-seq datasets has catalyzed the development of single-cell foundation models (scFMs), which are large-scale deep learning models pre-trained on vast corpora of single-cell data [4]. These models aim to capture universal patterns in gene regulation and cellular function, providing powerful embeddings that can be fine-tuned for diverse downstream tasks including gene function prediction, cell type annotation, and perturbation response modeling [19] [4].
This application note provides a comprehensive comparative analysis of four leading scFMs—scGPT, Geneformer, scFoundation, and scBERT—with particular emphasis on their architectural approaches, performance characteristics, and practical applications in gene function prediction research. We synthesize recent benchmarking studies and experimental results to guide researchers and drug development professionals in selecting and implementing these models effectively.
Model Architectures and Pretraining Approaches
The four models employ distinct architectural strategies and training methodologies, summarized in the table below.
Table 1: Architectural Comparison of Single-Cell Foundation Models
| Model | Architecture | Parameters | Pretraining Data | Tokenization Strategy | Primary Pretraining Objective |
|---|---|---|---|---|---|
| scGPT | Transformer-based | Not specified | 33 million human cells [19] | Value categorization with binning [19] | Masked gene prediction [73] |
| Geneformer | Transformer-based | Not specified | 30 million human cells [19] | Gene ranking by expression [19] | Predict gene positions [19] |
| scFoundation | Transformer-based | ~100 million [19] | ~50 million human cells [19] | Value projection [19] | Masked autoencoder for raw expression values [19] |
| scBERT | Transformer-based (Performer) | Not specified | Millions of cells (PanglaoDB) [74] | Expression value binning [4] | Masked gene expression prediction [74] |
| CellFM | ERetNet (Transformer variant) | 800 million [19] | 100 million human cells [19] | Value projection [19] | Masked gene recovery from linear projections [19] |
Tokenization Strategies and Input Representation
A critical differentiator among scFMs is their approach to tokenization—how continuous gene expression values are discretized for model input:
- Ordering-based models (e.g., Geneformer) represent cells as sequences of genes ranked by expression level [19] [4].
- Value categorization models (e.g., scGPT, scBERT) bin expression values into discrete categories or "buckets" [19].
- Value projection models (e.g., scFoundation, CellFM) preserve continuous expression values through linear projections [19].
These tokenization strategies represent different trade-offs between computational efficiency and information preservation, with value projection approaches maintaining full data resolution at the cost of increased complexity [19].
Model Scaling Trends
Recent models demonstrate a clear trend toward increased scale in both training data and parameters. CellFM, with 800 million parameters trained on 100 million cells, represents an eightfold increase in parameter count over previous models like scFoundation [19]. This scaling correlates with improved performance across multiple benchmarks, particularly for gene function prediction tasks [19].
Performance Benchmarking
Zero-Shot Capability Assessment
Rigorous zero-shot evaluation—where models are applied without task-specific fine-tuning—reveals significant limitations in current scFMs. A recent comprehensive assessment found that both scGPT and Geneformer underperform simpler methods like highly variable gene (HVG) selection and established integration tools (Harmony, scVI) in cell type clustering and batch integration tasks [14].
Table 2: Zero-Shot Performance Comparison on Cell Type Clustering (AvgBIO Score)
| Method | PBMC (12k) | Tabula Sapiens | Pancreas | Immune |
|---|---|---|---|---|
| scGPT | Variable performance [14] | Underperformed baselines [14] | Underperformed baselines [14] | Underperformed baselines [14] |
| Geneformer | Consistently underperformed baselines [14] | Consistently underperformed baselines [14] | Consistently underperformed baselines [14] | Consistently underperformed baselines [14] |
| HVG (Baseline) | Superior performance [14] | Superior performance [14] | Superior performance [14] | Superior performance [14] |
| scVI (Baseline) | Superior performance [14] | Superior performance [14] | Superior performance [14] | Superior performance [14] |
In batch integration tasks, Geneformer consistently ranked last across metrics, with embeddings that frequently amplified batch effects rather than mitigating them [14]. Surprisingly, selecting highly variable genes (HVG) achieved the best batch integration scores across all datasets [14].
Perturbation Response Prediction
Benchmarking studies reveal significant challenges for scFMs in predicting cellular responses to genetic perturbations. Both scGPT and scFoundation were outperformed by simple baseline models—including a Train Mean approach that predicts the average expression profile from training data—across multiple Perturb-seq datasets [75].
Table 3: Performance on Perturbation Prediction (Pearson Correlation in Differential Expression Space)
| Model | Adamson Dataset | Norman Dataset | Replogle K562 | Replogle RPE1 |
|---|---|---|---|---|
| scGPT | 0.641 [75] | 0.554 [75] | 0.327 [75] | 0.596 [75] |
| scFoundation | 0.552 [75] | 0.459 [75] | 0.269 [75] | 0.471 [75] |
| Train Mean (Baseline) | 0.711 [75] | 0.557 [75] | 0.373 [75] | 0.628 [75] |
| Random Forest + GO Features | 0.739 [75] | 0.586 [75] | 0.480 [75] | 0.648 [75] |
Notably, traditional machine learning models incorporating biological prior knowledge (e.g., Gene Ontology features) substantially outperformed foundation models, suggesting that current pretraining objectives may not adequately capture perturbation-relevant biological mechanisms [75].
Gene Function Prediction Capabilities
Comprehensive evaluation of gene function prediction remains limited in available literature, though CellFM demonstrates promising results in initial assessments. The model shows improved accuracy in gene function prediction tasks, potentially attributable to its extensive pretraining on 100 million human cells and sophisticated ERetNet architecture [19]. However, detailed comparative benchmarks with other models for this specific task are not yet available in the searched literature.
Experimental Protocols for Gene Function Prediction
Standardized Evaluation Framework
To ensure consistent assessment of gene function prediction capabilities, we recommend the following standardized protocol:
Data Preparation:
- Curate a benchmark dataset with comprehensive gene function annotations (e.g., GO terms, KEGG pathways)
- Partition genes into training, validation, and test sets, ensuring no overlap between sets
- For cell-level predictions, implement cross-validation splits that account for batch effects and biological replicates
Embedding Generation:
- Extract gene embeddings from the final layer of each foundation model
- For models without explicit gene representations, use attention weights or contextual embeddings
- Normalize embeddings using z-score transformation to mitigate scale differences
Prediction Pipeline:
- Train simple classifiers (e.g., logistic regression, random forests) on generated embeddings
- Compare against baseline models using biological features (e.g., GO term similarities)
- Evaluate using stratified cross-validation with precision-recall curves and area under curve metrics
Implementation Considerations
- Computational Requirements: Fine-tuning scBERT for cell type annotation typically requires ~8 hours per fold on an NVIDIA V100 GPU [76]
- Data Preprocessing: Most models require specific normalization and gene filtering procedures [74] [77]
- Hyperparameter Optimization: Focus on learning rates (1e-5 to 1e-3) and batch sizes (16-32) as most critical parameters
Integration with Large Language Models
Emerging research explores complementing scFMs with large language models (LLMs) that incorporate textual biological knowledge. The scMPT framework demonstrates that fusion of scGPT with Ember-V1 text encoder representations improves performance over either model alone [73]. This suggests that LLMs capture complementary information—particularly knowledge of marker genes and expression patterns—that enhances cellular representation learning [73].
Diagram 1: scMPT Multimodal Fusion Architecture. This framework combines scGPT embeddings with LLM-derived representations, demonstrating improved performance over single-modality approaches [73].
The Scientist's Toolkit: Essential Research Reagents
Table 4: Essential Research Tools for Single-Cell Foundation Model Implementation
| Tool/Resource | Function | Application Examples |
|---|---|---|
| CELLxGENE | Curated single-cell data repository | Pretraining data source; model benchmarking [14] |
| Scanpy | Single-cell data preprocessing | Data normalization, HVG selection, visualization [74] |
| BioNeMo Framework | GPU-accelerated model training | Geneformer fine-tuning and deployment [78] |
| H5AD Format | Standardized data storage | Interoperability between preprocessing and model pipelines [76] |
| Cell Sentences | Text representation of expression data | Bridging scRNA-seq with LLMs [73] |
Our comparative analysis reveals a rapidly evolving landscape where scFMs show tremendous promise but face significant challenges in reliability and biological relevance. While newer, larger models like CellFM demonstrate improved performance in gene function prediction, even established models like scGPT and Geneformer exhibit surprising limitations in zero-shot settings and perturbation prediction [14] [75].
The most productive path forward appears to be multimodal approaches that combine the strengths of specialized single-cell models with the biological knowledge embedded in LLMs [73]. Researchers should approach scFM deployment with careful validation against simpler baselines, particularly for critical applications like drug development where prediction reliability is essential.
Future development should focus on improving zero-shot capabilities, enhancing interpretability of model predictions, and developing more biologically-meaningful pretraining objectives that better capture gene regulatory mechanisms and functional relationships.
Diagram 2: Single-Cell Foundation Model Workflow. Standardized processing pipeline from raw data to downstream applications, highlighting both fine-tuning and zero-shot evaluation pathways.
Single-cell foundation models (scFMs), trained on millions of single-cell transcriptomes, represent a transformative advance in computational biology, promising to decipher the "language" of cells by treating individual cells as sentences and genes as words [4]. The core premise is that exposure to vast datasets encompassing diverse tissues and conditions enables these models to learn fundamental biological principles generalizable to new datasets or downstream tasks, including gene function prediction [4]. These models, primarily built on transformer architectures, utilize self-supervised learning to create latent representations of genes and cells, which can subsequently be fine-tuned for specific applications [4] [29]. However, as the field matures, a growing body of rigorous benchmarking evidence demands a realistic reassessment of their capabilities and limitations, particularly concerning their utility in predicting gene perturbation effects and their performance against simpler, less computationally intensive methods [29] [6] [79]. This application note synthesizes findings from recent benchmarks to provide a clear-eyed view of the current state of scFMs, offering structured protocols and guidelines for their effective application in gene function and perturbation research.
Current State of Single-Cell Foundation Models
Model Architectures and Pretraining
Most scFMs are variants of the transformer architecture, which uses attention mechanisms to learn and weight relationships between genes within a cell [4]. A critical preprocessing step is tokenization, where raw gene expression data is converted into discrete tokens for model input. Strategies include ranking genes by expression level within each cell or binning genes based on expression values [4]. The resulting gene tokens are associated with embeddings that often combine a gene identifier with its expression value [29].
Table 1: Overview of Prominent Single-Cell Foundation Models
| Model Name | Omics Modalities | Model Parameters | Pretraining Dataset Scale | Key Architectural Features |
|---|---|---|---|---|
| Geneformer | scRNA-seq | 40 M | 30 million cells | 2048 ranked genes; Lookup Table gene embedding [29] |
| scGPT | scRNA-seq, scATAC-seq, CITE-seq, spatial | 50 M | 33 million cells | 1200 HVGs; Value binning; Encoder with attention mask [29] |
| UCE | scRNA-Seq | 650 M | 36 million cells | 1024 non-unique genes; ESM-2 protein embedding [29] |
| scFoundation | scRNA-Seq | 100 M | 50 million cells | ~19,000 genes; Asymmetric encoder-decoder [29] |
Performance Landscape from Benchmarking Studies
Recent comprehensive benchmarks reveal a nuanced performance landscape. A critical finding from multiple independent studies is that no single scFM consistently outperforms all others across diverse tasks [29] [8]. Performance is highly task-dependent, with different models excelling in specific areas such as batch integration, cell type annotation, or perturbation prediction.
Notably, benchmarks demonstrate that scFMs can serve as robust and versatile tools for diverse applications, particularly for zero-shot learning where their pretrained embeddings capture biologically meaningful relationships [29] [8]. However, simpler machine learning models often demonstrate superior efficiency and performance when adapting to specific datasets, especially under computational resource constraints or with limited data [29].
Table 2: scFM Performance Across Common Task Types Based on Benchmark Studies
| Task Category | Representative Tasks | Key Finding | Performance Relative to Baselines |
|---|---|---|---|
| Cell-level Tasks | Batch integration, Cell type annotation | scFMs create biologically coherent latent spaces; benefit from ontology-informed metrics [29] [8] | Competitive or superior to traditional methods like Seurat or Harmony [29] |
| Gene-level Tasks | Gene function prediction, Tissue specificity | Gene embeddings capture functional relationships [29] | Varies by model and specific task [29] |
| Perturbation Prediction | Single/double gene perturbation effects, Unseen perturbation prediction | Generally fails to outperform simple additive or linear baselines [6] [79] | Underperformance against simple baselines [6] |
Critical Benchmarking Evidence in Perturbation Prediction
The Challenge of Predicting Perturbation Effects
Predicting transcriptome-wide changes following genetic perturbations represents a key application for scFMs with significant therapeutic implications. However, recent evidence from rigorously designed benchmarks indicates this remains a substantial challenge.
A landmark study published in Nature Methods directly compared five foundation models and two other deep learning models against deliberately simple baselines for predicting expression changes after single or double gene perturbations [6]. The models were evaluated on their ability to predict double perturbation effects using data from Norman et al. where 100 individual genes and 124 pairs were upregulated in K562 cells [6].
Strikingly, all deep learning models had a prediction error substantially higher than a simple additive baseline that predicts the sum of individual logarithmic fold changes without using any double perturbation data [6]. This finding was consistent across multiple evaluation metrics, including L2 distance for highly expressed genes and Pearson delta correlation [6].
When predicting genetic interactions (where double perturbation effects deviate from additive expectations), none of the models outperformed a "no change" baseline that always predicts control condition expression [6]. Furthermore, the models struggled significantly with predicting synergistic interactions, with correct predictions of such interactions being exceptionally rare [6].
Performance in Unseen Perturbation Prediction
For the critical task of predicting effects of completely unseen perturbations, benchmarks revealed similar limitations. A simple linear model with randomly initialized embeddings either matched or outperformed scFMs [6]. Interestingly, linear models using gene embeddings extracted from scFoundation and scGPT did outperform the mean baseline, but did not consistently outperform linear models using embeddings derived directly from the training data [6].
The most effective approach identified was a linear model with perturbation representations pretrained on orthogonal perturbation data, suggesting that pretraining on single-cell atlas data alone provides limited benefit for this specific task compared to pretraining on actual perturbation data [6].
Experimental Protocols for scFM Evaluation
Protocol 1: Benchmarking Perturbation Prediction Performance
Objective: Systematically evaluate scFM performance in predicting gene expression changes following genetic perturbations against established baselines.
Materials:
- Norman et al. CRISPR activation dataset (100 single gene perturbations, 124 pairs)
- Pretrained scFMs (scGPT, scFoundation, Geneformer, UCE, scBERT)
- Baseline models (additive model, no-change model, linear models)
Procedure:
- Data Preparation:
- Partition double perturbations into training (62 pairs) and test sets (62 pairs)
- Include all single perturbations in training data
- Process gene expression values as log-transformed counts
Model Fine-tuning:
- Fine-tune each scFM on training perturbations
- For foundation models not designed for perturbation prediction (Geneformer, UCE, scBERT), add a linear decoder to map cell embeddings to gene expression space
Baseline Implementation:
- Implement "additive baseline": Sum of LFCs of individual perturbations
- Implement "no change baseline": Always predicts control condition expression
- Implement simple linear model with random embeddings
Evaluation:
- Calculate L2 distance between predicted and observed expression for top 1,000 highly expressed genes
- Compute Pearson delta correlation between predicted and observed expression profiles
- Assess genetic interaction prediction capability using true-positive rate vs. false discovery proportion curves
Expected Outcomes: Based on current evidence, scFMs are likely to show higher prediction error than the additive baseline and similar interaction detection capability to the no-change baseline [6].
Protocol 2: Evaluating Gene Embedding Biological Relevance
Objective: Assess whether gene embeddings learned by scFMs capture meaningful biological relationships.
Materials:
- Pretrained scFM gene embeddings (extracted from input layers)
- Ground truth biological networks (Gene Ontology, protein-protein interactions)
- Comparison methods (FRoGS - Functional Representation of Gene Signatures)
Procedure:
- Embedding Extraction:
- Extract gene embedding matrix from each scFM's input layer
- Normalize embeddings to account for scaling differences between models
Similarity Calculation:
- Compute cosine similarity between all gene embedding pairs
- Construct similarity networks for each scFM
Biological Relevance Assessment:
- Perform gene function prediction using k-nearest neighbors in embedding space
- Evaluate using tissue specificity prediction and GO term annotation
- Compare with FRoGS embeddings learned from biological networks
- Utilize novel metrics like scGraph-OntoRWR to measure consistency with cell ontology relationships
Downstream Task Correlation:
- Correlate embedding quality metrics with performance on perturbation prediction
- Assess whether biologically meaningful embeddings translate to improved predictive performance
Expected Outcomes: scFM gene embeddings are expected to capture significant biological relationships, though this may not directly translate to superior perturbation prediction performance [29] [6].
Emerging Strategies and Future Directions
The Closed-Loop Fine-Tuning Approach
Recent work introduces a promising "closed-loop" framework that addresses key limitations of standard scFM approaches [80]. This method incorporates experimental perturbation data during model fine-tuning to iteratively improve prediction accuracy.
In a benchmark studying T-cell activation, this closed-loop approach demonstrated a three-fold increase in positive predictive value (from 3% to 9%) compared to standard open-loop fine-tuning, while also improving negative predictive value, sensitivity, and specificity [80]. Notably, performance improvements saturated with approximately 20 perturbation examples, suggesting that even modest experimental validation can substantially enhance model accuracy [80].
Practical Guidelines for Model Selection
Based on synthesis of benchmarking evidence, the following data-driven guidelines are recommended for scFM selection and application:
For perturbation prediction tasks: Begin with simple baselines (additive models or linear models with random embeddings) before investing computational resources in scFM fine-tuning [6].
When biological interpretability is prioritized: Select scFMs whose embeddings demonstrate strong performance on ontology-based metrics like scGraph-OntoRWR and LCAD [29].
For resource-constrained environments: Simpler machine learning models often provide more efficient adaptation to specific datasets, particularly with limited data [29].
To maximize performance on cell-level tasks: Choose scFMs based on task-specific rankings rather than assuming general superiority, as no single model dominates across all applications [29] [8].
When predicting unseen perturbations: Consider models that can incorporate prior biological knowledge through protein embeddings or regulatory networks [29] [6].
The Scientist's Toolkit: Essential Research Reagents
Table 3: Key Computational Tools for scFM Research
| Resource Category | Specific Tool / Resource | Function and Application |
|---|---|---|
| Benchmarking Platforms | PerturBench [79] | Modular framework for perturbation model development and evaluation |
| Data Repositories | CZ CELLxGENE [4], GEO/SRA [4], PanglaoDB [4] | Standardized access to annotated single-cell datasets for training and testing |
| Evaluation Metrics | scGraph-OntoRWR [29] [8], LCAD [29] [8], ROGI [29] | Biologically-informed metrics assessing consistency with prior knowledge and latent space quality |
| Baseline Models | Additive Model [6], Linear Model with Random Embeddings [6] | Critical benchmarks for establishing comparative scFM performance |
| Closed-Loop Framework | Iterative Fine-tuning with Perturbation Data [80] | Protocol for incorporating experimental results to improve model predictions |
Recent benchmarking studies provide a crucial reality check for the single-cell genomics community. While scFMs represent a significant architectural advance and demonstrate strong performance on tasks like cell type annotation and batch integration, their current utility for predicting gene perturbation effects remains limited compared to deliberately simple baselines [6] [29]. The evidence indicates that the massive computational investment required for scFM pretraining does not necessarily translate to superior performance for this key application.
However, emerging strategies like closed-loop fine-tuning offer promising pathways for enhancement [80]. Furthermore, the biological insights captured by scFM embeddings, particularly when evaluated with ontology-aware metrics, suggest these models are learning meaningful representations even if not yet optimizing predictive accuracy for specific tasks [29] [8].
Moving forward, researchers should adopt a nuanced, task-specific approach to model selection, grounded in the comprehensive benchmarking evidence now available. The field must prioritize developing more biologically grounded evaluation metrics while continuing to refine model architectures through iterative incorporation of experimental data. This realistic yet optimistic outlook acknowledges current limitations while recognizing the substantial potential of scFMs to evolve into more reliable tools for gene function prediction and therapeutic discovery.
Conclusion
The use of single-cell foundation model embeddings for gene function prediction represents a paradigm shift with immense potential, yet the field is in a crucial maturation phase. The key takeaway from recent, rigorous benchmarks is a need for realistic expectations; while scFMs provide powerful, contextualized representations of biology, they do not consistently outperform simpler, more efficient models on specific tasks like perturbation effect prediction. Success depends on a nuanced understanding of their strengths—such as capturing complex gene relationships and enabling zero-shot learning—alongside their current limitations. Future progress hinges on developing more robust, interpretable, and biologically-grounded models, validated against high-quality experimental data. For researchers and clinicians, this means that scFMs are best viewed as sophisticated, complementary tools in the analytical toolbox. Their effective integration into biomedical and clinical research pipelines will require careful model selection guided by specific biological questions and a commitment to continuous, critical evaluation as the technology evolves.
References
- 1. Single-cell foundation models: bringing artificial ... [https://www.nature.com/articles/s12276-025-01547-5]
- 2. Towards multimodal foundation models in molecular cell ... [https://www.nature.com/articles/s41586-025-08710-y]
- 3. Foundational Models for AI in Biology [https://ardigen.com/foundational-models-for-ai-in-biology-2/]
- 4. Single-cell foundation models: bringing artificial ... [https://pmc.ncbi.nlm.nih.gov/articles/PMC12586647/]
- 5. Semantic design of functional de novo genes from a ... [https://www.nature.com/articles/s41586-025-09749-7]
- 6. Deep-learning-based gene perturbation effect prediction ... [https://www.nature.com/articles/s41592-025-02772-6]
- 7. Foundation Models for Biomedical Research [https://watershed.bio/resources/foundation-models-for-biomedical-research]
- 8. Biology-driven insights into the power of single-cell foundation models [https://genomebiology.biomedcentral.com/articles/10.1186/s13059-025-03781-6]
- 9. Evaluating AI Models for Cell Response Prediction - Simple Science [https://scisimple.com/en/articles/2025-07-12-evaluating-ai-models-for-cell-response-prediction--a3q8rz6]
- 10. PertEval- scFM : Benchmarking Single-Cell Foundation... | OpenReview [https://openreview.net/forum?id=t04D9bkKUq]
- 11. OmicsEV: A tool for large scale omics data tables evaluation [https://bzhanglab.github.io/OmicsEV/]
- 12. a resource for quantitative gene function annotation - PMC [https://pmc.ncbi.nlm.nih.gov/articles/PMC2894510/]
- 13. Transformative advances in single-cell omics - PubMed Central [https://pmc.ncbi.nlm.nih.gov/articles/PMC12560279/]
- 14. Zero-shot evaluation reveals limitations of single-cell ... [https://genomebiology.biomedcentral.com/articles/10.1186/s13059-025-03574-x]
- 15. Transformer Neural Networks: Ultimate 2025 Guide [https://swimm.io/learn/large-language-models/transformer-neural-networks-ultimate-2025-guide]
- 16. Transformer Design Guide (Part 2: Modern Architecture) [https://rohitbandaru.github.io/blog/Transformer-Design-Guide-Pt2/]
- 17. scNET: learning context-specific gene and cell ... [https://www.nature.com/articles/s41592-025-02627-0]
- 18. Multimodal learning enables chat-based exploration of ... [https://www.nature.com/articles/s41587-025-02857-9]
- 19. CellFM: a large-scale foundation model pre-trained on ... [https://www.nature.com/articles/s41467-025-59926-5]
- 20. Navigating single-cell RNA-sequencing: protocols, tools ... [https://pmc.ncbi.nlm.nih.gov/articles/PMC12085826/]
- 21. CZ CELLxGENE Discover - Cellular Visualization Tool [https://cellxgene.cziscience.com/]
- 22. Public Single-Cell RNA-Seq Databases: A Comprehensive ... [https://www.nygen.io/resources/blog/public-single-cell-rna-seq-databases]
- 23. Tahoe Open Sources Tahoe-100M, the World's Largest ... [https://arcinstitute.org/news/arc-vevo]
- 24. Public RNA-Seq and scRNA-Seq Databases [https://bigomics.ch/blog/ultimate-guide-to-public-rnaseq-and-sc-rna-seq-databases/]
- 25. Visualizing Single Cell Datasets Using CellxGene [https://www.elucidata.io/blog/visualizing-single-cell-datasets-using-cellxgene]
- 26. chanzuckerberg/cellxgene: An interactive explorer for ... [https://github.com/chanzuckerberg/cellxgene]
- 27. SIMBA: single-cell embedding along with features [https://www.nature.com/articles/s41592-023-01899-8]
- 28. Generalizable and Scalable Visualization of Single-Cell ... [https://pmc.ncbi.nlm.nih.gov/articles/PMC6469860/]
- 29. Biology-driven insights into the power of single-cell ... [https://pmc.ncbi.nlm.nih.gov/articles/PMC12492631/]
- 30. Article BioLLM: A standardized framework for integrating ... [https://www.sciencedirect.com/science/article/pii/S2666389925001746]
- 31. Regulatory variants: from detection to predicting impact [https://pmc.ncbi.nlm.nih.gov/articles/PMC6917219/]
- 32. Quantifying the regulatory potential of genetic variants via a ... [https://www.nature.com/articles/s41467-024-55392-7]
- 33. A comparison of computational methods for expression ... [https://genomebiology.biomedcentral.com/articles/10.1186/s13059-025-03840-y]
- 34. Prediction of condition-specific regulatory genes using ... [https://pmc.ncbi.nlm.nih.gov/articles/PMC7293043/]
- 35. In silico biological discovery with large perturbation models [https://www.nature.com/articles/s43588-025-00870-1]
- 36. Predicting transcriptional responses to novel chemical ... [https://www.nature.com/articles/s41467-024-53457-1]
- 37. Predicting functions of uncharacterized gene products from ... [https://www.nature.com/articles/s41587-025-02813-7]
- 38. In silico prediction of variant effects: promises and limitations ... [https://pmc.ncbi.nlm.nih.gov/articles/PMC12304032/]
- 39. Predicting Genetic Variant Pathogenicity Using Vector ... [https://www.medrxiv.org/content/10.1101/2025.08.08.25333318v1]
- 40. Genetic evidence informs the direction of therapeutic ... [https://www.nature.com/articles/s44386-025-00027-0]
- 41. AI-based prediction of drug-gene interactions modulating tight ... [https://pmc.ncbi.nlm.nih.gov/articles/PMC12590139/]
- 42. - Single -omics: cell the transcriptome... | Abcam multi Integrating [https://www.abcam.com/en-us/stories/articles/integrating-the-transcriptome-epigenome-and-proteome]
- 43. Application of computational algorithms for single - cell - RNA and... seq [https://pubmed.ncbi.nlm.nih.gov/39500613/]
- 44. 45. Paired integration — Single - cell best practices [https://www.sc-best-practices.org/multimodal_integration/paired_integration.html]
- 45. Multimodal Integration in Health Care: Development With ... [https://www.jmir.org/2025/1/e76557]
- 46. Multimodal Integration in Health Care - PubMed Central - NIH [https://pmc.ncbi.nlm.nih.gov/articles/PMC12370271/]
- 47. Interpretable and integrative analysis of single - cell multiomics with... [https://www.nature.com/articles/s42003-025-08533-7?error=cookies_not_supported&code=2a6c923d-48b0-4770-8d87-28ad491c98f1]
- 48. Soft graph clustering for single-cell RNA sequencing data [https://bmcbioinformatics.biomedcentral.com/articles/10.1186/s12859-025-06231-z]
- 49. Data normalization for addressing the challenges in the ... [https://bmcgenomics.biomedcentral.com/articles/10.1186/s12864-024-10364-5]
- 50. Enabling scalable single-cell transcriptomic analysis ... [https://www.nature.com/articles/s41598-025-12897-5]
- 51. Pathway Commons: A Resource for Biological Pathway Analysis [https://www.pathwaycommons.org/]
- 52. Visualisation of BioPAX Networks using BioLayout Express ... [https://pmc.ncbi.nlm.nih.gov/articles/PMC4406191/]
- 53. BioPAX in 2024: Where we are and where we are heading [https://www.sciencedirect.com/science/article/pii/S2001037024003660]
- 54. Lost in Tokenization: Context as the Key to Unlocking ... [https://arxiv.org/html/2510.23127v2]
- 55. Benchmarking foundation cell models for post-perturbation ... [https://pubmed.ncbi.nlm.nih.gov/40269681/]
- 56. Systema: a framework for evaluating genetic perturbation ... [https://www.nature.com/articles/s41587-025-02777-8]
- 57. AI models for drug design fail in physics | University of Basel [https://www.unibas.ch/en/News-Events/News/Uni-Research/AI-models-for-drug-design-fail-in-physics.html]
- 58. A New Fine-Tuning Approach for LLMs Using Evolution ... [https://www.cognizant.com/us/en/ai-lab/blog/llm-fine-tuning-with-es]
- 59. The Fine-Tuning Landscape in 2025: A Comprehensive ... [https://medium.com/@pradeepdas/the-fine-tuning-landscape-in-2025-a-comprehensive-analysis-d650d24bed97]
- 60. Mastering Fine-Tuning Strategies for AI in 2025 [https://sparkco.ai/blog/mastering-fine-tuning-strategies-for-ai-in-2025]
- 61. EvoWeaver: large-scale prediction of gene functional ... [https://www.nature.com/articles/s41467-025-59175-6]
- 62. BioLLM: A standardized framework for integrating and ... [https://pmc.ncbi.nlm.nih.gov/articles/PMC12365531/]
- 63. BioLLM: A standardized framework for integrating and ... [https://pubmed.ncbi.nlm.nih.gov/40843339/]
- 64. Transformative advances in single-cell omics: a ... [https://translational-medicine.biomedcentral.com/articles/10.1186/s12967-025-07091-0]
- 65. The STRING database in 2025: protein networks with ... [https://pmc.ncbi.nlm.nih.gov/articles/PMC11701646/]
- 66. A deep ensemble framework for human essential gene ... [https://www.nature.com/articles/s41598-025-99164-9]
- 67. Why simple models outperformed deep learning in gene ... [https://www.linkedin.com/posts/vsavova_deep-learning-based-gene-perturbation-effect-activity-7360314175551639552-mjBK]
- 68. 2025 and Beyond: The Future of Genomic Data Analysis ... [https://blog.crownbio.com/2025-and-beyond-the-future-of-genomic-data-analysis-and-innovations-in-genomics-services]
- 69. PerturBench: Benchmarking Machine Learning Models for ... [https://arxiv.org/html/2408.10609v3]
- 70. Efficient Fine-Tuning of Single-Cell Foundation Models ... [https://arxiv.org/html/2412.13478v2]
- 71. What is zero-shot learning with embeddings? [https://milvus.io/ai-quick-reference/what-is-zeroshot-learning-with-embeddings]
- 72. Zero-shot segmentation using embeddings from a protein ... [https://journals.plos.org/ploscompbiol/article?id=10.1371/journal.pcbi.1012929]
- 73. Towards Applying Large Language Models to Complement ... [https://arxiv.org/html/2507.10039v1]
- 74. TencentAILabHealthcare/scBERT [https://github.com/TencentAILabHealthcare/scBERT]
- 75. Benchmarking foundation cell models for post-perturbation ... [https://bmcgenomics.biomedcentral.com/articles/10.1186/s12864-025-11600-2]
- 76. TranslationalBioinformaticsUnit/scbert-reusability [https://github.com/TranslationalBioinformaticsUnit/scbert-reusability]
- 77. clinicalml/sc-foundation-eval: Code for evaluating single ... [https://github.com/clinicalml/sc-foundation-eval]
- 78. Geneformer Cell Type Classification Benchmark [https://docs.nvidia.com/bionemo-framework/2.5/user-guide/examples/bionemo-geneformer/geneformer-celltype-classification/]
- 79. PerturBench: Benchmarking Machine Learning Models for ... [https://arxiv.org/html/2408.10609v4]
- 80. Closing the loop: Teaching single-cell foundation models to ... [https://pmc.ncbi.nlm.nih.gov/articles/PMC12265564/]