STR Profiling vs Isoenzyme Analysis: A Modern Guide to Cell Line Authentication
This article provides a comprehensive comparison of Short Tandem Repeat (STR) profiling and isoenzyme analysis for cell line authentication, essential for researchers, scientists, and drug development professionals.
STR Profiling vs Isoenzyme Analysis: A Modern Guide to Cell Line Authentication
Abstract
This article provides a comprehensive comparison of Short Tandem Repeat (STR) profiling and isoenzyme analysis for cell line authentication, essential for researchers, scientists, and drug development professionals. It explores the foundational principles of each method, details their practical applications and methodologies, addresses common troubleshooting and optimization strategies, and delivers a decisive validation and comparative analysis. With an estimated 15-20% of cell lines being misidentified, this guide empowers laboratories to select the optimal authentication strategy to ensure research integrity, data reproducibility, and compliance with stringent journal and funding agency requirements.
The Critical Foundation: Why Cell Line Authentication is Non-Negotiable in Modern Research
The use of misidentified and cross-contaminated cell lines represents a critical, yet persistent, challenge in biomedical research. For decades, biological research has been compromised by the use of cell cultures that are not what they purport to be, leading to irreproducible results, wasted resources, and flawed scientific conclusions. The problem was recognized as early as the 1960s, yet studies conducted as recently as the 2020s confirm that misidentification remains widespread. This guide objectively compares two primary methodologies used for cell line authentication—short tandem repeat (STR) profiling and isoenzyme analysis—by presenting statistical data on cross-contamination, detailed experimental protocols, and a clear framework for selecting the appropriate authentication strategy.
The Scope of the Problem: Statistical Evidence of Misidentification
Quantifying the rate of cell line misidentification reveals the alarming prevalence of this issue across global research laboratories.
Large-Scale Studies on Misidentification Rates
Recent, extensive studies profiling hundreds of cell lines provide the most current picture of the problem.
- A 2017 analysis of 482 human tumor cell lines used in China found that 20.5% (99 cell lines) were incorrectly identified. This breakdown showed that intra-species cross-contamination (e.g., one human cell line overgrowing another) was the most common issue, affecting 14.5% of lines, while inter-species cross-contamination accounted for 4.4% [1].
- Another 2017 study of 278 widely used tumor cell lines from 28 institutes in China uncovered a staggering 46.0% (128 cell lines) cross-contamination or misidentification rate. Among cell lines established within China, the misidentification rate was as high as 73.2% (52 out of 71 cell lines) [2].
- A broader historical perspective, cited in a 2012 review, estimates that 15–20% of the time, cells used in experiments are misidentified or cross-contaminated [3].
Prevalence of Specific Contaminants
The statistical data also highlight the most common contaminating cell lines.
- The HeLa human cervical carcinoma cell line is a notoriously prolific contaminant. In the study of 278 cell lines, HeLa accounted for 46.9% (60/128) of all cross-contamination instances, affecting 31 different cell lines purported to originate from 10 different types of tumor and 3 types of normal tissue [2].
- Other common human cell line contaminants include T-24 (a bladder cancer cell line) and HCT-15 (a colorectal adenocarcinoma cell line) [2].
The table below summarizes the key findings from major studies.
Table 1: Statistical Evidence of Cell Line Misidentification from Recent Studies
| Study Scope | Total Cell Lines Tested | Overall Misidentification Rate | Breakdown of Misidentification | Most Common Contaminant |
|---|---|---|---|---|
| Human tumor cell lines in China [1] | 482 | 20.5% (99/482) | Intra-species: 14.5% (70)Inter-species: 4.4% (21)Mixtures: 1.7% (8) | HeLa (among intra-species) |
| Tumor cell lines from 28 institutes [2] | 278 | 46.0% (128/278) | Intra-species: 84.4% (108/128)Inter-species: 15.6% (20/128) | HeLa (46.9% of contaminants) |
Methodologies for Authentication: STR Profiling vs. Isoenzyme Analysis
Two established techniques for cell line authentication are STR profiling and isoenzyme analysis. They operate on different principles and offer varying levels of discrimination.
Short Tandem Repeat (STR) Profiling
Principle: STR profiling is a DNA-based technique that amplifies and analyzes highly polymorphic regions of the genome containing short, repetitive sequences. The number of repeats at each locus is highly variable between individuals, creating a unique genetic fingerprint [4] [3].
- Workflow: The standard protocol involves DNA extraction from the cell line, followed by a multiplex PCR amplification of multiple STR loci (e.g., 9, 16, or 21 loci) using a commercial kit. The amplified fragments are separated by capillary electrophoresis, and software determines the allele sizes for each locus to generate a profile [3]. This profile is then compared to a reference database.
- Resolution: STR profiling can establish identity to the individual level, distinguishing between different human cell lines from different donors [4].
Isoenzyme Analysis
Principle: Isoenzyme analysis is a biochemical technique that exploits species-specific differences in the structure and electrophoretic mobility of intracellular enzymes (isoenzymes) such as lactate dehydrogenase (LD) and nucleoside phosphorylase (NP) [5].
- Workflow: A cell extract is prepared and loaded onto an agarose or cellulose acetate gel. After electrophoresis, the gel is incubated with specific substrates that produce a visible, colored precipitate where the enzyme is active. The resulting banding pattern is compared to known standards to determine the species of origin [5].
- Resolution: Its primary strength is speciation—confirming a cell line's species (e.g., human vs. hamster) and detecting inter-species cross-contamination. It is less suited for distinguishing between cell lines from the same species [4] [5].
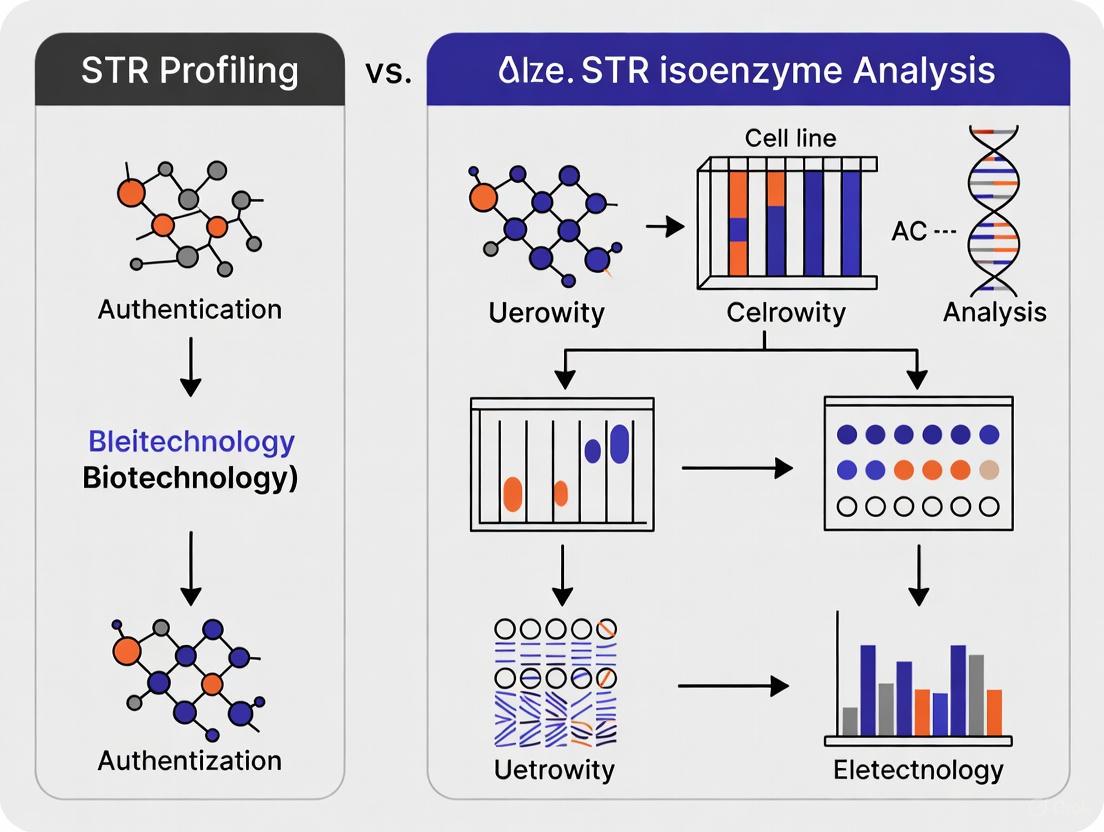
The following diagram illustrates the core logical relationship and primary application of these two techniques.
Experimental Protocols for Key Authentication Methods
To ensure reproducibility, the core experimental procedures for STR profiling and isoenzyme analysis are detailed below.
Detailed Protocol: STR Profiling with a 21-Loci System
The following protocol is adapted from studies that emphasize the superior discriminatory power of a 21-loci analysis over older, smaller kits [2] [6].
- DNA Extraction: Isolate genomic DNA from approximately ( 2.5 \times 10^6 ) viable cells using a commercial DNA extraction kit (e.g., DNeasy Blood and Tissue Kit). Quantify the DNA using a fluorometer [7].
- PCR Amplification: Perform a multiplex PCR reaction using a 21-loci STR kit (e.g., Microread Genetics 21 ID System). A typical reaction includes:
- Extracted DNA (1–2 ng)
- Multiplex PCR Master Mix (containing hot-start Taq DNA polymerase, dNTPs, and buffer)
- Primer Set for 21 loci (including the 8 core CODIS loci, plus additional loci like Penta D, Penta E, and D2S1338)
- Thermal Cycling: Use the following PCR cycling conditions, optimized for 29 cycles to balance signal strength and artifact generation [8]:
- Initial Denaturation: 96°C for 2 minutes
- 29 Cycles of:
- Denaturation: 94°C for 30 seconds
- Annealing: 59°C for 2 minutes
- Extension: 72°C for 1 minute
- Final Extension: 60°C for 30 minutes
- Capillary Electrophoresis: Dilute the PCR product and mix it with a size standard (e.g., ILS 600). Analyze the fragments using a capillary electrophoresis instrument.
- Data Analysis: Use allele-calling software to generate the STR profile. Compare the profile to reference databases (e.g., DSMZ, ATCC) using a matching algorithm. A match percentage of ≥80% is typically required to declare authenticity, but higher-loci systems provide greater confidence [6].
Detailed Protocol: Isoenzyme Analysis
This protocol is based on the use of a commercial kit, such as the AuthentiKit System [5].
- Sample Preparation: Harvest cells and prepare a lysate. Remove insoluble material by centrifugation.
- Gel Electrophoresis: Load the cell lysate, along with a standard (e.g., murine L929) and control (e.g., human HeLa) extract, onto an agarose gel. Run the gel at a defined voltage (e.g., 125 V) for approximately 45 minutes.
- Enzyme-Specific Staining: After electrophoresis, overlay the gel with reagent-soaked agarose pads containing specific substrates for each enzyme (e.g., Lactate Dehydrogenase, Glucose-6-Phosphate Dehydrogenase). Incubate at 37°C in the dark.
- Band Visualization: Monitor color development closely. Stop the reaction when bands are clearly visible but before over-development causes smearing. Common enzymes analyzed include NP, MD, G6PD, LD, and MPI.
- Interpretation: Measure the migration distance of the sample bands. Apply a correction factor based on the standard migration to account for run-to-run variability. Compare the corrected migration distances to a standardized chart to determine the species of origin. The test is considered valid if the control migration is within 2 mm of its expected distance [5].
Comparative Performance Data
Direct comparison of STR profiling and isoenzyme analysis reveals critical differences in their capabilities and limitations. The following table synthesizes experimental data from the literature.
Table 2: Comparative Performance of STR Profiling and Isoenzyme Analysis for Cell Line Authentication
| Parameter | STR Profiling | Isoenzyme Analysis |
|---|---|---|
| Primary Application | Intra-species identification (individual level) [4] | Species identification (speciation) [5] |
| Detection Sensitivity | Can detect minor components in a mixture; sensitivity depends on the number of loci and contributor ratios [2] | Can detect inter-species contamination when the contaminant constitutes ~10% of the total population [5] |
| Key Experimental Data | 21-loci STR distinguished HCCC-9810 and Calu-6 (48.2% match) incorrectly matched by 9-loci STR (88.9% match) [6] | Effectively discriminated human, mouse, and Chinese hamster cells; optimal enzyme (PepB) needed to detect CHO-K1/L929 mixture [5] |
| Limitations | Cannot detect inter-species contamination [1]; requires reference databases | Cannot reliably distinguish between cell lines of the same species [4] |
| Recommended Use Case | Gold standard for authenticating human cell lines and detecting intra-species cross-contamination [4] [3] | Rapid, cost-effective initial screening for species-of-origin and inter-species cross-contamination [5] |
The Scientist's Toolkit: Essential Research Reagents
A successful authentication strategy relies on specific, high-quality reagents and tools.
Table 3: Key Research Reagent Solutions for Cell Line Authentication
| Item | Function | Example Products / Methods |
|---|---|---|
| STR Multiplex Kits | Simultaneously amplify multiple STR loci for DNA fingerprinting. | PowerPlex ESI 17, AmpFℓSTR NGM Select [8], 21-loci kits from Microread [6] |
| Isoenzyme Analysis Kits | Provide reagents for electrophoresis and staining to identify species-specific enzyme patterns. | AuthentiKit System [5] |
| DNA Extraction Kits | Purify high-quality genomic DNA from cell cultures for downstream STR analysis. | DNeasy Blood & Tissue Kit [7] |
| Capillary Electrophoresis System | Separates and detects fluorescently-labeled STR amplicons by size. | Applied Biosystems Genetic Analyzers [3] |
| Probabilistic Genotyping Software (PGS) | Calculates the statistical weight of evidence for complex DNA mixtures; deals with stutter, drop-in, and drop-out artifacts [9]. | STRmix, EuroForMix [9] |
| Public STR Databases | Provide reference STR profiles for comparison to authenticate cell lines. | DSMZ STR Database, ATCC STR Database [4] [1] |
The statistical data leaves no room for doubt: cell line misidentification is a pervasive problem that demands a systematic solution. Neither STR profiling nor isoenzyme analysis alone is sufficient to address all forms of cross-contamination. The evidence supports a complementary, two-tiered approach:
- Employ Isoenzyme Analysis (or a similar method like PCR-based barcoding) as a first-line test to confirm the species of origin and to screen for inter-species contamination [4] [1].
- Utilize STR Profiling with a sufficient number of loci (e.g., 16 or 21) as the definitive method for confirming intra-species identity and detecting cross-contamination by another human cell line [1] [6].
This combined strategy, implemented at the level of cell banks, end-of-production cells, and routinely during research, forms the foundation of good cell culture practice. It is a necessary investment to ensure the integrity of biological research, the validity of diagnostic tests, and the efficacy of developed therapeutics.
The integrity of biomedical research hinges on the authenticity of its fundamental tools, chief among them being cell lines. The history of cell culture is marked by a persistent challenge: the misidentification of cell lines through cross-contamination or mislabeling. This issue was thrust into the scientific spotlight with Stanley Gartler's seminal revelation in 1967-1968, where he demonstrated that 18 extensively used cell lines were actually derived from the ubiquitous HeLa cell line [10]. This discovery exposed a critical vulnerability in biomedical research. The HeLa cell line, derived from Henrietta Lacks in 1951, is not only the oldest but also one of the most prolific contaminants; it remains the most common contaminant today, implicated in 145 misidentified cell lines according to the latest ICLAC register [11] [12]. The response to this ongoing problem has evolved from initial recognition to systematic action, culminating in initiatives like the International Cell Line Authentication Committee (ICLAC), which now curates a register of 593 misidentified cell lines [11].
The evolution of authentication technologies has been critical in this fight. Early methods like isoenzyme analysis provided a foundation for speciation, but the field has increasingly moved toward more discriminatory DNA-based techniques. This guide provides a comparative analysis of two key authentication methods—short tandem repeat (STR) profiling and isoenzyme analysis—framed within the historical context from Gartler's initial discovery to the modern, centralized efforts of ICLAC.
The Evolution of a Crisis: Key Historical Milestones
The HeLa Revelation and Early Contamination Studies
Stanley Gartler's 1967 presentation at the Second Decennial Review Conference on Cell Tissue and Organ Culture marked a turning point in cell culture science. By revealing that 18 commonly used cell lines were actually HeLa contaminants, he challenged the fundamental assumptions underlying a substantial body of research [10]. This revelation was initially met with resistance but was later confirmed and expanded by the work of Walter Nelson-Rees in the 1970s and 1980s, who used chromosome banding to systematically identify and publish lists of cross-contaminated cell lines [4]. These early efforts established the scientific basis for understanding that:
- Interspecies and intraspecies cross-contamination is a persistent problem in cell culture.
- Fast-growing cell lines, particularly HeLa, can overgrow slower-growing cultures within a few passages.
- Visual inspection alone is insufficient for detecting cross-contamination, especially in established continuous cell lines.
Institutional Responses and the Formation of ICLAC
The growing recognition of the misidentification problem led to coordinated institutional responses. The International Cell Line Authentication Committee (ICLAC) was formed to provide a centralized, authoritative resource for tracking misidentified cell lines. ICLAC's core contribution is the Register of Misidentified Cell Lines, which as of version 13 (April 2024) documents:
- 593 cell lines known to be misidentified
- 545 cell lines with no known authentic stock
- 145 different cell lines contaminated with HeLa
- 70 cell lines involved in interspecies contamination [11]
This register represents the modern culmination of decades of effort to document and publicize the scope of cell line misidentification. The establishment of ICLAC and its register has been complemented by requirements from major funding agencies like the National Institutes of Health (NIH) and scientific journals that now mandate cell authentication in publications and grant applications [13] [4].
Methodological Foundations: STR Profiling vs. Isoenzyme Analysis
Short Tandem Repeat (STR) Profiling
STR profiling establishes a DNA fingerprint for human cell lines by analyzing repetitive DNA sequences scattered throughout the genome. The technique uses multiplex polymerase chain reaction (PCR) to simultaneously amplify multiple polymorphic STR loci, typically 16-26 markers, including the amelogenin gene for sex determination [13] [10]. The resulting amplification products are separated by capillary electrophoresis, with detection achieved through fluorescent dye labeling [10]. The power of STR profiling lies in its discrimination at the individual level, provided that an appropriate number and variety of loci are evaluated [4]. The technology has been standardized through the ANSI/ATCC ASN-0002-2022 guidelines, which recommend a specific set of 13 core autosomal STR loci for authentication purposes [14].
Isoenzyme Analysis
Isoenzyme analysis operates on the principle that the electrophoretic mobility of specific intracellular enzymes varies predictably between species. The method examines a panel of enzymes—typically including nucleoside phosphorylase (NP), malate dehydrogenase (MD), glucose-6-phosphate dehydrogenase (G6PD), lactate dehydrogenase (LD), and aspartate amino transferase (AST)—by separating their isoforms on a gel matrix [5]. The resulting banding patterns are compared to standardized migration distances for known species, allowing for accurate speciation. The technique is technically robust, relatively simple to perform, and provides results within hours rather than days [5]. Its primary strength lies in detecting interspecies contamination, though it generally cannot discriminate between cell lines from the same species [5] [4].
Table 1: Core Characteristics of Authentication Methods
| Characteristic | STR Profiling | Isoenzyme Analysis |
|---|---|---|
| Discrimination Level | Individual-specific | Species-level |
| Key Applications | Authentication of human cell lines; individual identification | Species verification; detection of interspecies contamination |
| Throughput | Moderate to High (multiplexed PCR) | Moderate (multiple gel runs) |
| Technical Complexity | High (requires specialized equipment and expertise) | Moderate (gel electrophoresis) |
| Standardization | ANSI/ATCC ASN-0002-2022 standard | Commercial kit-based systems (e.g., AuthentiKit) |
| Detection Sensitivity | Can detect mixtures as low as 10-15% | Typically requires 10-25% contamination for detection |
Technical Comparison: Resolution, Sensitivity, and Applications
Discrimination Power and Resolution
The fundamental distinction between STR profiling and isoenzyme analysis lies in their discrimination power. STR profiling provides individual-specific identification by targeting highly polymorphic regions of the human genome where the number of tandem repeats varies considerably between individuals [10]. This enables researchers to not only confirm that a cell line is human but to specifically match it to the donor individual, providing definitive authentication against original tissue samples when available [4] [10].
In contrast, isoenzyme analysis operates at the species level, distinguishing between human, mouse, Chinese hamster, and other commonly cultured species [5]. While critically important for detecting interspecies contamination, this method cannot distinguish between different human cell lines, making it ineffective for detecting intraspecies contamination—the most common form of misidentification in human cell lines [5] [4].
Sensitivity and Detection Limits
Sensitivity comparisons reveal important practical differences between these techniques. Isoenzyme analysis typically requires the contaminating population to represent 10-25% of the total culture for reliable detection [5]. Studies have demonstrated that in mixtures of Chinese hamster ovary (CHO-K1) and human (MRC-5) cells, distinct lactate dehydrogenase (LD) bands for each species were visible when each type constituted at least 11% of the population [5].
STR profiling offers superior sensitivity, capable of detecting minor components in mixed populations at levels of 10-15% [10]. This enhanced sensitivity is particularly valuable for identifying early-stage cross-contamination before a culture is completely overgrown by the contaminant. The detection limit varies depending on the specific STR loci analyzed and the quality of the DNA sample, but generally provides earlier warning of contamination issues than isoenzyme methods.
Table 2: Performance Comparison in Experimental Detection
| Performance Metric | STR Profiling | Isoenzyme Analysis |
|---|---|---|
| Sensitivity to Low-Level Contamination | 10-15% detection limit | 10-25% detection limit |
| Time to Results | 1-3 days (including DNA extraction, PCR, and analysis) | Several hours to 1 day |
| Capacity for Automation | High (automated DNA extraction, PCR, and capillary electrophoresis) | Low to Moderate (manual gel-based system) |
| Multi-Species Capability | Requires species-specific primer sets | Broad species coverage with same test panel |
| Sample Throughput | High (especially with multi-capillary instruments) | Moderate (limited by gel capacity) |
Methodological Workflows and Technical Requirements
The experimental workflows for these techniques differ significantly in their complexity and requirements. STR profiling begins with DNA extraction from cell samples, followed by multiplex PCR amplification of the targeted STR loci using fluorescently labeled primers [10]. The amplification products are then separated by capillary electrophoresis, with data analysis involving comparison to allelic ladders and internal size standards to determine the number of repeats at each locus [10] [14]. Specialized software facilitates allele calling and comparison to database records [14].
Isoenzyme analysis employs a more straightforward methodology centered on cell lysis and protein extraction, followed by electrophoretic separation on agarose or cellulose acetate gels [5]. Specific enzymes are visualized using chromogenic substrates that produce colored bands indicating the position of each isoform. The migration distances of these bands are compared to standardized values for known species, with correction factors applied based on control samples run on the same gel [5].
Experimental Design and Protocol Implementation
STR Profiling: Detailed Experimental Protocol
The standard STR profiling protocol follows these key steps:
Sample Preparation: Harvest cells during logarithmic growth phase, typically at 70-80% confluence. Extract genomic DNA using standardized methods, ensuring DNA quality and quantity meets kit specifications (typically 1-2.5 ng/μL) [13] [14].
Multiplex PCR Amplification: Perform PCR amplification using commercial STR kits (e.g., Applied Biosystems' Identifiler or GlobalFiler kits) that target the core CODIS loci plus additional informative markers. Standard kits amplify 16-24 STR loci simultaneously in a single reaction, including the amelogenin sex-determination marker [14]. Reaction conditions follow manufacturer specifications with typical cycling parameters of 95-98°C for initial denaturation, followed by 25-30 cycles of denaturation, annealing, and extension.
Capillary Electrophoresis: Separate PCR products using capillary electrophoresis systems (e.g., Applied Biosystems 3500 Series Genetic Analyzers). Include internal size standards in each sample to ensure accurate fragment sizing. The system detects fluorescently labeled fragments, generating electropherograms for analysis [10] [14].
Data Analysis and Interpretation: Use specialized software (e.g., GeneMapper) to convert raw data into allele calls at each locus by comparing fragment sizes to allelic ladders. Generate a unique STR profile for the cell line consisting of the allele calls across all tested loci [10].
Authentication: Compare the resulting STR profile to reference databases such as ATCC's STR database, Cellosaurus, or CLIMA to verify identity. Match thresholds are typically set at ≥80% for related cultures, with lower percentages indicating potential misidentification or genetic drift [15].
Isoenzyme Analysis: Detailed Experimental Protocol
The standard isoenzyme analysis protocol involves these critical steps:
Sample Preparation: Harvest cells and prepare cell lysates using detergent-based extraction buffers that preserve enzyme activity. Clarify lysates by centrifugation to remove insoluble debris [5].
Gel Preparation and Loading: Prepare agarose or cellulose acetate gels according to manufacturer specifications. Load samples alongside control extracts of known species origin (e.g., mouse L929 as a standard and human HeLa as a control) [5].
Electrophoretic Separation: Run gels at constant voltage (typically 150-200V) for 30-45 minutes under appropriate buffer conditions. Different enzymes require specific buffer systems for optimal separation [5].
Enzyme-Specific Staining: After electrophoresis, overlay gels with substrate solutions specific for each enzyme (e.g., nitroblue tetrazolium/phenazine methosulfate for lactate dehydrogenase). Monitor color development carefully, stopping the reaction when bands are clearly visible but before background staining becomes excessive [5].
Pattern Analysis and Species Identification: Measure migration distances of sample bands from the origin. Apply correction factors based on the standard sample migration. Compare corrected migration distances to reference charts provided with commercial kits to determine species identity [5].
Table 3: Research Reagent Solutions for Cell Line Authentication
| Reagent/Kit | Primary Function | Application Context |
|---|---|---|
| ATCC FTA Sample Collection Kit | Sample stabilization and DNA preservation for transport | STR profiling service; facilitates sample submission to testing facilities |
| AuthentiKit System | Complete reagent system for isoenzyme analysis | Speciation and detection of interspecies contamination |
| Applied Biosystems CLA Identifiler/GlobalFiler Kits | Multiplex PCR amplification of STR loci | STR profiling for human cell line authentication |
| GeneMapper Software | Fragment analysis and allele calling | STR data interpretation and profile generation |
| Hoechst 33258 Stain | Fluorescent DNA staining | Mycoplasma detection in cell cultures |
Data Interpretation and Integration in Authentication Strategies
STR Profile Interpretation Guidelines
STR data interpretation requires careful analysis of electropherogram data with attention to quality metrics. The ANSI/ATCC standard provides guidelines for interpreting results, including:
- Allele Calling: Peaks must exceed analytical thresholds (typically 150-200 RFU) and fall within expected size ranges for each locus.
- Mixed Populations: Indicated by three or more peaks at multiple loci, with peak height ratios below 60-70% suggesting mixtures.
- Genetic Drift: Detection of allele drop-in or drop-out in sublines compared to reference profiles [10] [14].
Database comparison is essential for STR authentication. Multiple public databases exist, including:
- ATCC STR Database: Comprehensive collection of STR profiles for ATCC human cell lines.
- Cellosaurus: Extensive knowledge resource with STR profiles for approximately 120,000 cell lines.
- CLIMA: Integrated database of certified STR profiles from multiple repositories [15].
Isoenzyme Pattern Interpretation
Isoenzyme analysis interpretation focuses on band migration patterns and intensities:
- Species Identification: Match corrected migration distances to species-specific reference values for each enzyme.
- Contamination Detection: Look for additional bands or "doublets" in enzymes like malate dehydrogenase, which may indicate mixed species populations.
- Enzyme Selection: Optimal enzymes vary for detecting specific species mixtures; for example, peptidase B is particularly effective for distinguishing mouse and Chinese hamster cells [5].
Complementary Roles in Comprehensive Authentication Strategies
While STR profiling has emerged as the gold standard for human cell line authentication, isoenzyme analysis retains important complementary roles in comprehensive authentication strategies. STR profiling provides definitive authentication for human cell lines but requires species-specific primer sets, whereas isoenzyme analysis offers broad species coverage with a single test panel, making it valuable for initial screening and verification of non-human cell lines [5] [4].
A robust authentication strategy incorporates both techniques at different stages:
- STR Profiling for definitive authentication of human cell lines upon receipt, after cryopreservation, and at regular intervals during culture (recommended every 3 months or 10 passages) [13] [16].
- Isoenzyme Analysis for rapid species verification, particularly when working with multiple species in the same laboratory, or when contamination with non-human cells is suspected [5].
- Additional Techniques including karyotyping for detecting gross chromosomal abnormalities and mycoplasma testing for detecting this common contamination [16].
This integrated approach aligns with the Good Cell Culture Practices advocated by ICLAC and other organizations, which emphasize multiple verification methods to ensure cell line integrity [4] [16].
The journey from Gartler's HeLa revelation to ICLAC's systematic documentation of misidentified cell lines represents significant progress in addressing one of cell biology's most persistent challenges. The evolution of authentication technologies—from chromosomal banding to isoenzyme analysis to STR profiling—has provided researchers with increasingly powerful tools to verify their cellular models.
STR profiling currently stands as the unambiguous gold standard for human cell line authentication, providing individual-specific discrimination that enables definitive matching to donor tissues. Its standardization through ANSI/ATCC guidelines and support from major databases has established it as a requirement for funding and publication. Nevertheless, isoenzyme analysis maintains relevance for rapid species verification and detection of interspecies contamination, particularly in laboratories working with diverse cell types.
The historical context reminds us that cell line misidentification is not a historical artifact but a continuing concern, with ICLAC's register documenting hundreds of problematic lines still in use. Implementation of rigorous authentication protocols combining STR profiling, isoenzyme analysis, and other quality control measures represents an ethical and scientific imperative for ensuring the validity and reproducibility of biomedical research.
Cell line misidentification and contamination represent a critical, yet often overlooked, vulnerability in biomedical research. The use of unauthenticated or misidentified cell lines directly undermines experimental integrity, leading to a cascade of negative outcomes including wasted resources, retracted publications, and misdirected clinical trials. The scientific community has developed several authentication methodologies, with short tandem repeat (STR) profiling emerging as the modern gold standard, largely superseding older techniques like isoenzyme analysis [4] [16] [17]. This guide provides an objective comparison of these two techniques, framing them within the critical context of research integrity and the severe consequences of authentication failure.
The High Stakes of Cell Line Authentication
The financial and temporal costs of working with misidentified cell lines are staggering. When a cell line is not properly authenticated, all resources invested in its culture, maintenance, and experimental use are ultimately squandered. This includes:
- Reagent costs for media, sera, and assay kits
- Personnel time spent on culturing and experiments
- Sequencing costs and other analytical expenditures
- Grant funding that supports the erroneous research
Estimates suggest that 18 to 36% of popular cell lines are misidentified, indicating that a substantial portion of research resources is being directed toward invalid models [18]. The principle of inevitability suggests that any laboratory working with multiple cell lines will eventually experience misidentification or cross-contamination, making proactive authentication essential [4].
Retracted Publications and Eroded Scientific Trust
The ultimate consequence of undetected cell line issues is the retraction of published findings. High-profile cases demonstrate this serious outcome:
- A 2010 Nature Methods paper by Ivan Radovanovic et al. was retracted after discovering widespread contamination of glioma sphere lines with HEK cells expressing GFP [18].
- Journals including the International Journal of Cancer reject approximately 4% of submitted manuscripts due to severe cell line issues [18].
- Major publishers, including the American Association for Cancer Research (AACR) and Nature Publishing Group, now require or strongly recommend cell line authentication for manuscript submission [18].
Retractions damage individual reputations and erode public trust in the scientific enterprise, making authentication both an ethical and practical imperative.
Hindered Clinical Translation
The most significant impact of cell line misidentification may be on patient care. When preclinical research uses incorrect cellular models, the translation to clinical applications is fundamentally compromised. For example, using a bladder cancer cell line misidentified as a prostate cancer model to study prostate-specific therapies generates misleading data that can misdirect clinical trial design [4]. This faulty foundation delays viable therapeutic development and represents an inefficient use of resources that could otherwise benefit patients.
STR Profiling vs. Isoenzyme Analysis: A Technical Comparison
Methodological Foundations
STR Profiling Methodology
STR profiling establishes a DNA "fingerprint" by analyzing highly polymorphic regions of the genome containing short, repetitive sequences [4] [19].
Experimental Protocol:
- DNA Extraction: Genomic DNA is isolated from cell samples using commercial kits (e.g., QIAamp DNA Blood Mini Kit) [19].
- Multiplex PCR: Multiple target STR loci are simultaneously amplified in a single reaction. Modern kits (e.g., GlobalFiler, SiFaSTR 23-plex) target numerous loci—ranging from the core 13 recommended by ANSI/ATCC standards to 24 or more in expanded panels [19] [18].
- Capillary Electrophoresis: Amplified fragments are separated by size, and fluorescent detection generates an electropherogram.
- Data Analysis: Software generates an allele table. Comparison to reference databases using algorithms (e.g., Tanabe or Masters) calculates a match percentage [19].
Isoenzyme Analysis Methodology
Isoenzyme analysis verifies species of origin by exploiting interspecies differences in enzyme structure and electrophoretic mobility [5].
Experimental Protocol:
- Cell Extraction: Prepare cell lysates to release intracellular enzymes.
- Gel Electrophoresis: Load extracts alongside control samples (e.g., mouse L929 and human HeLa) onto agarose or cellulose acetate gels [5].
- Enzyme-Specific Staining: Incubate gels with specific substrates for enzymes like nucleoside phosphorylase (NP), malate dehydrogenase (MD), and glucose-6-phosphate dehydrogenase (G6PD) [5].
- Band Pattern Analysis: Identify species by comparing corrected migration distances of sample bands to standardized charts. Excessive color development must be avoided to maintain band resolution [5].
Performance Comparison and Experimental Data
Table 1: Key Capability Comparison of STR Profiling vs. Isoenzyme Analysis
| Parameter | STR Profiling | Isoenzyme Analysis |
|---|---|---|
| Primary Application | Individual-level identification [4] | Species verification [5] |
| Discriminatory Power | High (establishes unique identity) [4] | Moderate (confirms species only) |
| Detection Sensitivity | Can detect minor contaminants in mixtures [19] | ~10-25% contamination level required [5] |
| Cross-Species Contamination | Effective with species-specific STR panels [4] | Effective for detecting interspecies contamination [5] |
| Technique Complexity | Moderate to High (PCR and fragment analysis) | Technically simple and robust [5] |
| Analysis Time | Several hours to 2 days | Few hours [5] |
| Standardization | Well-standardized (ANSI/ATCC ASN-0002) [18] | Commercial kits available [5] |
Table 2: Quantitative Performance Data from Experimental Studies
| Study Finding | STR Profiling | Isoenzyme Analysis |
|---|---|---|
| Authentication Success | 91/91 human cell lines revived from 34-year storage yielded complete STR profiles [19] | Low frequency of misidentification in GMP cell banks; effective for speciation [5] |
| Contamination Detection | Can identify interspecies contamination and genetic changes during passaging [19] | Detected deliberate 11% CHO-K1 contamination in MRC-5 human cells within 2 passages [5] |
| Loci/Markers Analyzed | 21-24 autosomal STRs plus sex markers [19] [18] | Typically 7 enzymes (NP, MD, G6PD, LD, PepB, AST, MPI) [5] |
| Required Match Score | ≥80% (Masters algorithm) or ≥90% (Tanabe algorithm) indicate relatedness [19] | Visual comparison to standardized migration charts [5] |
Decision Framework and Research Reagent Solutions
The Scientist's Toolkit: Essential Research Reagents
Table 3: Key Reagents and Solutions for Cell Line Authentication
| Reagent/Solution | Function | Example Products/Components |
|---|---|---|
| DNA Extraction Kits | Isolate high-quality genomic DNA for STR profiling | QIAamp DNA Blood Mini Kit [19] |
| STR Multiplex Kits | Amplify multiple STR loci simultaneously | GlobalFiler (24 loci), PowerPlex 18D (17 loci), SiFaSTR 23-plex [19] [16] |
| Isoenzyme Analysis Kits | Provide reagents for electrophoretic speciation | AuthentiKit system with enzyme-specific substrates [5] |
| Electrophoresis Systems | Separate DNA fragments (STR) or enzymes (isoenzyme) | Capillary electrophoresis (e.g., ABI 3730xl), agarose/cellulose acetate gels [19] [5] |
| Analysis Software | Interpret STR data and calculate match percentages | GeneMapper, CLASTR online tool [19] [16] |
| Reference Databases | Compare STR profiles to authenticated cell lines | Cellosaurus, ATCC STR database, CLASTR [19] [17] |
Strategic Implementation in the Research Workflow
The following workflow diagram outlines the decision process for incorporating authentication methods into a research program, highlighting critical points where authentication prevents the consequences of failure:
The consequences of failed cell line authentication—wasted resources, retracted papers, and hindered clinical translation—represent an unsustainable drain on the biomedical research ecosystem. While isoenzyme analysis remains a technically simple and rapid method for basic species verification, STR profiling provides superior discriminatory power for individual-level identification and has become the expected standard for rigorous research [4] [17].
The scientific community's increasing emphasis on authentication, demonstrated through journal requirements and funding agency guidelines, signals a necessary shift toward greater accountability [18] [17]. By integrating STR profiling at critical points in the research workflow—upon acquiring new cell lines, at regular passage intervals, before freezing stocks, and prior to manuscript submission—researchers can protect their investments, ensure the integrity of their findings, and contribute to a more efficient and trustworthy scientific enterprise.
In the rigorous world of biomedical research, the integrity of biological resources is foundational to reproducible and valid scientific findings. The pervasive issue of cell line misidentification, affecting an estimated 15–20% of lines in use, has prompted major research stakeholders to implement strict authentication mandates [20]. These policies are designed to eradicate contaminated or misidentified resources from the research pipeline. This guide examines the specific authentication requirements imposed by the National Institutes of Health (NIH), the American Association for Cancer Research (AACR), and the Nature family of journals, providing a comparative analysis framed by the technical evolution from traditional isoenzyme analysis to the current gold standard of Short Tandem Repeat (STR) profiling.
Mandates at a Glance: A Comparative Analysis
The following table summarizes the core authentication requirements and policies of these leading organizations.
| Organization | Policy Scope & Context | Authentication Requirement | Recommended/Required Methods | Key Motivations & Data |
|---|---|---|---|---|
| NIH [21] | Grant applications (proposed studies). | A plan for authenticating key biological and/or chemical resources is required. | Plan must be based on accepted practices in the relevant field; methods not explicitly specified but STR profiling is the accepted standard for human cell lines. | Enhancing research reproducibility and transparency; ensuring the validity of resources funded by public grants. |
| Nature Journals [22] [23] | Publication of primary research. | Conditional for publication; authors must provide evidence of cell line identity. | STR profiling for human cell lines is the established standard; other methods may be required for other species. | Addresses that 14.5% of human tumor cell lines are intra-species cross-contaminated [1]; upholds journal's standard for scientific rigor. |
| AACR [24] | Annual Meeting (abstract/presentation content). | While not detailed in search results, the AACR's focus on cutting-edge cancer science implies a strong institutional emphasis on data integrity, aligned with community standards. | Implied adherence to community best practices, such as STR profiling. | Commitment to a safe, hospitable, and productive environment for all participants, which extends to research integrity [25]. |
STR Profiling vs. Isoenzyme Analysis: A Technical Deep Dive
The shift from isoenzyme analysis to STR profiling represents a fundamental advancement in ensuring cell line identity. The following table provides a detailed, data-driven comparison of these two techniques.
| Characteristic | Isoenzyme Analysis | STR Profiling |
|---|---|---|
| Principle | Uses band patterns from electrophoretic separation of species-specific enzyme isoforms [20]. | PCR-based amplification and analysis of polymorphic short tandem repeat loci in the genome; the same principle as forensic DNA fingerprinting [20] [26]. |
| Primary Application | Detection of inter-species cross-contamination [20] [1]. | Intra-species identity testing of human cell lines; standard for authentication [20]. |
| Throughput & Speed | Rapid results, but relatively low-throughput [20]. | Higher-throughput and more rapid due to PCR multiplexing [20]. |
| Reproducibility | Can be subject to low reproducibility [20]. | Highly reproducible and robust. |
| Discriminatory Power | Low; sufficient for distinguishing species but not individuals or cell lines within a species. | Very high; generates a unique DNA profile for a cell line based on population allele frequencies [20]. |
| Key Limitation | Cannot detect intra-species cross-contamination (e.g., one human cell line overgrowing another) [1]. | Alone, cannot exclude inter-species cross-contamination [1]. A 2017 study found 3 of 386 human cell lines with correct STR profiles were contaminated with other species [1]. |
| Modern Role | Largely superseded by more definitive genetic methods. | The prevailing standard for human cell line authentication, often used in conjunction with species identification by PCR for comprehensive quality control [1]. |
Experimental Workflow for Cell Line Authentication
The following diagram illustrates the recommended integrated workflow for comprehensive cell line authentication, combining both species identification and STR profiling to overcome the limitations of each individual method.
Essential Research Reagent Solutions for Authentication
To implement these authentication protocols, researchers require specific reagents and resources. The following table details key components of the authentication toolkit.
| Reagent/Resource | Function in Authentication |
|---|---|
| STR Multiplex Kits | Commercial kits that contain primers for co-amplifying multiple polymorphic STR loci in a single PCR reaction, enabling efficient DNA profiling [20]. |
| Species-Specific PCR Primers | Oligonucleotides designed to target conserved DNA regions unique to a species (e.g., human, mouse, rat) to detect inter-species contamination [1]. |
| Authenticated Reference Cell Banks | Verified cell stocks, such as those from repositories like ATCC or ECACC, which serve as a positive control for STR profiling and are the foundation of reliable research [20]. |
| DNA Extraction Kits | Reagents for obtaining high-quality, pure genomic DNA from cell lines, which is a prerequisite for successful STR profiling and species-specific PCR. |
| Online STR Databases (e.g., DSMZ/ATCC) | Publicly accessible databases containing STR profiles for thousands of human cell lines, allowing researchers to compare their results against a known standard [20] [1]. |
The mandates from the NIH, Nature journals, and the broader scientific community like the AACR represent a unified and necessary front in the battle for research reproducibility. While isoenzyme analysis played a historical role in identifying gross contamination, the superior discriminatory power of STR profiling has made it the undisputed standard for authenticating human cell lines. However, the most robust quality control strategy is an integrated one. As evidenced by empirical studies, combining species identification with STR profiling is critical to detect both inter- and intra-species cross-contamination, ensuring that the biological tools at the heart of discovery are genuine and reliable.
Inside the Techniques: A Deep Dive into STR Profiling and Isoenzyme Analysis Protocols
In the realm of biological authentication, the evolution from protein-based analyses to DNA-level techniques represents a paradigm shift in precision and reliability. Short Tandem Repeat (STR) profiling has emerged as the dominant molecular biology method for comparing allele repeats at specific loci in DNA between two or more samples [27]. This review details the core mechanics of STR profiling and objectively compares its performance against the older technology of isoenzyme analysis, presenting experimental data to guide researchers and drug development professionals in selecting appropriate authentication tools for their specific contexts. STRs are microsatellites with repeat units of 2-7 base pairs in length, with the number of repeats varying considerably among individuals, creating the polymorphism that makes them so effective for human identification and cell line authentication [19] [27].
The fundamental superiority of STR profiling lies in its digital nature—variations represent different numbers of repeat units—compared to the analog, expression-dependent variations detected in isoenzyme systems. This technical advantage translates directly to enhanced discrimination power, reproducibility, and applicability across diverse biological materials, from forensic evidence to long-term cultured cell lines [28] [19].
Core Mechanics of STR Profiling
Technological Principles and Workflow
STR profiling operates on several key principles that underpin its effectiveness. The technique analyzes highly polymorphic regions containing short repeated DNA sequences (typically 3-7 base pair units) scattered throughout the human genome [28] [27]. With the exception of monozygotic twins, every individual possesses a unique combination of the number of these repeats at various loci, creating a DNA fingerprint that can statistically individualize biological samples [28].
The basic STR profiling workflow involves several standardized steps: First, DNA is extracted from the biological sample. Next, polymerase chain reaction (PCR) amplifies multiple STR loci simultaneously using sequence-specific primers in a multiplex reaction [27]. The primers are labeled with fluorescent dyes, enabling subsequent detection. The amplified fragments are then separated by size using capillary electrophoresis, and the data is analyzed to determine the number of repeats at each locus based on the fragment lengths [27] [29]. The resulting profile represents the sample's genetic signature at the tested loci.
Multiplexing and Discrimination Power
The true power of STR analysis emerges when examining multiple STR loci simultaneously [27]. While each STR locus is polymorphic with 5-20% of individuals sharing a given allele, testing multiple loci creates a compound genotype that becomes increasingly unique [27]. Modern forensic STR kits now incorporate multidye fluorescence systems (5- to 9-dye configurations) that significantly expand detectable loci per run while maintaining instrument compatibility [29]. For example, one 9-dye system achieved simultaneous detection of 70 loci (29 autosomal STRs + 40 Y-STRs), dramatically improving discrimination power and adaptability to degraded samples [29].
The statistical power arises from the product rule for probabilities, as the 13-24 core CODIS loci used in most forensic systems assort independently [27]. This enables match probabilities as low as 1 in a quintillion (1×10¹⁸), far exceeding the discrimination capacity of any protein-based system [27]. It's important to note that practical considerations such as laboratory error, contamination risks, and the existence of monozygotic twins mean the theoretical probability isn't always realized in practice [27].
STR Profiling Experimental Protocols
Standardized Laboratory Methodology
The following protocol represents the current standard methodology for STR-based authentication, particularly for cell line validation [19]:
DNA Extraction: Genomic DNA is extracted from 5×10⁶ cells using commercial kits (e.g., QIAamp DNA Blood Mini Kit, Qiagen). DNA quantification is performed using fluorometric methods (e.g., Qubit fluorometer), and samples are stored at -80°C until use [19].
STR Genotyping: STRs are analyzed using commercially available multiplex systems (e.g., SiFaSTR 23-plex system), which typically include 21 autosomal STRs and sex-determination markers. PCR reactions are conducted according to manufacturer protocols with strict temperature cycling conditions [19].
Capillary Electrophoresis and Analysis: Amplified products are separated by size using capillary electrophoresis systems (e.g., Classic 116 Genetic Analyzer) with laser-induced fluorescence detection. Genotyping software (e.g., GeneManager) automatically calls alleles based on fragment size compared to internal size standards [19] [29].
Authentication Algorithms: For cell line authentication, STR profiles are compared using similarity algorithms. The Tanabe algorithm calculates: Percent Match = (2 × number of shared alleles)/(total alleles in query + total alleles in reference) × 100%. Related cell lines typically show scores ≥90%. The Masters algorithm uses: Percent Match = (number of shared alleles)/(total alleles in query) × 100%, with scores ≥80% indicating relatedness [19].
Key Research Reagents and Solutions
Table 1: Essential Research Reagents for STR Profiling
| Reagent/Kit | Function | Example Products |
|---|---|---|
| DNA Extraction Kits | Isolate high-quality genomic DNA from biological samples | QIAamp DNA Blood Mini Kit |
| STR Multiplex Kits | Simultaneously amplify multiple STR loci in a single PCR reaction | SiFaSTR 23-plex, GlobalFiler, PowerPlex |
| Fluorescent Dyes | Label PCR products for detection during electrophoresis | FAM, TET, HEX, NED, FRET-modified ET dyes |
| Capillary Electrophoresis Systems | Separate amplified DNA fragments by size with high resolution | GA118-24B, ABI Prism 310, Classic 116 Genetic Analyzer |
| Size Standards | Precisely determine fragment sizes during analysis | Internal Lane Standards labeled with different fluorescent dyes |
Comparative Analysis: STR Profiling vs. Isoenzyme Analysis
Technical Performance Metrics
Table 2: Performance Comparison of Authentication Methodologies
| Parameter | STR Profiling | Isoenzyme Analysis |
|---|---|---|
| Discrimination Power | Match probabilities of 1 in quintillions (1×10¹⁸) [27] | Combined exclusion probability of ~69% with 7 systems [26] |
| Required Sample | Nanogram quantities of DNA; compatible with degraded samples [28] [29] | Fresh viable cells with active enzyme expression required |
| Polymorphism Basis | Variation in DNA sequence (repeat number) [28] | Variation in protein electrophoretic mobility [26] |
| Technology Platform | PCR + Capillary Electrophoresis [27] [29] | Starch/polyacrylamide gel electrophoresis + staining [26] |
| Multiplex Capacity | 20-70 loci simultaneously [29] | Typically 1-2 systems per gel |
| Result Interpretation | Digital (discrete alleles) [28] | Analog (band intensity patterns) |
| Application Scope | Forensic ID, cell authentication, paternity testing [28] [19] [27] | Primarily paternity testing (historical) [26] |
Experimental Validation Data
Recent studies demonstrate STR profiling's exceptional performance in practical research scenarios. A 2025 investigation evaluating 91 human cell lines preserved for 34 years achieved complete STR profiles from all successfully revived samples, confirming the method's reliability for long-term authentication [19]. The study identified genetic alterations in 25.5% of samples, including loss of heterozygosity (11.8%) and additional alleles (13.7%), highlighting STR profiling's sensitivity to genetic drift during long-term culture [19].
In tumor cell line authentication, a comprehensive analysis of 482 human tumor cell lines revealed that 20.5% (99/482) were incorrectly identified, with STR profiling detecting 14.5% as intra-species cross-contaminations [1]. Importantly, this study also demonstrated that STR profiling alone is insufficient to exclude inter-species cross-contamination, requiring supplemental species verification by PCR to detect the 4.4% of cell lines contaminated with non-human species [1].
For isoenzyme analysis, historical data indicates significantly lower exclusion probabilities. While the HLA system combined with blood groups achieved exclusion probabilities of 95-97.2% in paternity testing, this required multiple complex techniques and still could not resolve all cases, particularly incestuous relationships [26]. Serum proteins alone provided only a 62% exclusion rate, and even with seven blood group systems, the combined exclusion probability reached just 67-69% [26].
STR profiling represents a definitive advancement over isoenzyme analysis for authentication research, offering superior discrimination power, reproducibility, and application scope. The digital nature of STR data enables precise genetic fingerprinting with infinitesimal match probabilities unattainable with protein-based systems. For researchers and drug development professionals, STR profiling provides a standardized, automated methodology compatible with diverse sample types—from pristine cell cultures to compromised forensic evidence.
The experimental data presented confirms STR profiling's critical role in maintaining research integrity through accurate cell line authentication, with studies revealing substantial misidentification rates in tumor cell line collections. While isoenzyme analysis served as an important historical tool, STR profiling has unequivocally superseded it for modern authentication applications. As the field evolves, emerging multidye fluorescent detection systems promise even greater multiplexing capabilities, further enhancing STR profiling's value for genetic authentication across research and clinical contexts.
The authentication of cell lines is a critical pillar of reproducible biomedical research. For decades, the scientific community relied on techniques like isoenzyme analysis to verify species of origin and detect gross interspecies contamination. While useful for determining species, isoenzyme analysis offers limited power to distinguish between cell lines from the same species and suffers from low reproducibility [30]. The field has since undergone a paradigm shift, moving towards Short Tandem Repeat (STR) profiling as the definitive method for cell line authentication. STR profiling operates on the same principle as forensic DNA fingerprinting, using polymorphic markers in the genome to establish a unique DNA signature for every human cell line [10] [30]. This guide provides a comparative analysis of modern STR kits, from the established standard of the 13-core loci to advanced multiplex systems, offering researchers a data-driven framework for selecting the appropriate tool for their authentication needs.
STR Profiling vs. Isoenzyme Analysis: A Comparative Framework
The transition from isoenzyme analysis to STR profiling represents an evolution in authentication technology, driven by the need for greater discriminatory power and reproducibility. The table below summarizes the core differences between these two methodologies.
Table 1: Comparison of Cell Line Authentication Methods
| Feature | STR Profiling | Isoenzyme Analysis |
|---|---|---|
| Principle | PCR amplification of DNA microsatellites [10] | Electrophoretic separation of protein isoforms [16] |
| Discriminatory Power | Unique identification to the individual level [4] | Verification of species of origin [16] |
| Throughput | High (multiplex PCR) [10] | Moderate |
| Reproducibility | High | Low to moderate [30] |
| Primary Application | Intraspecies identification, detection of cross-contamination [10] | Interspecies contamination check [16] |
STR profiling's key advantage is its ability to detect intraspecies cross-contamination, a prevalent problem where one human cell line is overgrown by another, more vigorous one (e.g., HeLa). It is estimated that 15-20% of cell lines in use may be misidentified, which can lead to spurious and irreproducible research findings [30]. While isoenzyme analysis remains a valuable tool for a quick check of species origin, STR profiling is the only method that can establish identity to the individual level, making it indispensable for confirming that a cell line is truly derived from its claimed donor tissue [4].
Core STR Markers and Advanced Kit Architectures
The Foundation: ANSI/ATCC 13 Core Loci
To standardize authentication practices, the ANSI/ATCC ASN-0002 consensus standard recommends a minimum of 13 core STR markers for uniquely identifying human cell lines [31]. These loci—D5S818, D13S317, D7S820, D16S539, vWA, TH01, TPOX, CSF1PO, D8S1179, D3S1358, D18S51, D21S11, and FGA—are highly polymorphic in the human genome. When used together, they provide a theoretical discrimination rate of 5.02 x 10^16 for unrelated individuals, effectively guaranteeing a unique profile for every human cell line [31]. This core set forms the foundation upon which many commercial STR kits are built.
Evolution to Multiplex Kits: Key Commercial Systems
Commercial STR kits have expanded upon the core 13 loci, incorporating additional markers to increase discriminatory power and provide robust performance across various sample types. The following table compares several advanced kits used in research and forensics.
Table 2: Comparison of Advanced Commercial STR Kits
| STR Kit | Total Markers (Autosomal STRs) | Notable Features | Validated Applications |
|---|---|---|---|
| GlobalFiler | 21 [32] | Includes amelogenin for gender determination [32] | Human identification, cross-species amplification in chimpanzees [32] |
| Investigator 24plex QS | 22 [32] | Includes quality sensors (QS1, QS2) [32] | Human identification, cross-species amplification in chimpanzees [32] |
| PowerPlex Fusion 6C | 23 (18 CODIS + 5 discriminative) [32] | Follows CODIS & ESS recommendations; includes rapidly mutating Y-STRs [32] | Human identification, cross-species amplification in chimpanzees [32] |
| PowerPlex ESI17 | 17 [33] | - | Comparable performance to NGMSElect for forensic casework [33] |
| AmpFℓSTR NGMSElect | 17 [33] | - | Comparable performance to PowerPlex ESI17 for forensic casework [33] |
Experimental Performance Data and Protocol
Performance Comparison in Challenging Samples
The choice of STR kit can significantly impact the success of DNA profiling, especially with low-quality or low-quantity template DNA, such as "touch DNA" samples. A 2021 study compared six commercially available STR kits applied to touch DNA on various substrates [34]. The results highlighted that the percentage of informative profiles (those with ≥12 autosomal alleles) was significantly dependent on the kit and the donor, but not the substrate type.
- VeriFiler Plus generated informative profiles in the largest number of samples (94%).
- PowerPlex 21 amplification resulted in the fewest informative profiles (79%).
- Investigator 24Plex QS and GlobalFiler showed no significant difference in empirical performance, though the former produced profiles with more baseline noise, making them harder to analyse [34].
Cross-Species Applicability
The cross-reactivity of human-specific STR kits is an important consideration for researchers working with xenografts or studying non-human primates. A 2021 study validated the use of three human STR kits in chimpanzees [32]. The PowerPlex Fusion 6C system successfully amplified the most loci (20 loci), followed by GlobalFiler and Investigator 24plex QS (18 loci each). Notably, the amelogenin (AMEL) marker successfully assigned gender in chimpanzees across all three kits, confirming its utility for gender determination in cross-species applications [32].
Detailed Experimental Workflow for STR Profiling
The standard protocol for STR profiling involves a series of calibrated steps, from sample preparation to data interpretation. The following workflow diagram and description outline the key stages.
Diagram Title: STR Profiling Workflow
Step-by-Step Protocol:
- DNA Extraction: Genomic DNA is extracted from the cell line using a commercial kit (e.g., Qiagen DNeasy Blood and Tissue Kit) following the manufacturer's protocol [32]. The quantity and quality of DNA should be assessed.
- PCR Amplification: A multiplex PCR reaction is set up using a commercial STR kit. The reaction simultaneously amplifies the targeted STR loci, plus the amelogenin gene for gender determination. For example, the Promega PowerPlex 18D System amplifies 17 STR loci and amelogenin [31]. Thermocycling is performed according to the kit's specifications (e.g., using a GeneAmp PCR system 9700) [32].
- Capillary Electrophoresis: The amplified PCR products are separated by size using capillary electrophoresis (e.g., on an ABI 3130 Genetic Analyzer) [32]. This process distinguishes the different alleles at each locus based on their fragment length.
- Fragment Analysis and Allele Calling: The data from capillary electrophoresis is analyzed using software such as GeneMapper ID-X [31]. The software identifies the peaks corresponding to alleles and assigns an alphanumeric score based on the number of repeats present at each locus.
- Database Comparison: The resulting STR profile is compared against a reference database, such as the ATCC STR Database, which contains the profiles of over 2,700 human cell lines. This step confirms the identity of the cell line or reveals a cross-contamination [31] [30].
The Scientist's Toolkit: Essential Research Reagents and Materials
Table 3: Key Research Reagent Solutions for STR Profiling
| Item | Function | Example Products/Brands |
|---|---|---|
| STR Multiplex Kits | Simultaneously amplify multiple STR loci in a single PCR reaction. | GlobalFiler, Investigator 24plex QS, PowerPlex Fusion 6C, PowerPlex 18D [31] [32] [34] |
| DNA Polymerase | Enzyme that catalyzes the amplification of DNA during PCR. | Included in commercial STR kits |
| Fluorescent Dye-Labeled Primers | Allow detection and sizing of PCR amplicons during capillary electrophoresis. | Included in commercial STR kits [10] |
| Capillary Electrophoresis System | Separates amplified DNA fragments by size for genotyping. | ABI 3130 Genetic Analyzer [32] |
| Genetic Analysis Software | Analyzes electrophoretic data to call alleles and generate STR profiles. | GeneMapper ID-X Software [31] |
| DNA Extraction Kits | Isolate high-quality genomic DNA from cell lines. | Qiagen DNeasy Blood and Tissue Kit [32] |
| STR Profile Database | Publicly searchable database to compare STR results against known cell line profiles. | ATCC STR Database [31] [30] |
The adoption of standardized STR profiling, guided by the ANSI/ATCC standards, has fundamentally improved the integrity of cell-based research. The technology has evolved from the foundational 13-core loci to sophisticated multiplex systems like the 24-plex kits, which offer enhanced discrimination and reliability. While STR profiling remains the gold standard for authentication, the field continues to advance. Emerging methods, such as microhaplotype (MH) panels, show promise in overcoming specific limitations of STRs, particularly in the analysis of complex DNA mixtures, by exhibiting higher capability to recover a minor contributor's alleles and provide higher Likelihood Ratio values [35]. For now, the integration of STR profiling into routine cell culture practice, complemented by regular mycoplasma testing and morphological checks, is non-negotiable for ensuring that research data is valid, reproducible, and trustworthy.
Isoenzyme analysis through electrophoretic separation serves as a fundamental tool in biochemical research and clinical diagnostics, providing critical insights into tissue-specific metabolic states and cellular damage. This guide objectively compares the performance of various electrophoretic techniques for separating lactate dehydrogenase (LDH) isoenzymes, with supporting experimental data highlighting their respective resolutions, applications, and limitations. Framed within the broader context of cell line authentication methodologies, we examine how traditional isoenzyme analysis compares with more modern STR profiling approaches, detailing the specific scenarios where each technique offers distinct advantages for research validation and quality control in scientific and drug development applications.
Isoenzymes, or isozymes, are multiple forms of an enzyme that catalyze the same biochemical reaction but differ in their amino acid sequence, which leads to variations in their kinetic characteristics, physicochemical properties, and electrophoretic mobility [36]. These differences arise from genetically determined variations in primary structure, meaning true isoenzymes are the products of different gene loci rather than post-translational modifications of the same polypeptide chain [37]. The separation and quantification of these isoenzymes provide a powerful diagnostic tool because their distribution patterns vary characteristically across different tissues, allowing researchers and clinicians to identify the tissue origin of enzyme release in various pathological conditions.
Electrophoresis exploits the differential net charge and size of protein molecules to separate them in an electric field. When applied to isoenzymes, this technique can resolve multiple forms based on their migration rates through a stabilizing medium such as agarose, polyacrylamide, or starch gel. The resolution achieved depends critically on factors including the pH of the electrophoresis buffer, the pore size of the gel matrix, and the specific electrophoretic technique employed [36] [38]. Lactate dehydrogenase (LDH), a tetrameric enzyme crucial for anaerobic glycolysis, exists in five principal somatic forms (LDH1-LDH5) in most vertebrates, making it an ideal model system for demonstrating isoenzyme separation techniques and their research applications.
Lactate Dehydrogenase: A Model System for Isoenzyme Analysis
Biochemical Basis and Tissue Distribution
Lactate dehydrogenase (LDH; EC 1.1.1.27) catalyzes the reversible conversion of pyruvate to lactate with nicotinamide adenine dinucleotide (NAD+) as a coenzyme, playing a pivotal role in cellular energy metabolism [36]. In vertebrates, somatic LDH is a tetrameric enzyme composed of combinations of two different subunits, designated H (for "heart") and M (for "muscle"), which are encoded by the LDHB and LDHA genes located on different chromosomes, respectively [37]. The five possible isoenzymes are LDH1 (H4), LDH2 (H3M1), LDH3 (H2M2), LDH4 (H1M3), and LDH5 (M4), each with distinct electrophoretic mobilities and kinetic properties [36].
These isoenzymes demonstrate different tissue distributions that reflect the metabolic priorities of various organs. LDH1 predominates in heart muscle and erythrocytes, while LDH5 is most abundant in liver and skeletal muscle [37]. The H4 isoenzyme (LDH1) has a lower Michaelis constant (Km) for pyruvate and is more sensitive to substrate inhibition at high pyruvate concentrations, making it better suited for aerobic metabolism in cardiac tissue where lactate is primarily utilized as a fuel. Conversely, the M4 isoenzyme (LDH5) functions more effectively in anaerobic conditions to convert pyruvate to lactate, supporting the metabolic demands of skeletal muscle during intense activity [36]. This differential distribution provides the diagnostic utility of LDH isoenzyme patterns, with elevations of specific isoenzymes indicating damage to their tissues of origin—for instance, LDH1 elevation in myocardial infarction or hemolytic anemia, and LDH5 elevation in hepatic disorders or muscular dystrophy [37].
LDH in Disease and Research Contexts
Beyond its established role as a marker for tissue damage, LDH has emerged as a significant biomarker in oncology. Serum LDH levels serve as a prognostic factor in various cancers, including metastatic colorectal cancer, where elevated pretreatment LDH is associated with shorter overall survival [39]. The enzyme reflects metabolic changes in cancer cells, acting as an indirect marker of tumor hypoxia, neoangiogenesis, and metastasis [39]. Recent research has revealed unexpected intracellular roles for LDH, including nuclear translocation in response to cellular injury. In experimental models of acute liver failure, both LDH and the pyruvate dehydrogenase complex (PDHC) translocate to the nucleus, leading to increased nuclear lactate and acetyl-CoA concentrations, histone H3 hyperacetylation, and expression of damage response genes [40]. Inhibition of LDH in these models reduced liver damage and improved survival, suggesting potential therapeutic applications [40].
Electrophoretic Techniques for LDH Separation: A Comparative Analysis
The resolution of LDH isoenzymes depends critically on the electrophoretic methodology employed, with different techniques offering varying degrees of separation efficiency, particularly across species and tissue types.
Supporting Media and Buffer Systems
Agarose Gel Electrophoresis provides a standard method for separating mammalian LDH isoenzymes, typically using alkaline buffer systems (pH 8.6-8.8) where the five forms migrate toward the anode at different rates based on their net charge [36]. However, this conventional approach has limitations for certain applications, particularly with bird LDH isoenzymes, which typically produce a poorly resolved pattern of one diffuse zone under these conditions due to the relatively small charge differences between the H and M subunits in avian species [36].
Polyacrylamide Gel Electrophoresis (PAGE) offers enhanced resolution based on both charge and molecular sieving effects. Discontinuous gradient systems (e.g., 8-25% or 10-15% polyacrylamide) can improve separation, with protocols typically running at 400V for 45 minutes at 4°C to prevent enzyme denaturation, particularly of the more labile LDH4 and LDH5 isoenzymes [36].
Agar-Agarose Mixed Gels represent a specialized approach that utilizes the endosmotic properties of gel mixtures to improve resolution. By combining a gel with high electroendosmotic properties (agar) with one having low electroendosmosis (agarose), researchers achieved superior separation of LDH isoenzymes, with the optimal ratio and positioning of the application slit critical to the enhanced resolution [38].
Isoelectric Focusing (IEF) has proven particularly effective for resolving LDH isoenzymes that are difficult to separate by conventional electrophoresis. Using a pH gradient of 3-9 in homogeneous 5% polyacrylamide gel containing carrier ampholytes, IEF enables clear resolution of all five bird LDH isoenzymes in a single run, typically performed at 2000V for 20 minutes at 15°C [36]. This method separates proteins based on their isoelectric points rather than size or charge alone, making it ideal for resolving isoforms with minimal differences in net charge.
Table 1: Comparison of Electrophoretic Techniques for LDH Isoenzyme Separation
| Technique | Optimal Conditions | Resolution | Advantages | Limitations |
|---|---|---|---|---|
| Agarose Gel Electrophoresis | pH 8.6-8.8 buffer, 45-60 min | Good for mammalian LDH, poor for bird LDH | Rapid, simple, cost-effective | Limited resolution for closely migrating isoforms |
| Polyacrylamide Gel (PAGE) | 8-25% gradient, 400V, 45min at 4°C | High resolution for mammalian LDH | Superior resolution via molecular sieving | More complex protocol, longer run times |
| Agar-Agarose Mixture | Optimized agar:agarose ratio | Improved resolution utilizing endosmosis | Enhanced separation without specialized equipment | Requires optimization of gel composition |
| Isoelectric Focusing (IEF) | pH 3-9 gradient, 2000V, 20min at 15°C | Excellent for all species, including birds | Highest resolution for charge variants | Specialized equipment required, higher cost |
Experimental Protocol for LDH Separation and Detection
Sample Preparation: Tissue samples should be homogenized in cold buffer (e.g., 0.05 mol/L Tris-HCl buffer, pH 7.3 with 0.01% EDTA) using approximately 1:10 (w/v) tissue to buffer ratio. Homogenates are centrifuged at 19,000 × g for 30 minutes at 4°C, and the supernatant is collected for analysis [36]. For serum samples, blood should be collected using standard phlebotomy techniques, avoiding hemolysis which can artificially elevate LDH1 and LDH2 from erythrocyte contamination. Samples should be processed on the same day as collection, with electrophoresis performed under cooling (4°C) to preserve enzyme activity, particularly for the more labile LDH4 and LDH5 isoenzymes [36] [37].
Electrophoresis Procedure: For standard agarose gel electrophoresis, prepare a 0.8-1.0% agarose gel in appropriate buffer (e.g., 0.88 mol/L L-alanine/0.25 mol/L Tris, pH 8.8). Apply samples (typically 5-10 μL serum or tissue extract) to wells and run at 90-100V for approximately 45-60 minutes with cooling. For IEF, prepare gels containing carrier ampholytes (pH 3-9) and run at higher voltages (2000V) for shorter durations (20 minutes) [36].
Activity Staining: Following electrophoresis, LDH isoenzymes are visualized using a specific activity stain based on their catalytic function. The staining mixture typically contains: 1.0 mol/L sodium lactate as substrate, NAD+ as coenzyme, nitroblue tetrazolium (NBT) as electron acceptor, and phenazine methosulfate (PMS) as an electron carrier [37]. The reaction principle is: Lactate + NAD+ → Pyruvate + NADH + H+. NADH + H+ + PMS → NAD+ + PMS (reduced). PMS (reduced) + NBT → PMS + Formazan (purple insoluble precipitate). The gel is incubated in this staining solution in the dark at 37°C for 20-30 minutes until purple bands appear, with the reaction stopped by rinsing with water [37]. Staining must be performed in darkness as PMS is light-sensitive.
Quantification: Separated and stained isoenzyme bands can be quantified using densitometry, with the relative percentage of each isoenzyme calculated based on the integrated optical density of corresponding bands. Normal serum LDH isoenzyme distribution typically shows: LDH1 (14-26%), LDH2 (29-39%), LDH3 (20-26%), LDH4 (8-16%), and LDH5 (6-16%) [37].
Diagram 1: LDH Isoenzyme Analysis Workflow
Comparative Experimental Data and Performance Metrics
Resolution Efficiency Across Species
The electrophoretic separation of LDH isoenzymes demonstrates significant variation in resolution efficiency across different species and techniques. For mammalian LDH, conventional agarose gel electrophoresis at pH 8.6-8.8 typically resolves all five isoenzymes into distinct bands, with LDH1 (H4) showing the fastest anodal migration and LDH5 (M4) the slowest [36]. The three hybrid forms (LDH2, LDH3, LDH4) typically display relatively even spacing between LDH1 and LDH5 on the electrophoretogram under optimal conditions.
However, avian LDH isoenzymes present a particular challenge under standard mammalian separation conditions. The H and M subunits of bird LDH exhibit minimal differences in net charge at alkaline pH, resulting in compression of the isoenzyme pattern into one diffuse zone with poor resolution of individual forms [36]. Isoelectric focusing in the pH range 3-9 successfully overcomes this limitation, resolving all five bird LDH isoenzymes into distinct, sharp bands with baseline separation. This technique has been successfully applied to various bird species including chicken, turkey, pheasant, and pigeon, as well as to embryonic tissue samples where developmental changes in LDH expression patterns can be monitored [36].
Table 2: Kinetic Properties of LDH Isoenzymes Across Species
| Species | Isoenzyme | Km for Pyruvate (mol.l⁻¹) | kcat (s⁻¹) |
|---|---|---|---|
| Chicken | H4 | 8.9 × 10⁻⁵ | 45,000 |
| M4 | 3.2 × 10⁻³ | 93,400 | |
| Rabbit | H4 | 6.7 × 10⁻⁵ | 41,000 |
| M4 | 3.5 × 10⁻⁴ | Not determined | |
| Cattle | H4 | 7.1 × 10⁻⁵ | 49,400 |
| M4 | 1.0 × 10⁻⁴ | 80,200 |
Technical Performance Metrics
The performance of different electrophoretic techniques can be quantitatively assessed based on resolution efficiency, run time, and reproducibility. Agarose gel electrophoresis typically provides resolution sufficient for clinical diagnostic applications with mammalian samples, completing separation in 45-60 minutes with inter-assay coefficients of variation of 5-10% for major isoenzyme bands [36]. Polyacrylamide gradient gels offer enhanced resolution, particularly for hybrid forms, but require longer run times (typically 45 minutes to several hours) and more specialized equipment.
Isoelectric focusing demonstrates superior resolution capabilities, particularly for challenging separations like avian LDH isoenzymes, with sharply focused bands that facilitate accurate quantification. However, this technique requires higher voltages (2000V) and specialized ampholyte reagents, increasing both operational complexity and cost [36]. The agar-agarose mixed gel approach represents a compromise, improving resolution over standard agarose gels without the equipment requirements of IEF, though it necessitates optimization of the gel composition for specific applications [38].
Detection sensitivity varies with the activity staining method employed, with the tetrazolium-based system typically detecting LDH activities as low as 0.5-1.0 U/L under optimal conditions. The linear range for quantification generally spans from 10-800 U/L, covering the clinically significant range for most applications [37].
The Scientist's Toolkit: Essential Research Reagents
Successful electrophoretic separation of LDH isoenzymes requires specific reagents and materials, each serving distinct functions in the analytical process.
Table 3: Essential Reagents for LDH Isoenzyme Analysis
| Reagent/Material | Function | Specifications/Alternatives |
|---|---|---|
| Agarose/Acrylamide | Supporting matrix for electrophoresis | High purity; 0.8-1.0% agarose or 5-8% acrylamide |
| Tris-HCl Buffer | Homogenization and electrophoresis buffer | 0.05-0.1 M, pH 7.3-8.8 |
| NAD+ (Nicotinamide adenine dinucleotide) | Coenzyme in activity stain | Oxidized form, high purity |
| Nitrobue Tetrazolium (NBT) | Electron acceptor in stain | Forms purple formazan precipitate upon reduction |
| Phenazine Methosulfate (PMS) | Electron carrier in activity stain | Light-sensitive, requires dark incubation |
| Sodium Lactate | Enzyme substrate in activity stain | 1.0 M solution, pH adjusted |
| Pharmalyte Carrier Ampholytes | For IEF (pH 3-9) | Creates pH gradient for isoelectric focusing |
| Protein Standard | Migration reference | LDH isoenzyme control or purified LDH forms |
Isoenzyme Analysis vs. STR Profiling in Authentication Research
Within the context of cell line authentication and research validation, isoenzyme analysis and Short Tandem Repeat (STR) profiling represent complementary but fundamentally different approaches with distinct applications and performance characteristics.
Isoenzyme analysis provides information about the functional metabolic state of cells, reflecting tissue origin and differentiation status through the expression pattern of specific enzyme variants. The technique detects phenotypic expression rather than genetic identity, making it particularly valuable for monitoring cellular differentiation, detecting tissue-specific damage, and identifying metabolic adaptations in pathological states such as cancer [36] [39]. For example, the characteristic LDH isoenzyme shift toward the M subunit (LDH5) in many cancer cells reflects the metabolic adaptation to anaerobic glycolysis (the Warburg effect), providing functional information beyond mere identification.
STR profiling, in contrast, analyzes highly polymorphic repetitive DNA sequences to create a unique genetic fingerprint of a cell line, enabling precise identification and detection of cross-contamination between lines. While STR profiling offers unambiguous genetic identification with high sensitivity and specificity, it provides no information about the functional state, metabolic characteristics, or differentiation status of the cells. STR profiling has become the gold standard for cell line authentication due to its discriminatory power and reproducibility, particularly in research settings where cross-contamination represents a significant concern.
The two techniques therefore serve complementary roles in authentication research: STR profiling establishes genetic identity and detects contamination, while isoenzyme analysis verifies functional characteristics and tissue-specific metabolic states. For research requiring both lineage verification and functional validation—such as in stem cell differentiation studies or characterization of engineered cell models—the combination of both approaches provides comprehensive authentication spanning both genotypic and phenotypic domains.
Diagram 2: Authentication Methods Comparison
Electrophoretic separation of LDH isoenzymes remains a versatile and informative technique with broad applications across basic research, clinical diagnostics, and cell authentication. The comparative performance of different electrophoretic methods—from conventional agarose gels to sophisticated isoelectric focusing—offers researchers a range of options tailored to their specific resolution requirements and experimental constraints. While newer molecular techniques like STR profiling have supplanted isoenzyme analysis for certain applications such as pure cell line identification, the functional metabolic information provided by LDH isoenzyme patterns continues to make it relevant for understanding cellular physiology and pathological states. The ongoing discovery of novel LDH functions, including its role in nuclear signaling and epigenetic regulation, suggests that this classic enzyme system will continue to yield new insights through the application of these established but continually refined separation methodologies.
Cell line authentication stands as a critical pillar of reproducible biomedical research. The use of misidentified or cross-contaminated cell lines has generated spurious data, wasting significant scientific resources and compromising translational findings [1] [4]. Two predominant methodologies for cell authentication are Short Tandem Repeat (STR) profiling, which provides a unique DNA fingerprint for individual-level identification, and isoenzyme analysis, a traditional method for verifying species of origin [4] [16]. This guide provides a detailed, step-by-step workflow for researchers, comparing these techniques from initial DNA extraction through final data analysis to establish a robust framework for cell line quality control.
DNA Extraction and Sample Preparation
The authentication workflow begins with the preparation of high-quality DNA, a prerequisite for reliable downstream analysis.
Genomic DNA Extraction Protocols
The primary goal of genomic DNA extraction is to efficiently separate DNA from other cellular components (proteins, lipids, RNA) while maintaining its integrity and purity [41].
- Procedure: Protocols typically involve cell lysis, often with a specialized lysis buffer, followed by protein degradation (e.g., with Proteinase K), and final purification of DNA from the resulting lysate. For STR profiling, spot cells onto a specialized FTA card, which lyses cells, denatures proteins, and protects DNA from degradation [13].
- Quality Control: Assess the concentration and purity of the extracted DNA using a spectrophotometer (e.g., A260/A280 ratio). For STR profiling, the DNA must be of sufficient quality and quantity for multiplex PCR amplification.
Core Authentication Methodologies: STR Profiling vs. Isoenzyme Analysis
This section details the experimental protocols for the two primary authentication techniques.
Short Tandem Repeat (STR) Profiling
STR profiling establishes a DNA fingerprint for human cell lines by analyzing highly polymorphic genomic loci [10].
Experimental Protocol for STR Profiling:
Multiplex PCR Amplification:
- Primer Design: Use a commercial STR kit (e.g., Promega PowerPlex series) containing fluorescently-labeled primers designed to amplify a standardized panel of STR loci. These are short DNA sequences with a core repeat of 2-6 base pairs (e.g., GATA) that are variable in the human population [10].
- PCR Setup: The PCR reaction simultaneously amplifies multiple STR loci (e.g., 17 loci plus the amelogenin gene for sex determination). One primer per pair is labeled with a fluorescent dye, and PCR is performed according to the kit's protocol [10] [13].
Capillary Electrophoresis (CE):
- The fluorescently-labeled PCR products are separated by size using capillary electrophoresis.
- An internal size standard (ISS) is run with each sample, allowing for accurate determination of the length of each PCR amplicon to within approximately 0.5 nucleotides [10].
Data Analysis and Allele Calling:
- The CE instrument detects the fluorescent signals, which are displayed as an electropherogram with peaks representing the different alleles at each STR locus.
- The length of the PCR amplicon is used to deduce the number of repeats at that locus. The results are compared to an allelic ladder, a standard containing common alleles, for accurate allele designation (e.g., allele 9, 10, or a microvariant like 9.3) [10].
- The resulting STR profile is compared against reference databases (e.g., ATCC or DSMZ STR databases) to authenticate the cell line [1] [13].
Isoenzyme Analysis
Isoenzyme analysis verifies the species of origin by exploiting the electrophoretic mobility differences of homologous enzymes between species [16].
Experimental Protocol for Isoenzyme Analysis:
- Sample Preparation: Prepare cell lysates from the culture to be authenticated.
- Gel Electrophoresis: Load the lysates onto a support medium, typically a starch or polyacrylamide gel.
- Electrophoretic Separation: Apply an electric field to separate enzymes based on their charge and size. The specific protocol can be found in manuals such as Culture of Animal Cells: A Manual of Basic Technique [16].
- Enzyme-Specific Staining: After separation, the gel is incubated with a specific substrate and staining solution for a target enzyme (e.g., glucose-6-phosphate dehydrogenase). The staining reaction produces a visible band at the location of the enzyme.
- Interpretation: The distance the band has migrated is characteristic of that enzyme's form in a particular species. The pattern of several enzymes creates a species-specific profile, confirming the species identity and revealing inter-species contamination [16].
Downstream Analysis and Interpretation
Interpreting Gel Electrophoresis for Isoenzyme Analysis
While STR uses capillary electrophoresis, isoenzyme analysis relies on interpreting physical gel electrophoresis.
- Recording: Capture a clear digital image of the gel for documentation and analysis [42].
- Troubleshooting: Assess gel quality. Smearing can be caused by overloading DNA, excessive voltage causing heating, or using an insufficient running buffer [42].
- Interpretation: Identify the banding pattern for the stained enzyme and compare it to known species standards. A single band confirms a pure sample, while multiple bands may indicate inter-species contamination.
STR Data Analysis and Database Comparison
The raw data from STR profiling requires expert interpretation.
- Analysis: STR scientists analyze the electropherogram for alleles, accounting for artifacts like stutter peaks (small peaks typically one repeat unit smaller than a true allele, caused by PCR slippage) [10] [13].
- Authentication: The final STR profile is compared to a reference database. A match ≥80% is often required for authentication. Non-matching profiles indicate a misidentified cell line [13].
- Mixture Detection: The presence of three or more alleles at multiple loci suggests a mixture of cell lines, which can be further analyzed with specialized software like EuroForMix [35].
Comparative Performance Data: STR Profiling vs. Isoenzyme Analysis
The following tables summarize the quantitative and qualitative performance of the two authentication methods based on experimental data.
Table 1: Quantitative Performance Comparison from Experimental Studies
| Parameter | STR Profiling | Isoenzyme Analysis | Experimental Context |
|---|---|---|---|
| Intra-Species Cross-Contamination Detection | 14.5% (71/482 cell lines) [1] | Not Applicable (cannot identify individual-level contamination) | Analysis of 482 human tumor cell lines [1] |
| Inter-Species Cross-Contamination Detection | 4.4% (21/482 cell lines) when combined with species ID [1] | Primary Function | Analysis of 482 human tumor cell lines [1] |
| Total Misidentification Rate Detected | 20.5% (combined STR & species ID) [1] | Not Specifically Quantified | Analysis of 482 human tumor cell lines [1] |
| Performance in Mixture Analysis | Lower recovery of minor contributor alleles; hindered by stutter [35] | Not Applicable | Comparison with Microhaplotype (MH) panels [35] |
Table 2: Qualitative Method Characteristics and Applications
| Characteristic | STR Profiling | Isoenzyme Analysis |
|---|---|---|
| Primary Function | Individual-level identification and intra-species contamination detection [4] | Species verification and inter-species contamination detection [16] |
| Key Advantage | High discrimination power between individuals of the same species [4] | Rapid and cost-effective for species confirmation [16] |
| Limitation | Cannot exclude inter-species cross-contamination on its own [1] | Cannot detect contamination by another cell line of the same species [4] |
| Technology & Throughput | High-tech, requires capillary electrophoresis instrument and specialized software [10] | Low-tech, requires only standard gel electrophoresis equipment [16] |
| Standardization | Highly standardized with commercial kits and consensus guidelines (e.g., ANSI-ATCC ASN-0002) [10] [13] | Less standardized; relies on individual lab protocols [16] |
Workflow Visualization
The following diagram illustrates the integrated workflow for comprehensive cell line authentication, combining both STR profiling and isoenzyme analysis.
The Scientist's Toolkit: Essential Research Reagents
Table 3: Key Reagents and Materials for Cell Authentication
| Item | Function | Example/Kits |
|---|---|---|
| FTA Sample Collection Card | For easy sample collection, cell lysis, and DNA stabilization for STR analysis [13] | ATCC FTA Sample Collection Kit [13] |
| Commercial STR Kit | Contains primers, enzymes, and buffers for multiplex PCR of standardized STR loci [10] [43] | PowerPlex 18D, PowerPlex 35GY [13] [43] |
| Allelic Ladder | DNA size standard containing common alleles for accurate STR allele calling [10] | Included in commercial STR kits |
| DNA Stain (Fluorescent) | For detecting DNA fragments in capillary electrophoresis of STR products [10] | Fluorescent dyes in STR kits |
| Enzyme Substrates & Stains | For visualizing specific enzyme activities after electrophoretic separation in isoenzyme analysis [16] | Specific to each enzyme (e.g., for Glucose-6-Phosphate Dehydrogenase) |
| DNA Ladder | Molecular weight standard for estimating fragment size in agarose gel electrophoresis [42] | 100 bp DNA Ladder [42] |
| Reference Databases | For comparing STR profiles to authenticate cell lines and detect misidentification [1] [13] | ATCC STR Database, DSMZ STR Database [1] [13] |
STR profiling and isoenzyme analysis are complementary, not competing, techniques for cell line authentication. STR profiling is the unequivocal gold standard for confirming that a human cell line is derived from the correct individual and has not been replaced by another human cell line [1] [4]. However, as the data shows, STR profiling alone is insufficient to guard against inter-species contamination [1]. Isoenzyme analysis provides a straightforward, cost-effective method to verify the species of origin. For rigorous quality control, an integrated approach is recommended. This involves routine STR profiling of human cell lines upon receipt, after 10 passages, and before key experiments, supplemented by periodic species verification, especially when working with multiple species or using feeders and xenografts [13] [16]. Adopting this combined workflow, supported by good cell culture practices, is essential for ensuring the integrity and reproducibility of research data.
Authenticating New Cell Lines, Biobanked Samples, and Post-Xenograft Cultures
The integrity of biological models is a cornerstone of reproducible biomedical research. Cell lines, biobanked samples, and patient-derived xenograft (PDX) models serve as invaluable tools for understanding disease mechanisms and developing novel therapeutics. However, these biological resources are consistently vulnerable to misidentification, cross-contamination, and genetic drift, compromising experimental validity and translational potential. Alarming studies indicate that 15-45% of cell lines are misidentified, leading to erroneous conclusions and substantial financial waste—estimated at over $900 million for research on just two HeLa-contaminated cell lines [44]. Within this context, authentication becomes not merely a best practice but an ethical imperative for ensuring research quality.
Two principal methodological approaches have emerged for cell line authentication: short tandem repeat (STR) profiling and isoenzyme analysis. Each technique offers distinct advantages, limitations, and optimal application scenarios. STR profiling provides digital, highly discriminatory data capable of uniquely identifying human cell lines to the individual donor level, making it the current gold standard for human cell authentication [14] [19]. In contrast, isoenzyme analysis delivers valuable species-level identification and is particularly effective for detecting interspecies contaminations, though it lacks the discriminatory power to distinguish between cell lines from the same species [5] [16]. This guide provides a comprehensive, data-driven comparison of these authentication techniques across three critical research scenarios: authenticating new cell lines, verifying biobanked samples, and confirming post-xenograft cultures.
Technical Principles and Methodologies
STR Profiling: DNA-Based Digital Fingerprinting
STR profiling leverages polymorphism in short tandem repeat loci scattered throughout the genome. These loci consist of repetitive DNA sequences 3-7 base pairs in length that exhibit substantial length variation between individuals due to differing numbers of repeat units [45]. Authentication using STR analysis involves multiplex PCR amplification of typically 8-24 tetranucleotide repeat loci using fluorescently labeled primers, followed by capillary electrophoresis to precisely determine the length of the resulting amplicons [10] [14]. The unique combination of allele sizes across multiple loci generates a discriminatory DNA profile often referred to as a "genetic fingerprint."
The analytical process involves several critical steps. First, genomic DNA is extracted from the cell sample using commercial kits. The DNA is then amplified via multiplex PCR using primers targeting specific STR loci, with one primer per pair labeled with a fluorescent dye. The resulting PCR products are separated by size through capillary electrophoresis, and software algorithms determine the exact number of repeats at each locus by comparing amplicon sizes to an internal size standard and allelic ladders. The final STR profile is compared to reference databases using matching algorithms such as Tanabe or Masters to calculate similarity percentages and determine authenticity [44] [19].
Isoenzyme Analysis: Protein-Based Speciation Method
Isoenzyme analysis authenticates cell lines by exploiting species-specific electrophoretic mobility patterns of intracellular enzymes. The technique separates enzyme variants (isoenzymes) from cell lysates based on their differential migration through an agarose gel matrix under an electric field, influenced by their molecular size, charge, and structure [5]. Following separation, specific substrates are applied to stain the gels, producing visible bands whose migration distances are characteristic of the species of origin.
The standard methodology involves creating cell lysates from cultured cells, loading them onto agarose gels alongside control samples of known species origin, and performing electrophoresis. After separation, gels are incubated with enzyme-specific substrates that produce insoluble colored formazan precipitates at the location of enzyme activity. The resulting banding patterns are compared to standardized migration distances for various species, enabling identification through a process of elimination. The AuthentiKit system evaluates multiple enzymes including nucleoside phosphorylase (NP), malate dehydrogenase (MD), glucose-6-phosphate dehydrogenase (G6PD), lactate dehydrogenase (LD), and aspartate amino transferase (AST) to achieve accurate speciation [5].
Performance Comparison Across Authentication Scenarios
Quantitative Performance Metrics
Table 1: Comparative Performance of STR Profiling vs. Isoenzyme Analysis
| Performance Characteristic | STR Profiling | Isoenzyme Analysis |
|---|---|---|
| Discriminatory Power | Distinguishes to individual level (1 in 1.42 × 10¹⁸ for 15 loci) [45] | Species-level identification only [5] |
| Sensitivity to Cross-Contamination | Detects 5-10% contamination in mixed samples [44] | Requires ~10-25% contamination for detection [5] |
| Detection Capability | Identifies intraspecies contamination, genetic drift, and sample mixing [44] [45] | Primarily detects interspecies contamination [5] [16] |
| Analysis Time | <90 minutes for newer kits (e.g., GlobalFiler) [14] | Several hours [5] |
| Key Applications | Human cell line authentication, biobank sample tracking, PDX model validation [44] [19] | Initial species verification, GMP banking, interspecies contamination screening [5] [16] |
| Quantitative Output | Digital data with objective allele calls and similarity percentages [44] [14] | Banding patterns requiring subjective interpretation [5] |
Scenario-Specific Application Guidelines
Authenticating New Cell Lines
For newly established or acquired cell lines, STR profiling provides unmatched discriminatory capability for confirming identity and detecting intraspecies contamination. The technique generates a reference DNA fingerprint that can be compared to existing databases like Cellosaurus using the CLASTR tool, enabling rapid identification of mislabeled cultures [44] [19]. STR analysis correctly identifies matching profiles in 98-99% of cases using an 80% match threshold, with most failures occurring in models with known microsatellite instability [44]. For human cell line authentication, the ANSI/ATCC ASN-0002-2022 standard recommends profiling 13 core STR loci plus amelogenin for sex determination as a minimum requirement [14].
Isoenzyme analysis serves as an effective initial screening tool for verifying species of origin when establishing new cell lines. The method successfully distinguishes between common laboratory species—human, mouse, and Chinese hamster—using optimized enzyme combinations such as peptidase B for detecting mouse-Chinese hamster mixtures [5]. While technically simpler and requiring less specialized equipment than STR profiling, isoenzyme analysis cannot differentiate between human cell lines from different individuals, limiting its utility for comprehensive authentication of human-derived cultures [5] [16].
Authenticating Biobanked Samples
For biobanked tissues and cell suspensions, STR profiling offers superior sensitivity and precision in tracking sample provenance over time. The method's capacity to generate digital fingerprints enables unambiguous comparison between original and banked samples, detecting minute genetic variations that may arise during storage or recovery [45]. Recent studies demonstrate that forensic-grade STR profiling with 23 markers successfully authenticates human cell lines preserved cryogenically for over 34 years, confirming long-term genetic stability when proper preservation protocols are followed [19].
Isoenzyme analysis provides a cost-effective quality check for confirming species identity in biobanked samples, particularly for non-human specimens. The technique effectively monitors for interspecies contamination during banking procedures—a critical consideration for facilities handling multiple species. However, its limited sensitivity requires contaminating cells to represent approximately 10-25% of the total population before detection is possible, potentially allowing low-level contaminations to remain undetected [5].
Authenticating Post-Xenograft Cultures
For patient-derived xenograft (PDX) models and other xenotransplantation systems, STR profiling is essential for confirming human origin after in vivo passage. The technique verifies that recovered cultures maintain genetic identity with the original patient material rather than being replaced by host (typically mouse) cells [44] [4]. STR analysis also monitors genetic drift during passaging—a significant concern for models with microsatellite instability where allelic drop-out or additional alleles may appear over time [44] [19]. The PDXNet consortium and NCI Patient-Derived Models Repository specifically recommend STR profiling before submission and at regular intervals during experimental use [44].
Isoenzyme analysis effectively screens for mouse stromal overgrowth in post-xenograft cultures, a common problem where host cells outcompete the human tumor cells during in vitro culture. Lactate dehydrogenase (LD) and aspartate amino transferase (AST) isoenzymes provide distinct banding patterns that differentiate human and mouse cells, enabling detection of contaminating mouse cells when they constitute at least 10% of the population [5]. This capability makes isoenzyme analysis a valuable preliminary check before undertaking more definitive STR authentication.
Table 2: Optimal Authentication Methods by Research Scenario
| Research Scenario | Recommended Primary Method | Complementary Technique | Key Performance Considerations |
|---|---|---|---|
| New Human Cell Line Authentication | STR Profiling (16-24 loci) | Isoenzyme Analysis | STR establishes unique fingerprint; isoenzyme confirms species |
| Biobank Quality Assurance | STR Profiling | Morphology & Growth Analysis | STR detects sample mix-ups; isoenzyme screens interspecies contamination |
| Post-Xenograft Culture Validation | STR Profiling | Isoenzyme Analysis | STR confirms human origin; isoenzyme detects mouse overgrowth |
| GMP Cell Banking | STR Profiling + Isoenzyme Analysis | Karyotyping & Mycoplasma Testing | Comprehensive identity and purity assessment |
Experimental Protocols and Data Interpretation
STR Profiling Laboratory Protocol
The STR profiling workflow begins with DNA extraction from cell pellets using commercial kits such as the QIAamp DNA Blood Mini Kit, with quantification via fluorometry to ensure input DNA concentrations of 0.5-2.0 ng/μL [19]. PCR amplification is performed using multiplex STR kits such as the PowerPlex 16 HS System (Promega) or GlobalFiler PCR Amplification Kit (Thermo Fisher), which simultaneously amplify 16-24 autosomal STR loci plus sex-determining markers in a single reaction [14] [45]. Thermal cycling conditions follow manufacturer specifications, typically comprising an initial denaturation at 96°C for 1-2 minutes, followed by 25-30 cycles of denaturation (94°C for 30 seconds), annealing (59°C for 2 minutes), and extension (72°C for 1 minute), with a final extension at 60°C for 20-30 minutes [19].
Capillary electrophoresis separates PCR products using instruments such as the Applied Biosystems 3500 Series, with POP-4 or POP-7 polymer and 36 cm or 50 cm arrays [14]. Data analysis employs fragment analysis software such as GeneMapper ID-X, which compares sample peaks to an internal size standard and allelic ladders to determine the number of repeats at each locus [14] [19]. The resulting STR profile is compared to reference samples using matching algorithms:
- Tanabe Algorithm: ( \text{Score} = \frac{2 \times \text{number of shared alleles}}{\text{total alleles in query profile} + \text{total alleles in reference profile}} \times 100\% )
- Masters Algorithm: ( \text{Score} = \frac{\text{number of shared alleles}}{\text{total alleles in query profile}} \times 100\% ) [44]
Match thresholds are typically set at ≥80% for the Masters algorithm and ≥90% for the Tanabe algorithm to declare relatedness, with lower scores indicating potential contamination or genetic divergence [44] [19].
Isoenzyme Analysis Laboratory Protocol
The isoenzyme analysis protocol commences with cell harvest at 80-90% confluence and preparation of cell lysates using detergent-based extraction buffers [5]. Agarose gels (1%) are prepared in tris-barbitone/sucrose buffer (pH 8.6), and samples are loaded alongside control extracts from known species (e.g., murine L929 as standard, human HeLa as control). Electrophoresis runs at 150V for 45-60 minutes at 4-8°C, maintaining precise temperature control for reproducible migration [5].
Following separation, gels are incubated with enzyme-specific substrate solutions: lactate dehydrogenase (LD) detection uses lactate, NAD, nitroblue tetrazolium (NBT), and phenazine methosulfate (PMS); glucose-6-phosphate dehydrogenase (G6PD) employs glucose-6-phosphate, NADP, NBT, and PMS; nucleoside phosphorylase (NP) relies inosine and PMS with tetrazolium dye [5]. Color development is carefully monitored and stopped by acetic acid fixation when bands achieve optimal intensity. Migration distances are measured from the origin to the center of each band, corrected using the standard sample migration to generate normalized values, and compared to species-specific reference databases for identification [5].
Research Reagent Solutions
Table 3: Essential Research Reagents for Cell Authentication
| Reagent/Kit | Primary Function | Application Notes |
|---|---|---|
| PowerPlex 16 HS System (Promega) | Multiplex amplification of 15 STR loci + amelogenin | High sensitivity for human cell authentication; ideal for low-quality DNA [45] |
| GlobalFiler PCR Amplification Kit (Thermo Fisher) | 6-dye multiplex of 21 autosomal STRs + 3 sex markers | Expanded discriminatory power; <90 minute amplification [14] |
| AuthentiKit System (Innovative Chemistry) | Isoenzyme analysis for species identification | Includes standard and control reagents; evaluates 7 enzymes for speciation [5] |
| QIAamp DNA Blood Mini Kit (Qiagen) | Genomic DNA extraction from cell pellets | High-purity DNA essential for reliable STR results [19] |
| SiFaSTR 23-plex System (Academy of Forensic Sciences) | Forensic-grade STR analysis with 21 autosomal loci | Maximum discriminatory power; research applications [19] |
STR profiling and isoenzyme analysis offer complementary strengths for comprehensive cell line authentication. STR profiling provides unparalleled discriminative power for human cell line identification, contamination detection, and genetic stability monitoring, making it indispensable for authenticating new cell lines, biobanked samples, and post-xenograft cultures [44] [14] [19]. Isoenzyme analysis delivers rapid, cost-effective speciation and effectively screens for interspecies contamination, serving as a valuable preliminary check in multi-species research environments [5] [16].
Strategic implementation of these authentication methods should follow a risk-based approach, with STR profiling as the primary tool for human cell line verification and isoenzyme analysis providing supplementary speciation data. The ANSI/ATCC standards recommend regular authentication testing every three months or after significant experimental manipulation, with both techniques serving as critical components of broader quality control systems that include morphology checks, growth curve analysis, and mycoplasma detection [16]. As research reproducibility faces increasing scrutiny, rigorous authentication protocols using these complementary techniques provide essential safeguards for scientific validity and resource preservation.
Navigating Challenges: Troubleshooting Common Pitfalls and Optimizing Your Authentication Strategy
Isoenzyme analysis has served as a foundational technique for cell line speciation, yet inherent limitations regarding its sensitivity and reagent availability have necessitated the adoption of more advanced methods like Short Tandem Repeat (STR) profiling. This guide provides a objective comparison of these authentication techniques, detailing how the ≈10% threshold for detecting interspecies contamination and the declining commercial availability of key reagents have positioned STR profiling as the modern standard for cell line authentication. Supported by experimental data and standardized protocols, this analysis is structured to assist researchers and drug development professionals in selecting appropriate methods to ensure the integrity of their biological models.
The integrity of biomedical research is fundamentally dependent on the correct identity of the cell lines used. Cell line misidentification and cross-contamination by faster-growing cells (such as the infamous HeLa line) have historically led to the publication of spurious data, wasting scientific resources and hampering progress [10] [4]. For instance, estimates suggest that about one-third of human tumor cell lines developed for cancer research were, at one point, misidentified, with cross-contamination rates in some cell repositories reaching 15-18% [10]. Authentication is therefore not merely a best practice but a mandatory requirement for many granting agencies and scientific journals [16] [13].
Two primary methodologies have been used for authentication: the traditional isoenzyme analysis and the contemporary STR profiling. While isoenzyme analysis provided a robust initial check for species origin, its technical limitations have become increasingly apparent. This guide objectively compares the performance of these two techniques, focusing on the critical limitations of isoenzyme analysis—namely, its sensitivity and practical feasibility—and demonstrates how STR profiling addresses these gaps within the broader thesis of advancing authentication science.
Technical Performance Comparison: Isoenzyme Analysis vs. STR Profiling
The efficacy of any cell authentication method is measured by its sensitivity, resolution, and practicality. A direct comparison reveals a clear trajectory of technological advancement.
Table 1: Direct Comparison of Authentication Techniques
| Feature | Isoenzyme Analysis | STR Profiling |
|---|---|---|
| Basis of Discrimination | Electrophoretic mobility of enzyme isoforms (e.g., LD, MD) [46] [5] | Length polymorphism of Short Tandem Repeat (STR) DNA loci [10] [14] |
| Primary Application | Verification of species of origin [16] [5] | Unique identification of a cell line to the individual donor level [4] [47] |
| Sensitivity (Detection Threshold) | 10% contaminating cells [46] [5] | 5-10% contaminating cells for manual review; can be optimized for lower detection in mixture studies [46] [14] |
| Key Limitation | Limited sensitivity; cannot differentiate between cell lines from the same species; reagents less available [46] [5] | Primarily for human cell lines; requires developing new loci sets for other species [4] |
| Standardization | Less standardized; relies on corrected migration distances [5] | Highly standardized (ANSI/ATCC ASN-0002) with specific core loci [14] [13] |
| Current Status | Historically used; now less common due to reagent availability [46] | Gold standard for human cell line authentication [10] [14] |
The 10% Contamination Threshold of Isoenzyme Analysis
The most cited limitation of isoenzyme analysis is its sensitivity, which requires the contaminating cell population to constitute a significant portion of the total culture. Early estimates placed this detection threshold at approximately 25%, but later studies demonstrated more reliable detection when the contaminating cells represented at least 10% of the total cell population [46] [5].
Experimental data illustrates this threshold clearly. In one study, extracts were prepared from proportional mixtures of Chinese hamster (CHO-K1) and human (MRC-5) cells. Distinct bands for lactate dehydrogenase (LD) from each species were only visible when each cell type comprised at least 11% of the total mixture [5]. Another experiment simulating a real-world cross-contamination event involved inoculating a small number (~100) of fast-growing CHO-K1 cells into a confluent flask of slower-growing MRC-5 cells. The presence of the contaminating Chinese hamster cells was detectable via the LD isoenzyme gel only after two passages, by which time the contaminant had expanded to a detectable level [5].
This sensitivity limit is a critical vulnerability. In a typical lab setting, a low-level contamination event can lead to the complete overgrowth of the original culture within a few passages, yet it remains undetectable by isoenzyme analysis in its earliest and most manageable stages.
The Commercial Reagent Availability Challenge
A decisive factor shifting the field away from isoenzyme analysis is the issue of practical availability. The technical overview from ScienceDirect states unequivocally: "the reagents required for performing isoenzyme analysis are no longer commercially available; therefore, this method is currently less commonly used" [46].
While articles from the mid-2000s describe the use of commercial kits like the "AuthentiKit" [5], the current reality for researchers is that these products are no longer readily accessible. This lack of supply makes it impractical for laboratories, particularly those operating under Good Manufacturing Practices (GMP), to validate and implement the technique. The decline in reagent availability has effectively cemented STR profiling and other DNA-based methods as the default choices for new authentication protocols.
Experimental Protocols and Data Interpretation
Detailed Protocol: Isoenzyme Analysis
The following workflow outlines the established, though now historically relevant, method for isoenzyme analysis.
Key Experimental Steps [5]:
- Cell Extraction: Harvest cells and prepare an extract containing the intracellular enzymes.
- Electrophoresis: Load the extract onto an agarose gel alongside a standard reagent (e.g., murine L929 cell extract) and a control reagent (e.g., human HeLa extract). Apply an electric current to separate the enzyme isoforms based on their charge and molecular structure.
- Enzyme-Specific Staining: Incubate the gel with specific substrates for enzymes such as Lactate Dehydrogenase (LD), Nucleoside Phosphorylase (NP), or Mannose-6-Phosphate Isomerase (MPI). The reagents for detecting these enzymes are typically provided in a kit.
- Data Correction and Interpretation: Measure the migration distance of the resulting bands. A correction factor is calculated based on the observed vs. expected migration of the standard reagent. The corrected migration distances of the test sample are then compared to a chart of known species to determine the species of origin.
Interpretation and Limitations in Practice: The presence of a contaminating cell line is indicated by an "unexpected (extra) band or bands in a gel for 1 or more isoenzymes" [46]. The choice of enzyme is critical for detecting specific contaminations. For example, Peptidase B (PepB) is optimal for differentiating Chinese hamster from mouse cells, while Aspartate Aminotransferase (AST) is particularly useful for detecting contaminations involving human and monkey cells [5]. The need for this a priori knowledge of which enzymes to check is a significant operational constraint.
Detailed Protocol: STR Profiling
STR profiling is the current, standardized method for authenticating human cell lines.
Key Experimental Steps [10] [14] [13]:
- DNA Isolation: Purify genomic DNA from the cell line.
- Multiplex PCR Amplification: Amplify a standardized set of STR loci (e.g., the 17-24 loci in kits like the GlobalFiler or Identifiler) in a single PCR reaction. One primer per locus is labeled with a fluorescent dye.
- Capillary Electrophoresis: The PCR products are separated by size via capillary electrophoresis. An internal size standard is run with each sample for precise fragment sizing.
- Data Analysis and Allele Calling: Software determines the length of each PCR fragment, which is converted into an allele call based on the number of tandem repeats. For example, a 120 bp fragment for a (GATA) repeat locus might be called "Allele 10" [10].
- Database Comparison: The final STR profile—a string of numbers representing the alleles at each locus—is compared against reference databases (e.g., ATCC's STR database, ExPASy) to confirm identity or detect misidentification.
Essential Research Reagent Solutions
The transition from biochemical to molecular techniques necessitates a different set of laboratory reagents and tools.
Table 2: Key Reagents and Tools for Cell Authentication
| Item | Function in Authentication |
|---|---|
| STR Multiplex Kit (e.g., GlobalFiler, Identifiler) | Contains pre-optimized primers to co-amplify core STR loci in a single PCR reaction, ensuring standardization and reproducibility [14]. |
| Fluorescent Capillary Electrophoresis System | Separates fluorescently-labeled STR amplicons by size with single-base-pair resolution, enabling precise allele calling [10] [14]. |
| Allelic Ladders & Sizing Standards | Provides a reference for accurate allele designation by accounting for minor run-to-run variations in electrophoresis [10]. |
| Cell Line STR Databases (ATCC, DSMZ, ExPASy) | Publicly searchable databases of reference STR profiles; essential for comparing test results to known cell lines and identifying misidentification [47] [13]. |
| FTA Sample Collection Cards | Allows for easy, ambient-temperature shipment of cell samples to authentication service providers; cards lyse cells and protect DNA [13]. |
The limitations of isoenzyme analysis, specifically its ≈10% contamination threshold and the lack of commercially available reagents, have rightfully led to its decline in routine use. While it served as a valuable tool for interspecies contamination checks, its inability to provide unique intraspecies identification and its lower sensitivity leave modern research vulnerable to the persistent problem of cell line misidentification.
In contrast, STR profiling has emerged as the gold standard for human cell line authentication. Its higher discrimination power, standardization through the ANSI/ATCC ASN-0002 guideline, and support from a robust ecosystem of commercial reagents and public databases make it an indispensable component of credible biomedical research [14] [13].
For researchers today, the path forward is clear:
- Authenticate human cell lines at initiation, after long-term culture, and before key experiments or publication using STR profiling.
- Rely on isoenzyme analysis only for historical context or in specific, non-human applications where it has been previously validated and reagents are still accessible.
- Adhere to Good Cell Culture Practices to prevent cross-contamination, recognizing that procedural care is the first line of defense, while authentication is the necessary verification [16] [48].
The evolution from isoenzyme analysis to STR profiling represents a critical advancement in ensuring the validity and reproducibility of scientific research built upon cell culture models.
Short Tandem Repeat (STR) profiling stands as the gold standard for cell line authentication, a critical process in ensuring the integrity and reproducibility of biomedical research [10] [17]. This technique analyzes highly polymorphic regions of DNA consisting of repeating units of 1-6 base pairs, which are scattered throughout the human genome [49]. Despite its widespread adoption and robustness, STR profiling faces two significant challenges: the accurate interpretation of complex genetic profiles and the management of genetic drift that occurs as cell lines undergo repeated passaging. These challenges necessitate a thorough comparison with historical methods such as isoenzyme analysis to contextualize the advancements and limitations of modern authentication systems. The persistence of cell line misidentification issues in scientific literature underscores the ongoing importance of reliable authentication methods for validating research outcomes and supporting drug development processes [10] [17].
Technical Foundations of STR Profiling and Isoenzyme Analysis
Principles of STR Profiling
STR profiling operates through multiplex polymerase chain reaction (PCR) amplification of multiple STR loci simultaneously, followed by capillary electrophoresis to separate the amplified fragments by size [10]. The core principle relies on the high variability in the number of tandem repeat units at specific loci, which differs among individuals except for monozygotic twins [49]. Modern STR kits analyze 16-26 different STR loci, with each primer labeled with a fluorescent dye, allowing for precise fragment analysis [10]. The resulting data provides a digital DNA profile that serves as a unique fingerprint for each cell line, enabling researchers to verify identity and detect cross-contamination through comparison with reference databases [19].
Principles of Isoenzyme Analysis
Isoenzyme analysis, a traditional method for species verification, relies on electrophoretic separation of intracellular enzymes based on their differential mobility through agarose gels [5] [46]. This technique exploits structural differences in enzymes with similar substrate specificity across species, resulting in distinct banding patterns that identify the species of origin [46]. The method examines enzymes such as nucleoside phosphorylase, malate dehydrogenase, lactate dehydrogenase, and glucose-6-phosphate dehydrogenase, comparing their migration distances against standardized markers [5]. While technically simpler than STR profiling, isoenzyme analysis primarily serves for interspecies contamination detection rather than individual line identification [46].
Table 1: Fundamental Characteristics of Authentication Methods
| Characteristic | STR Profiling | Isoenzyme Analysis |
|---|---|---|
| Basis of Discrimination | DNA sequence length polymorphisms | Enzyme electrophoretic mobility |
| Primary Application | Individual cell line identification | Species verification |
| Polymorphism Target | Non-coding repetitive DNA sequences | Functional enzyme structures |
| Discriminatory Power | Very high (can distinguish individuals) | Moderate (can distinguish species) |
| Sensitivity to Contamination | 5-30% contaminating cells [46] | Approximately 10% contaminating cells [5] [46] |
Comparative Analysis: STR Profiling vs. Isoenzyme Analysis
Detection Capabilities and Limitations
STR profiling demonstrates superior sensitivity for detecting both intraspecies and interspecies contamination compared to isoenzyme analysis. While STR methods can identify contaminating cells representing as little as 5% of the total population, isoenzyme analysis typically requires the contaminating population to reach approximately 10% for reliable detection [5] [46]. This enhanced sensitivity of STR profiling is particularly valuable for identifying early-stage cross-contamination before it comprehensively compromises cell cultures. Furthermore, STR profiling provides digital data that can be easily stored in searchable database systems, facilitating ongoing authentication throughout the research lifecycle [46].
Isoenzyme analysis faces significant limitations in detecting intraspecies contamination, as enzymes from the same species typically exhibit similar electrophoretic mobilities regardless of the specific cell line [46]. The technique also depends on the specific enzymes evaluated and the animal species comprising potential cell mixtures, with varying effectiveness for different species combinations [5]. Moreover, commercial reagents for isoenzyme analysis have become less available, diminishing its practical implementation in contemporary research settings [46].
Technological Workflows and Procedural Complexities
The workflow diagram illustrates the fundamental procedural differences between STR profiling and isoenzyme analysis. STR profiling requires specialized equipment for capillary electrophoresis and fragment analysis, along with sophisticated software for allele calling and database comparison [10]. In contrast, isoenzyme analysis relies on standard laboratory electrophoresis equipment but demands careful optimization of staining conditions and migration measurements [5]. The technical simplicity of isoenzyme analysis is counterbalanced by its subjective interpretation requirements, where excessive color development during staining can compromise band resolution and result interpretation [5].
Table 2: Technical Requirements and Output Comparisons
| Parameter | STR Profiling | Isoenzyme Analysis |
|---|---|---|
| Equipment Needs | Thermal cycler, capillary electrophoresis instrument, analysis software | Electrophoresis chamber, power supply, staining apparatus |
| Data Output | Digital allele calls, electrophoretograms | Analog banding patterns, migration distances |
| Interpretation Complexity | High (requires specialized software) | Moderate (visual pattern recognition) |
| Analysis Time | 1-2 days | Several hours [5] |
| Commercial Availability | Widely available from multiple vendors | Limited availability of reagents [46] |
Critical Challenges in STR Profiling
Interpreting Complex STR Profiles
STR data interpretation becomes particularly challenging with complex genetic profiles resulting from several biological and technical factors. Sequence-level variations within STR regions represent a significant interpretation challenge, as traditional length-based genotyping may not detect single nucleotide polymorphisms or sequence variations within repeat regions [50]. These limitations can lead to incorrect numbers of repeat units in reference databases, compromising authentication accuracy [50]. Next-generation sequencing (NGS) approaches offer potential solutions by enabling sequence-based STR genotyping that captures nucleotide-level variations, thereby providing greater discriminatory power for complex kinship analysis and cell line authentication [50] [51].
Mixed profiles resulting from cell line cross-contamination present another interpretation challenge, particularly when contamination levels fall near detection thresholds. Stutter peaks, which are PCR artifacts caused by replication slippage during amplification, further complicate profile interpretation by creating minor peaks typically one repeat unit smaller than the true allele [50]. Advanced bioinformatic pipelines like STRaM (Short Tandem Repeats and Mutations) have been developed to improve accuracy by combining STR analysis, STR flanking analysis, and edited/mutant sequence analysis into an integrated error-sensing system [50].
Managing Genetic Drift in High-Passage Cell Lines
Genetic drift presents a substantial challenge for long-term cell line maintenance, with STR profiles demonstrating measurable instability as passage numbers increase. A 2025 study examining human cell lines preserved over 34 years documented several alteration statuses in STR profiles, including loss of heterozygosity, occurrence of additional alleles, and complete allele replacement [19]. These genetic changes accumulate progressively with extended culturing, leading to phenotypic changes that can compromise experimental reproducibility [16].
The Tanabe and Masters algorithms provide standardized approaches for quantifying profile similarities and identifying genetic drift. The Tanabe algorithm applies stricter criteria, requiring ≥90% similarity to confirm relatedness, while the Masters algorithm uses a more lenient ≥80% threshold [19]. This differential reflects the challenge of determining acceptable similarity thresholds for cell lines with documented genetic drift. Research indicates that laboratories must establish clear protocols for managing high-passage cell lines, including setting maximum passage limits and implementing regular monitoring to detect significant genetic changes that might affect research outcomes [16].
Table 3: STR Profile Alteration Status in Long-Term Cultured Cell Lines [19]
| Alteration Status | Genetic Description | Impact on Authentication |
|---|---|---|
| Stable (S) | No alterations occurred compared to reference | No impact |
| Loss of Heterozygosity (L) | One allele lost at a specific locus | Moderate impact (may affect matching scores) |
| Additional Allele (Aadd) | Appearance of extra allele without replacement | Significant impact (suggests contamination or instability) |
| New Allele (Anew) | Replacement of original allele with different allele | Major impact (compromises authentication match) |
Research Reagent Solutions for STR Authentication
Effective STR profiling requires specific research reagents and materials to ensure accurate and reproducible results. The following essential components represent the core toolkit for implementing STR-based authentication protocols:
STR Multiplex Kits: Commercial kits such as the SiFaSTR 23-plex system or Promega PowerPlex 18D contain optimized primer sets for co-amplifying multiple STR loci in a single reaction, including amelogenin for sex determination [19] [16]. These kits provide standardized amplification conditions and allelic ladders for accurate allele calling.
DNA Extraction Systems: Specialized kits like the QIAamp DNA Blood Mini Kit enable high-quality DNA extraction from cell line samples, with quantitative assessment using fluorometers such as Qubit to ensure adequate DNA quality and concentration [19].
Capillary Electrophoresis Instruments: Genetic analyzers from various manufacturers separate fluorescently labeled PCR products by size, with internal size standards enabling precise fragment analysis [10]. These systems generate the raw data for subsequent genotype determination.
Analysis Software: Platforms like GeneMapper ID-X software facilitate automated allele calling by comparing sample data with allelic ladders, though manual review remains essential for complex profiles or microvariants [10] [16].
Reference Databases: Searchable databases such as Cellosaurus and CLASTR (Cell Line Authentication using STR) provide reference profiles for comparison, enabling researchers to verify cell line identity against known standards [19] [17].
Future Directions and Methodological Evolution
The evolution of authentication technologies continues to address current limitations in STR profiling. Next-generation sequencing platforms enable sequence-based STR genotyping that captures nucleotide-level variations within repeat regions, providing enhanced discriminatory power compared to traditional length-based analysis [50] [51]. Advanced bioinformatic pipelines like STRaM integrate analysis of STRs with single nucleotide polymorphisms and mutation profiles to create more comprehensive cellular identities, particularly valuable for tracking engineered cell lines in advanced therapies [50].
The development of expanded STR marker sets represents another advancement, with newer panels covering 22 or more STR loci distributed across all human chromosomes to ensure detection of tumor cells with chromosomal losses [50]. These expanded panels provide greater discrimination power, mirroring trends in forensic science where testing more markers improves identification reliability [19]. Furthermore, the research community continues to strengthen authentication standards, with journals increasingly requiring STR authentication data as a publication prerequisite and organizations like the International Cell Line Authentication Committee (ICLAC) maintaining databases of misidentified cell lines to guide authentication efforts [17].
STR profiling represents a substantial advancement over traditional isoenzyme analysis for cell line authentication, offering superior discriminatory power, sensitivity, and digital data output. However, challenges persist in interpreting complex genetic profiles and managing genetic drift across high passages, necessitating ongoing methodological refinements and standardized interpretation guidelines. The research community's commitment to authentication standardization, coupled with technological advances in sequencing and bioinformatics, continues to enhance the reliability of cell-based research. By understanding both the capabilities and limitations of STR profiling relative to historical methods, researchers can implement more effective authentication strategies that support research reproducibility and drug development efficacy.
In the rigorous fields of biomedical research and drug development, the integrity of biological models is foundational. Cell line misidentification and cross-contamination are persistent, well-documented problems that can invalidate years of research, waste invaluable resources, and compromise the development of therapeutic agents [47]. A robust, scheduled authentication protocol is not merely a best practice but a critical component of quality assurance. This guide objectively compares the two predominant authentication methodologies—Short Tandem Repeat (STR) profiling and isoenzyme analysis—framed within the broader thesis that STR profiling offers superior resolution for modern research and development applications, while isoenzyme analysis serves a more limited, historical role.
Methodological Comparison: STR Profiling vs. Isoenzyme Analysis
The choice of authentication technique directly impacts the sensitivity, reliability, and informational value of the results. The following table provides a direct, data-driven comparison of the two core methods.
Table 1: Technical and Performance Comparison of STR Profiling and Isoenzyme Analysis
| Feature | STR Profiling | Isoenzyme Analysis |
|---|---|---|
| Analytical Basis | DNA-level analysis of hypervariable tandem repeat sequences [52] | Protein-level analysis of electrophoretic mobility of enzyme isoforms [5] |
| Discriminatory Power | High intraspecies discrimination; creates a unique DNA fingerprint [47] | Primarily confirms species of origin; limited intraspecies discrimination [47] |
| Key Performance Metrics | High sensitivity; can detect cross-contamination at low levels (theoretical limit <10%) [50] | Lower sensitivity; requires contaminant to represent ~10% of total population for detection [5] |
| Throughput & Ease of Use | Amenable to automation and high-throughput analysis; standardized kits available [53] | Manual process requiring gel electrophoresis and specific activity staining [5] |
| Data Output & Standardization | Digital profile of alleles at multiple loci; supported by international standards (e.g., ANSI/ATCC ASN-0002) [47] | Visual banding pattern on a gel; comparison to a chart of standardized migration distances [5] |
| Primary Application | Gold standard for human cell line identification and authentication [50] [47] | Historically used for speciation and rapid assessment of purity [5] |
Experimental Protocols in Practice
A. STR Profiling Protocol
The standard protocol for STR profiling, as mandated by the ANSI/ATCC ASN-0002 standard, involves a series of defined steps [47]:
- DNA Extraction: Purification of genomic DNA from the cell sample.
- Multiplex PCR Amplification: Simultaneous amplification of at least eight core STR loci (e.g., TPOX, TH01, vWA, D16S539, CSF1PO, D7S820, D5S818, D13S317) and the amelogenin gene for sex determination using commercial kits.
- Capillary Electrophoresis: Separation of the amplified PCR fragments by size.
- Fragment Analysis and Allele Calling: Conversion of fragment sizes to specific allele calls based on a standardized nomenclature.
- Profile Comparison: The resulting STR profile is compared against a reference database or the donor's baseline profile to confirm identity.
B. Isoenzyme Analysis Protocol
The protocol for isoenzyme analysis, while less common today, is technically straightforward [5]:
- Cell Extract Preparation: Preparation of a lysate from the cultured cells.
- Non-Denaturing Gel Electrophoresis: Separation of intracellular enzymes (e.g., Nucleoside Phosphorylase, Lactate Dehydrogenase, Mannose-6-Phosphate Isomerase) on a support medium like agarose or polyacrylamide.
- Specific Enzyme Staining: Incubation of the gel with specific substrates and reagents to develop a colorimetric reaction for the target enzyme.
- Band Pattern Analysis: The migration distances of the stained bands are measured and compared to a standardized chart of species-specific patterns to determine the species of origin.
Quantitative Data and Performance Comparison
The theoretical advantages of STR profiling are borne out in empirical, head-to-head performance data. The following table summarizes key quantitative findings.
Table 2: Experimental Performance Data for Contamination Detection
| Method | Contamination Type | Detection Sensitivity | Supporting Experimental Data |
|---|---|---|---|
| STR Profiling | Cross-contamination of human cell lines | High statistical power for individual discrimination | A 2025 study (STRaM) uses an error-sensing bioinformatic pipeline for robust STR detection, improving accuracy over older methods [50]. |
| Isoenzyme Analysis | Interspecies (e.g., CHO-K1 in MRC-5) | ~10% of total cell population [5] | Deliberate inoculation experiments showed detection of CHO-K1 in human MRC-5 cultures via LD enzyme within two passages [5]. |
| Isoenzyme Analysis | Interspecies (e.g., Mouse L929 in CHO-K1) | Requires specific enzyme for reliable detection | Electrophoresis of proportional mixtures showed PepB was required for definitive differentiation, while LD was not generally useful [5]. |
Visualizing Authentication Workflows and Scheduling
The following diagrams illustrate the logical workflow for selecting an authentication method and the critical timepoints for its application.
Diagram 1: Authentication Method Decision Pathway. This flowchart helps determine the appropriate authentication technique based on the research objective.
Diagram 2: Essential Timepoints for a Robust Cell Authentication Schedule. A proactive schedule at these key stages is crucial for maintaining cell line integrity throughout a project's lifecycle [47] [54].
The Researcher's Toolkit: Essential Reagents and Solutions
Successful authentication relies on specific, high-quality reagents and tools. The following table details the core components of the authentication toolkit.
Table 3: Key Research Reagent Solutions for Cell Line Authentication
| Reagent / Solution | Function in Authentication | Application Context |
|---|---|---|
| DNA Extraction Kits | Purifies high-quality genomic DNA from cell samples for downstream STR analysis. | Essential first step for STR profiling [47]. |
| Multiplex STR PCR Kits | Contains primers for co-amplification of multiple standardized STR loci. | Core of the STR profiling reaction; kits are available from vendors like Applied Biosystems and Promega [8]. |
| Isoenzyme Analysis Kit | Provides reagents for electrophoresis and staining of specific intracellular enzymes. | Required for performing the isoenzyme analysis method [5]. |
| Capillary Electrophoresis System | Separates amplified STR fragments by size with fluorescent detection. | Critical instrumentation for resolving and detecting STR alleles [52] [8]. |
| Cell Line Reference Database | A curated collection of STR profiles from known, verified cell lines. | Used as a reference for comparing and authenticating test samples [50]. |
The comparative data and experimental protocols presented in this guide unequivocally position STR profiling as the superior method for building a robust cell authentication schedule. Its high discriminatory power, sensitivity, and digital, standardized output make it the current gold standard for confirming cell line identity from acquisition through every 10 passages. While isoenzyme analysis can provide basic speciation, its limitations render it unsuitable for the demands of modern, reproducible research where intraspecies identification is paramount. The field continues to evolve, with next-generation sequencing (NGS) and new bioinformatic pipelines like STRaM emerging to provide even deeper analysis of STR sequences and flanking regions, further enhancing the power and precision of DNA-based authentication [50]. Adhering to a strict schedule with the most accurate available technology is a fundamental investment in scientific integrity.
Integrating Good Cell Culture Practice (GCCP) to Prevent Cross-Contamination at the Source
In biomedical research, the integrity of cell lines is a fundamental pillar for ensuring reproducible and meaningful results. Cross-contamination and misidentification of cell lines, however, remain pervasive problems, with estimates suggesting that approximately 16.1% of published papers may have used problematic cell lines [55]. The implementation of Good Cell Culture Practice (GCCP) provides a critical framework to combat these issues at the source, establishing standards for quality management, documentation, and safety [55] [56]. A core component of this defense strategy is the routine authentication of cell lines, primarily through two analytical techniques: Short Tandem Repeat (STR) profiling and isoenzyme analysis. This guide provides a detailed, objective comparison of these methods to help researchers build a robust, contamination-free foundation for their work.
Cell culture contaminants can be biological or chemical, each presenting unique challenges.
- Biological Contaminants: This category includes bacteria, fungi/yeasts, mycoplasma, and viruses. While bacteria and fungi often cause visible turbidity in the medium, mycoplasma is an "invisible danger" due to its small size (~0.3 µm) and lack of a cell wall, allowing it to persistently alter cell metabolism and genetics without obvious signs [57] [58]. Viral contamination is particularly serious as it is difficult to detect and can pose a health hazard to laboratory personnel [59] [58].
- Cross-Contamination: The silent overgrowth of one cell line by another, often a faster-growing line like HeLa, is a devastating form of contamination. The International Cell Line Authentication Committee (ICLAC) lists hundreds of misidentified cell lines, which can lead to the publication of false and irreproducible data, wasting significant time and resources [55] [4] [10].
The diagram below outlines the primary sources of cell culture contamination and the defensive barriers established by GCCP.
Core GCCP Principles for Source Prevention
Integrating GCCP into daily laboratory routines is the most effective strategy to prevent contamination before it starts. Key practices include:
- Aseptic Technique: Always work within a properly maintained laminar flow hood with unobstructed airflow, disinfect all surfaces and items with 70% alcohol, and use sterile pipette tips and flasks [57] [58].
- Workflow Management: Handle only one cell line at a time to prevent cross-contamination, clearly label all vessels with cell line name, date, and passage number, and never share or re-enter media bottles dedicated to a specific cell line [4] [57].
- Judicious Antibiotic Use: Avoid the routine use of antibiotics and antimycotics, as their continuous use can encourage resistant strains, hide low-level contaminants like mycoplasma, and potentially interfere with cellular processes under investigation [59] [57].
- Quarantine and Verification: All new cell lines should be quarantined and tested for contaminants, especially mycoplasma, before being integrated into the main laboratory culture system [57].
STR Profiling: The Gold Standard for Human Cell Line Authentication
STR profiling is a DNA-based genotyping technique that analyzes the length variations of short tandem repeat sequences scattered throughout the genome. This method has become the gold standard for authenticating human cell lines to the individual level [10] [13].
Experimental Protocol for STR Profiling
The standard workflow for STR profiling is highly standardized and often outsourced to specialized facilities, but understanding the process is key.
- DNA Extraction: Genomic DNA is isolated from the cell sample. Commercial services often use specialized sample collection kits containing chemicals that lyse cells and protect DNA [13].
- Multiplex PCR Amplification: The extracted DNA is amplified using a multiplex polymerase chain reaction (PCR) with fluorescently-labeled primers targeting typically 16-26 specific STR loci. These loci are selected for their high variability in the human population [10].
- Capillary Electrophoresis (CE): The PCR products are separated by size using CE. An internal size standard is run alongside the samples to determine the exact length (and therefore the number of repeat units) of each STR allele with an accuracy of about 0.5 nucleotides [10].
- Data Analysis and Matching: Software converts the CE data into an electropherogram, and the specific allele calls for each locus form a unique DNA fingerprint for the cell line. This profile is then compared against reference databases, such as the ATCC STR database or ExPASy, to confirm identity or detect misidentification [10] [13].
Isoenzyme Analysis: A Robust Tool for Species Verification
Isoenzyme analysis authenticates cell lines by exploiting species-specific differences in the electrophoretic mobility of intracellular enzymes. It is a technically simpler, robust, and rapid method primarily used for confirming the species of origin and detecting interspecies cross-contamination [5] [60].
Experimental Protocol for Isoenzyme Analysis
This method provides a practical and accessible means for routine speciation checks within a laboratory.
- Cell Lysis and Extract Preparation: Cells are harvested and lysed using methods like osmotic shock or freeze-thaw cycles to release intracellular enzymes. The extract typically requires a sufficient number of cells (e.g., 42 million) for efficient analysis [5] [60].
- Polyacrylamide Gel Electrophoresis (PAGE): The cell extract is loaded onto a polyacrylamide gel alongside control extracts (e.g., mouse L929 and human HeLa) and run at a standard voltage (e.g., 200 V). The control extracts are vital for system suitability and correcting day-to-day migration variability [5].
- Enzyme-Specific Staining: After electrophoresis, the gel is incubated with specific substrates and color development reagents for enzymes like Lactate Dehydrogenase (LD), Nucleoside Phosphorylase (NP), or Aspartate Aminotransferase (AST). The reaction must be stopped at the appropriate time to prevent over-development and loss of band resolution [5].
- Band Pattern Analysis: The migration distances of the stained bands from the test sample are measured and corrected using the standard control. The corrected distances are compared to a standardized chart of migration patterns for various species to assign the species of origin [5].
Head-to-Head Comparison: STR Profiling vs. Isoenzyme Analysis
The choice between STR profiling and isoenzyme analysis depends on the specific authentication needs, available resources, and the biological context of the research. The table below provides a direct, data-driven comparison.
Table 1: Quantitative and Qualitative Comparison of Authentication Methods
| Parameter | STR Profiling | Isoenzyme Analysis |
|---|---|---|
| Primary Application | Individual-level identification of human cell lines [4] [10] | Speciation and detection of interspecies cross-contamination [5] |
| Principle | DNA-level analysis of length polymorphisms in short tandem repeats [10] | Protein-level analysis of electrophoretic mobility of enzymes [5] |
| Resolution | High (can distinguish between individuals of the same species) [4] | Low (identifies species of origin) [5] |
| Detection Sensitivity | Can detect minor contaminants if they represent a significant portion of the population. | Can detect cross-contamination when the contaminant represents ~10% of the total population [5] |
| Key Enzymes/Loci | Amelogenin plus 8+ core STR loci (e.g., D5S818, D13S317, D7S820) [10] [13] | LD, NP, MD, G6PD, AST, PepB, MPI [5] |
| Throughput | High (multiplexing of 16-26 loci in a single reaction) [10] | Medium (typically 4-7 enzymes analyzed per run) |
| Technical Ease | Requires specialized equipment (capillary sequencer) and expertise; often outsourced [10] | Technically simple; can be performed in most labs with basic equipment [5] |
| Time to Result | Several days if outsourced | A few hours [5] |
| Cost | Higher | Lower [5] |
| Regulatory Acceptance | Required by many journals and the NIH for grant funding [13] | Accepted for speciation in cell bank characterization [5] |
Implementing a GCCP-compliant authentication strategy requires specific reagents and tools. The following table details key solutions for the featured experiments.
Table 2: Research Reagent Solutions for Cell Authentication
| Item | Function in Authentication | Example Application |
|---|---|---|
| STR Profiling Kit | Provides optimized primer mixes, buffers, and size standards for multiplex PCR and capillary electrophoresis. | Amplifying 17-24 STR loci simultaneously to generate a unique DNA fingerprint for a human cell line [10] [13]. |
| Isoenzyme Analysis Kit | Contains reagents for cell lysis, electrophoresis, and enzyme-specific staining for a panel of intracellular enzymes. | Differentiating between human and mouse cell lines based on the migration pattern of Lactate Dehydrogenase (LD) [5]. |
| FTA Sample Collection Card | A chemically-treated card for easy sample collection and shipment; lyses cells, inactivates pathogens, and protects DNA. | Spotting cell suspensions for safe transport to an external STR authentication service [13]. |
| Mycoplasma Detection Kit | Enables PCR- or DNA staining-based detection of mycoplasma contamination, a common confounder in cell culture. | Routinely screening cell cultures every 1-2 months to ensure they are free of this cryptic contaminant [57] [58]. |
| Defined, Virus-Screened FBS | Provides a consistent, low-risk growth supplement for cells, reducing the chance of introducing viral or mycoplasma contaminants. | Feeding sensitive cell lines used in bioproduction to minimize the risk of viral contamination from biological reagents [57] [58]. |
Strategic Integration into a GCCP Framework
STR profiling and isoenzyme analysis are not mutually exclusive but can be complementary within a comprehensive GCCP plan. STR profiling is non-negotiable for the final authentication of human cell lines, especially to meet journal and funding requirements [13]. Isoenzyme analysis serves as an excellent, cost-effective tool for rapid, routine checks for interspecies contamination, ideal for quality control during frequent cell passaging.
Authentication is not a one-time event. Cells should be tested upon receipt into the laboratory, after preparing a cell bank, at least after 10 passages, and whenever in doubt about their identity or purity [13]. By integrating these analytical techniques with rigorous aseptic practices and good laboratory management, researchers can effectively prevent cross-contamination at its source, safeguarding the validity of their scientific discoveries.
In biomedical research, ensuring the identity of cell lines through authentication is a fundamental prerequisite for generating valid and reproducible data. The scientific community has largely transitioned from traditional methods like isoenzyme analysis to the more discriminatory and precise technique of Short Tandem Repeat (STR) profiling [61] [3]. However, generating an STR profile is only half the process; the critical step of profile comparison relies heavily on access to and proper use of public reference databases. This guide provides an objective comparison of two primary resources for this task: the ATCC STR Database and the CLASTR (Cellosaurus STR) tool.
The limitations of isoenzyme analysis, which includes insufficient discriminating power to unambiguously authenticate human cells to the individual level, paved the way for STR profiling to become the international reference method [61]. STR profiling analyzes highly variable genomic loci, producing a unique genetic fingerprint for each cell line. The subsequent comparison of this fingerprint against known reference profiles is what allows researchers to confirm a cell line's identity or detect cross-contamination. This comparison process, central to effective authentication, is the focus of this guide.
Database Comparison: CLASTR vs. ATCC STR Database
While both resources are essential for STR profile comparison, they serve complementary roles and have distinct characteristics, scopes, and functionalities. The choice between them often depends on the specific needs of the authentication project.
Table 1: Core Feature Comparison of CLASTR and ATCC STR Database
| Feature | CLASTR (Cellosaurus) | ATCC STR Database |
|---|---|---|
| Scope & Data Source | Compendium of publicly available STR profiles from multiple sources (literature, other databases) [62] | Curated database of STR profiles for cell lines held in the ATCC collection [63] |
| Number of STR Profiles | Largest database; 6,474 distinct cell lines with STR profiles (as of July 2019) [62] | Focused on ATCC's proprietary collection; specific number not detailed in search results |
| Primary Function | STR similarity search against a broad, public knowledge resource [62] | Query using ATCC catalog number or STR loci to compare against ATCC holdings [63] |
| Search Flexibility | Compare one or multiple STR profiles simultaneously [62] | Enter an ATCC number or alleles for at least 7 of 13 core STR loci [63] |
| Result Interpretation | Provides similarity scores; requires user to apply algorithms (Masters/Tanabe) for final classification | Directly provides a percent match and interpretation (Related/Unrelated) based on its algorithm [63] |
| Ideal Use Case | Initial broad check, especially for non-ATCC cell lines or when investigating potential misidentification | Quality control for ATCC-derived cell lines or when comparing against ATCC reference profiles |
Supported Methodologies and Search Algorithms
Both platforms are designed to work with standardized STR profiling data but employ different matching algorithms and acceptance criteria.
ATCC Matching Algorithm: The ATCC system uses a proprietary matching algorithm that calculates a percentage match based on shared alleles. The database offers two search modes [63]:
- Limited Search: Returns matches ≥ 80%, which indicates the cell lines are "related" or likely the same [63].
- Expanded Search: Returns matches ≥ 56%, with the range of 56% to 79% suggesting that additional analysis is required to confirm relatedness [63]. A 100% match is considered "identical" to a culture in the ATCC database [63].
CLASTR and Algorithm Application: CLASTR itself is a powerful similarity search tool that provides the raw data for comparison. However, the final authentication call often relies on the researcher applying established algorithms [19]:
- Masters Algorithm:
Percent match = (Number of shared alleles / Total number of alleles in query profile) × 100%[19]. A score of ≥ 80% indicates relatedness [19]. - Tanabe Algorithm:
Percent match = (2 × number of shared alleles) / (Total alleles in query + Total alleles in reference) × 100%[19]. This method is stricter, with a score of ≥ 90% indicating relatedness [19].
Table 2: Interpretation of STR Match Percentages Across Methods
| Match Percentage | ATCC Interpretation | Masters Algorithm | Tanabe Algorithm |
|---|---|---|---|
| 100% | Identical [63] | Related | Related |
| 90% - 99% | Related [63] | Related | Related (≥90%) [19] |
| 80% - 89% | Related [63] | Related (≥80%) [19] | Ambiguous/Mixed [19] |
| 56% - 79% | Additional analysis needed [63] | Ambiguous/Mixed (60%-80%) [19] | Unrelated (<80%) [19] |
| < 56% | Unrelated [63] | Unrelated (<60%) [19] | Unrelated |
Experimental Protocols for Database Interrogation
Workflow for Cell Line Authentication via Public Databases
The following diagram outlines the general workflow for authenticating a cell line, from generating the STR profile to interpreting the database comparison results.
Step-by-Step Protocol for Interrogating the ATCC STR Database
This protocol is adapted from the public guidelines on the ATCC website [63].
- Access: Log in to the ATCC website to access the STR database query form.
- Input Data: Choose one of two input methods:
- Option A (Catalog Number): Enter the ATCC catalog number of the cell line.
- Option B (STR Loci): Enter the allele data for at least 7 of the 13 core STR loci (e.g., CSF1PO = 11,12). The amelogenin locus for sex determination can also be included. Blank entries are not counted.
- Execute Search: Click either 'Limited Search' (returns matches ≥80%) or 'Expanded Search' (returns matches ≥56%).
- Interpret Results:
- Results are presented in descending order based on the highest percent match.
- A 100% match is considered "identical."
- A match ≥80% but less than 100% is considered "related."
- Matches between 56% and 79% require additional analysis to confirm relatedness.
Step-by-Step Protocol for Interrogating the CLASTR Database
This protocol is based on the description of CLASTR in the scientific literature [62].
- Access: Navigate to the CLASTR tool on the SIB ExPASy server (https://web.expasy.org/cellosaurus-str-search).
- Input STR Profile: Enter the allele data for the query cell line into the tool. CLASTR supports the comparison of one or more STR profiles simultaneously against the Cellosaurus database.
- Execute Search: Run the similarity search. The tool will compare the input profile against its comprehensive database of publicly available STR profiles.
- Analyze Similarity Scores: CLASTR will return a list of potential matches with similarity scores. The researcher must then apply the appropriate algorithm (e.g., Masters or Tanabe) to interpret these scores and determine if the match is sufficient to confirm identity (see Table 2 for thresholds).
Essential Research Reagents and Tools for STR Profiling
The following table details key materials and reagents required for performing STR profiling and subsequent database comparison, as cited in the literature [19] [64] [3].
Table 3: Research Reagent Solutions for STR Profiling and Authentication
| Reagent / Tool | Function / Description | Example Products / Kits |
|---|---|---|
| STR Multiplex Kits | Amplify multiple STR loci in a single PCR reaction. The selection dictates the number of loci analyzed. | PowerPlex 1.2 System [3], GlobalFiler PCR Amplification Kit (24 loci) [64], SiFaSTR 23-plex system [19] |
| DNA Extraction Kit | Isolate high-quality genomic DNA from cell line samples. | QIAamp DNA Blood Mini Kit [19] |
| Capillary Electrophoresis Instrument | Separate and detect amplified STR fragments by size. | Classic 116 Genetic Analyzer [19], ABI 3730xl DNA Analyzer [18] |
| Analysis Software | Analyze electropherogram data to call alleles at each STR locus. | GeneMapper Software [64], GeneManager Software [19] |
| Public STR Databases | Compare generated STR profiles against reference data to confirm cell line identity. | ATCC STR Database [63], CLASTR (Cellosaurus) [62] |
The objective comparison of CLASTR and the ATCC STR database reveals two robust yet distinct tools for the scientific community. The ATCC database provides a tightly curated, standardized system ideal for confirming the identity of cell lines obtained from ATCC, with built-in match interpretation. In contrast, CLASTR offers unparalleled scope and flexibility, functioning as a powerful first-line tool for authenticating a wide array of cell lines, especially those from non-ATCC sources, though it requires the researcher to actively interpret results using established algorithms.
The transition from isoenzyme analysis to STR profiling, supported by these public databases, represents a significant advancement in ensuring research integrity. As the field moves forward, the continued expansion and curation of these databases will be paramount. Future developments may include the integration of more forensic-grade STR markers [19] [18] and the standardization of analysis algorithms, further solidifying STR profiling as the indispensable foundation for reproducible cell-based research.
Head-to-Head Validation: A Data-Driven Comparison to Guide Your Method Selection
{@ tableofcontents}
Comparative Analysis Table: Specificity, Sensitivity, Cost, Speed, and Throughput
This guide provides an objective comparison of Short Tandem Repeat (STR) profiling and isoenzyme analysis for cell line authentication, a critical quality control step in biomedical research and drug development. Misidentified cell lines compromise research validity, leading to irreproducible results and wasted resources [4]. This analysis synthesizes data on specificity, sensitivity, cost, speed, and throughput to inform researchers and laboratories in selecting the appropriate authentication method. Supporting experimental data and detailed protocols are included to facilitate implementation and ensure the integrity of cell-based research.
Cell line misidentification through cross-contamination or mislabeling is a persistent, costly problem in scientific research [4] [65]. Authentication is thus essential, with STR profiling and isoenzyme analysis representing two established techniques. STR profiling characterizes a cell line by analyzing highly polymorphic DNA sequences, while isoenzyme analysis verifies the species of origin based on electrophoretic mobility patterns of enzymes [16]. This guide frames the comparison within the broader thesis that STR profiling has largely become the standard for human cell line identification due to its high discriminatory power, while isoenzyme analysis remains a valuable, rapid tool for initial species verification [4] [16].
Methodology for Performance Comparison
Data for this comparative analysis were gathered from a thorough review of scientific literature and technical documents from leading resource centers [4] [16] [65]. Quantitative metrics for speed and throughput are based on standardized laboratory protocols. Specificity and sensitivity assessments are derived from documented capabilities in distinguishing between species and individual human cell lines. Cost estimates are inferred from the complexity of the protocols, required instrumentation, and reagents.
Experimental Protocol for STR Profiling
STR profiling establishes a unique genetic fingerprint for human cell lines [16] [65].
- DNA Extraction: Isolate high-quality genomic DNA from the cell line using a commercial kit or standard phenol-chloroform protocol.
- Multiplex PCR Amplification: Amplify multiple target STR loci (e.g., the 13 CODIS core loci and Amelogenin for gender identification) in a single polymerase chain reaction (PCR) using fluorescently labeled primers [65].
- Capillary Electrophoresis: Separate the PCR amplicons by size using capillary electrophoresis.
- Data Analysis: Analyze the fragment sizes with specialized software (e.g., ThermoFisher Scientific GeneMapper ID-X) to determine the allele calls for each STR locus [16]. The resulting profile is compared against a reference database for authentication.
Experimental Protocol for Isoenzyme Analysis
Isoenzyme analysis verifies species identity by exploiting interspecies differences in enzyme mobility [16].
- Sample Preparation: Prepare a cell lysate from the cultured cells.
- Gel Electrophoresis: Load the lysate onto a support medium, typically a starch or polyacrylamide gel, and apply an electric current.
- Specific Staining: Stain the gel with specific enzyme substrates to visualize the banding patterns for a panel of enzymes (e.g., glucose-6-phosphate dehydrogenase, nucleoside phosphorylase).
- Pattern Interpretation: Compare the banding patterns to known standards for different species. A match confirms the species of origin.
Results: Comparative Performance Data
The following table summarizes the key performance characteristics of STR profiling and isoenzyme analysis for cell line authentication.
Table 1: Comparative Analysis of STR Profiling and Isoenzyme Analysis
| Feature | STR Profiling | Isoenzyme Analysis |
|---|---|---|
| Specificity | High (individual level) [4] [65] | Moderate (species level) [16] |
| Sensitivity | High (requires less DNA) [49] | Lower (requires more cells/protein) [4] |
| Relative Cost | Higher (specialized reagents, instrumentation) | Lower |
| Speed / Hands-on Time | Moderate to High (multi-step DNA-based protocol) | Rapid (direct staining of enzymes) [16] |
| Throughput | High (amenable to automation and multiplexing) [65] | Low (manual, limited multiplexing) |
| Primary Application | Uniquely identifying and authenticating human cell lines [4] [16] | Verifying the species of origin and detecting interspecies contamination [16] |
| Polymorphism Basis | DNA sequence length variation in tandem repeats [49] [65] | Electrophoretic mobility of homologous enzymes [16] |
| Key Disadvantage | Limited to intraspecies authentication for the targeted STR set. | Cannot distinguish between cell lines from the same species [4]. |
Discussion of Key Findings
The data demonstrate a clear trade-off between the two methods. STR profiling offers superior specificity and sensitivity, capable of identifying a cell line to the individual donor level with a random match probability of less than one in a trillion [65]. This makes it indispensable for confirming the unique identity of human cell lines. However, this power comes with higher cost and procedural complexity.
Conversely, isoenzyme analysis is a rapid, lower-cost technique ideal for an initial check for interspecies contamination, a common problem in cell culture [4] [16]. Its major limitation is its inability to differentiate between cell lines from the same species, rendering it ineffective for detecting intraspecies cross-contamination, such as HeLa cell overgrowth in other human cell cultures [4].
Consequently, the choice of method is application-dependent. For final authentication of a human cell line, STR profiling is the unequivocal method of choice. For routine, rapid screening for gross interspecies contamination, isoenzyme analysis remains a useful tool.
Visualized Experimental Workflows
The diagrams below illustrate the core procedural workflows for each authentication method.
STR Profiling Workflow
Isoenzyme Analysis Workflow
The Scientist's Toolkit: Essential Research Reagents
The following table details key reagents and materials required to perform the described authentication experiments.
Table 2: Essential Reagents and Materials for Cell Line Authentication
| Item | Function in Experiment |
|---|---|
| STR Profiling Kit | A commercially available multiplex PCR kit containing primers for core STR loci and Amelogenin [16]. |
| DNA Polymerase | Enzyme for amplifying the target STR loci via PCR. |
| Capillary Electrophoresis System | Instrumentation for high-resolution separation of DNA fragments by size [16]. |
| Genetic Analyzer Software | Specialized software for analyzing electrophoregram data and making allele calls [16]. |
| Cell Lysis Buffer | A detergent-based solution for breaking open cells to release enzymes (isoenzyme analysis) or DNA (STR profiling). |
| Agarose or Starch Gels | The support medium for separating proteins or DNA fragments via electrophoresis. |
| Isoenzyme Substrate Stains | Specific chemical solutions that react with target enzymes to produce a visible banding pattern on a gel [16]. |
This comparative analysis confirms that STR profiling is the more powerful and definitive technique for the unique authentication of human cell lines, offering high specificity and sensitivity. Isoenzyme analysis serves as a rapid, cost-effective screen for species verification. For a comprehensive cell authentication strategy, these methods can be complementary. However, given the severe repercussions of cell line misidentification, STR profiling is recommended as the core technique for ensuring research validity and reproducibility [4]. The ongoing development of public STR databases and standardized protocols will further solidify its role as the gold standard in authentication research [4].
Cell line misidentification represents a silent yet pervasive danger in biomedical research, with estimates suggesting that 15–20% of cell lines in use may not be what they are documented to be [66]. This problem of cross-contamination and misidentification has persisted for decades, jeopardizing research validity, drug development pipelines, and scientific reproducibility [4] [65]. Within this context, authentication methodologies have evolved significantly, with isoenzyme analysis and short tandem repeat (STR) profiling emerging as cornerstone techniques operating at fundamentally different resolution levels [4] [16].
Isoenzyme analysis provides species-level identification by detecting interspecies contamination through electrophoretic separation of enzymes [5] [46]. In contrast, STR profiling enables individual-level discrimination by analyzing highly polymorphic DNA regions, creating unique genetic fingerprints for human cell lines [4] [65]. This comparison guide objectively examines the technical capabilities, experimental protocols, and appropriate applications of each method within a comprehensive cell authentication strategy.
Technical Principles and Resolving Power
Fundamental Mechanisms
Isoenzyme Analysis exploits species-specific differences in the structure and electrophoretic mobility of intracellular enzymes. The method separates isoforms of enzymes such as lactate dehydrogenase (LD), malate dehydrogenase (MD), and glucose-6-phosphate dehydrogenase (G6PD) through agarose or polyacrylamide gel electrophoresis [5] [46]. The resulting banding patterns are characteristic of particular species, simultaneously confirming species identity and revealing contamination by another cell line of different species [16].
STR Profiling targets short tandem repeats—highly polymorphic DNA sequences characterized by core repeat units of 2-6 nucleotides scattered throughout the genome [67]. These microsatellite regions demonstrate significant length polymorphism between individuals due to variation in the number of repeat units [65]. By analyzing multiple STR loci simultaneously, the method generates a unique DNA fingerprint that can definitively identify human cell lines to the individual donor level [4] [68].
Resolution Capabilities
Table 1: Resolution Capabilities and Detection Limits
| Parameter | Isoenzyme Analysis | STR Profiling |
|---|---|---|
| Primary Resolution Level | Species identification | Individual identification |
| Interspecies Contamination Detection | Yes | Limited to human-specific applications |
| Intraspecies Contamination Detection | No | Yes |
| Minimum Detection Sensitivity | 10% contaminating cells [5] [46] | Can detect minor components in mixed samples at varying ratios [67] |
| Discriminatory Power | Limited to species differentiation | Extremely high (random match probability <1 in a trillion with 13 CODIS loci) [65] |
Experimental Protocols and Methodologies
Isoenzyme Analysis Workflow
Sample Preparation
- Harvest cells and prepare cell-free extracts using methods such as osmotic shock followed by freeze-thaw cycles in liquid nitrogen [60].
- Maintain sufficient cell numbers (approximately 42×10⁶ cells) for optimal extraction efficiency [60].
Electrophoretic Separation
- Load extracts onto agarose or polyacrylamide gels alongside control samples of known species origin.
- Run electrophoresis at optimized voltages (e.g., 200 V for PAGE systems) [60].
- Include standard reagents (e.g., murine L929 cell extract) on each gel to correct for day-to-day migration variability [5].
Enzyme Detection and Interpretation
- Incubate gels with specific enzyme substrates for color development.
- Monitor development closely and stop reactions at appropriate times to prevent over-development, which compromises band resolution [5].
- Measure migration distances and compare with standardized species-specific patterns using correction factors [5].
Isoenzyme Analysis Workflow
STR Profiling Workflow
DNA Extraction and Quantification
- Extract genomic DNA from cell samples using standard methods [65].
- Dilute DNA in low TE buffer (with 0.1 mM EDTA) as higher EDTA concentrations inhibit PCR [68].
- Quantify DNA concentration using methods such as Nanodrop or Qubit, with optimal input of 10-20,000 cells (70-140 ng) per reaction [67] [68].
Multiplex PCR Amplification
- Amplify target STR loci using commercially available kits (e.g., AmpFLSTR Identifiler Plus, PowerPlex 18D) [16] [68].
- Simultaneously amplify the amelogenin gene for gender identification plus multiple polymorphic STR markers (8-17 loci typically used) [16] [65].
- Utilize high-fidelity DNA polymerases (e.g., Platinum SuperFi) with additives like tetramethylammonium oxalate (TMAO) to improve specificity and yield [67].
Fragment Analysis and Data Interpretation
- Separate amplified fragments using capillary electrophoresis or next-generation sequencing [67].
- Convert fragment sizes to allele calls based on reference standards.
- Compare resulting STR profile to reference databases for authentication [68].
STR Profiling Workflow
Performance Comparison and Experimental Data
Sensitivity and Detection Limits
Isoenzyme Analysis Sensitivity Experimental data demonstrates that isoenzyme analysis can detect interspecies cell mixtures when the contaminating cells represent approximately 10% of the total population [5] [46]. Some studies have reported detection limits as low as 10% for specific cell line combinations, though sensitivity varies depending on the specific enzymes evaluated and the animal species comprising the cell mixture [5]. The method generally cannot reliably detect contaminations at levels below 10% [46].
STR Profiling Sensitivity STR profiling demonstrates superior sensitivity for detecting intraspecies contamination. Studies evaluating next-generation sequencing-based STR (STR-NGS) have shown the ability to detect minor cell line components in mixed samples at varying ratios, with read counts correlating well with expected contamination percentages [67]. This quantitative capability enables early detection of cross-contamination events before they completely overrun a culture.
Technological Advancements
Next-Generation STR Profiling Emerging STR-NGS methodologies offer significant advantages over conventional capillary electrophoresis approaches [67]. These include:
- Determination of the actual nucleotide sequences of STR alleles, not just length polymorphisms
- Flexible multiplexing capabilities
- Enhanced sensitivity for detecting mixed samples
- Higher throughput and lower per-sample costs when processing many samples [67]
STR-NGS has demonstrated excellent concordance with traditional STR-CE methods while providing additional sequence context that improves discriminatory power [67].
Table 2: Comprehensive Method Comparison
| Characteristic | Isoenzyme Analysis | STR Profiling | STR-NGS |
|---|---|---|---|
| Genetic Basis | Protein polymorphisms | DNA length polymorphisms | DNA sequence polymorphisms |
| Primary Application | Species verification | Human cell line identification | Human & mouse cell line identification |
| Throughput | Moderate | High | Very High |
| Commercial Availability | Limited (reagents no longer widely available) [46] | Widely available | Emerging |
| Standardization | Moderate | Well-standardized (ANSI/ATCC ASN-0002) [68] [47] | In development |
| Cost Considerations | Historically inexpensive | Cost-effective [65] | Higher initial investment |
Research Reagent Solutions and Essential Materials
Core Reagents and Kits
Table 3: Essential Research Reagents and Their Functions
| Reagent/Kit | Primary Function | Application Notes |
|---|---|---|
| AuthentiKit System | Isoenzyme analysis electrophoresis | Previously commercial kit, now limited availability [5] [46] |
| AmpFLSTR Identifiler Plus | Multiplex STR amplification | Amplifies 15 tetranucleotide STR loci plus Amelogenin [68] |
| PowerPlex 18D System | Multiplex STR amplification | Amplifies 17 polymorphic markers plus Amelogenin [16] |
| High-Fidelity DNA Polymerases | PCR amplification of STR loci | Platinum SuperFi recommended for superior accuracy [67] |
| Tetramethylammonium Oxalate | PCR additive | Improves specificity and yield of STR amplification [67] |
STR Profile Databases
- ATCC STR Database: Publicly searchable database containing nearly 2,700 human cell line STR profiles [66]
- DSMZ (Germany), JCRB (Japan), and RIKEN (Japan): Maintain public databases of authenticated human cell lines [68]
- NCBI BioSample Database: Stores STR profiles of publicly catalogued human cell lines [68]
- International Cell Line Authentication Committee (ICLAC): Register of Misidentified Cell Lines [66]
Application in Research and Authentication Strategies
Appropriate Use Cases
Isoenzyme Analysis Applications
- Initial species verification of newly acquired cell lines
- Detection of interspecies contamination in multi-species laboratories
- Routine quality control in biotherapeutic production where species confirmation is sufficient [5]
- Situations requiring rapid, technically straightforward speciation
STR Profiling Applications
- Authentication of human cell lines at acquisition [16] [47]
- Regular monitoring of cell line identity during long-term culture
- Verification before initiating critical experiments or freezing cell banks [47]
- Mandatory authentication for publication in many scientific journals [4] [47]
- Identification of intraspecies cross-contamination
Integration in Comprehensive Authentication Strategy
A robust cell authentication strategy often incorporates both techniques in a complementary approach:
- Initial Authentication: STR profiling establishes baseline identity for human cell lines; isoenzyme analysis verifies species for non-human lines
- Routine Monitoring: Periodic STR profiling at key passages (e.g., every 3 months or after 10 passages) [68]
- Supplemental Testing: Isoenzyme analysis for rapid interspecies contamination screening
- Additional Methodologies: Karyotyping for chromosomal stability, mycoplasma testing for freedom from microbial contamination [16]
The resolving power of isoenzyme analysis and STR profiling operates at fundamentally different levels, each with distinct advantages for specific authentication scenarios. Isoenzyme analysis provides efficient species-level resolution for detecting interspecies contamination but cannot discriminate between cell lines from the same species. STR profiling delivers individual-level identification through highly polymorphic DNA markers, creating unique genetic fingerprints that definitively authenticate human cell lines.
While isoenzyme analysis historically offered a technically accessible approach for species verification, its limitations and declining commercial availability have reduced its utility in modern research contexts [46]. STR profiling has emerged as the internationally recognized standard for human cell line authentication, supported by standardized protocols, public databases, and requirements from major journals and funding agencies [68] [47].
For researchers requiring the highest level of authentication certainty, STR profiling—particularly emerging NGS-based approaches—provides unparalleled resolving power for maintaining cell line integrity and ensuring research reproducibility. The complementary use of both techniques within a comprehensive quality control program offers the most robust strategy for combating the persistent problem of cell line misidentification in biomedical research.
This case study examines a groundbreaking 2025 investigation that successfully authenticated 91 human cell lines preserved under cryogenic conditions for 34 years using forensic short tandem repeat (STR) profiling [19]. The study represents one of the most extensive single-laboratory investigations into long-term cell line preservation, demonstrating that forensic-grade STR markers provide a robust methodology for verifying sample authenticity after decades of storage [19]. All uniquely labeled human cell lines were successfully revived and yielded complete STR profiles, confirming the efficacy of long-term cryopreservation and establishing forensic STR analysis as superior to traditional methods like isoenzyme analysis for authentication research [19]. This research provides valuable insights into genetic stability over time and supports the application of forensic STR kits beyond traditional forensic samples to biological resource management.
The authentication of biological samples represents a critical foundation for valid biomedical research, particularly as cell lines serve as essential experimental models in drug development and basic biological studies [19] [4]. Unfortunately, the frequent exchange of cell lines between laboratories creates significant risk of mislabeling, misidentification, and cross-contamination, potentially leading to incorrect and irreproducible research outcomes [19]. Historical data suggests that approximately 15-20% of the time, cells used in experiments have been misidentified or cross-contaminated with another cell line [3], with some studies of specific collections revealing misidentification rates exceeding 20% [1].
The consequences of working with misidentified cell lines are severe and far-reaching. Invalidated results, wasted resources, years of irrelevant research, and potentially unusable therapeutic drugs represent just some of the devastating effects [65]. One notable example involved researchers who spent three years working on two supposedly related breast cancer cell lines (MCF-7 and MCF-7/AdrR) only to discover the cell lines were actually unrelated [3]. Such cases highlight the critical need for robust authentication methods that can provide reliable results even after decades of sample storage.
Historical Authentication Methods and Limitations
For several decades, isoenzyme analysis was a primary method for cell line identification. This technique relies on detecting electrophoretic mobility differences of enzymes between species [4]. While useful for basic species identification, isoenzyme analysis possesses significant limitations:
- Limited Discriminatory Power: Poor discrimination at the intraspecies level makes it ineffective for distinguishing between human cell lines [47] [65]
- Technical Challenges: Requires fastidious technology, large amounts of time, and is difficult to reproduce between laboratories [65]
- Sensitivity Issues: Lacks the sensitivity to detect cross-contamination in early stages [4]
Other traditional methods include karyotyping (cytogenetic analysis) and HLA typing, but these share similar limitations in reproducibility, discrimination capability, and technical demands [65]. The emergence of DNA-based profiling technologies, particularly STR analysis, has addressed many of these limitations, offering greater precision in identifying genetic variation between individuals [19].
Methodology: Forensic STR Profiling of Long-Term Stored Samples
Sample Selection and Preparation
The 2025 study selected 91 different human cell line samples that had been documented and stored in liquid nitrogen tanks according to laboratory regulations [19]. To ensure comprehensive backup, samples with different names were treated as distinct cell line strains for subsequent STR genotype analysis, regardless of whether they potentially represented the same underlying strain [19]. The cell lines were revived from cryopreservation and cultured according to either published experimental conditions or vendor instructions for lines not referenced in publications [19].
Genomic DNA was extracted from 5 × 10⁶ cells using the QIAamp DNA Blood Mini Kit (Qiagen), following manufacturer instructions [19]. DNA quantification was performed using a Qubit fluorometer (Life Technologies), and all DNA samples were stored at -80°C until use to preserve integrity [19]. This meticulous approach to sample preparation established a foundation for reliable downstream analysis.
STR Genotyping and Analysis
The researchers employed the SiFaSTR 23-plex system (Academy of Forensic Sciences, Shanghai, China), which includes 21 autosomal STRs (D3S1358, D5S818, D2S1338, TPOX, CSF1PO, Penta D, TH01, vWA, D7S820, D21S11, Penta E, D10S1248, D8S1179, D1S1656, D18S51, D12S391, D6S1043, D19S433, D16S539, D13S317, and FGA) and two sex-related polymorphisms (Amelogenin and Y indel) [19].
PCR reactions were conducted according to the manufacturer's protocol, and DNA genotyping was performed on a Classic 116 Genetic Analyzer (SUPERYEARS) using GeneManager Software [19]. The analysis focused specifically on the 21 autosomal STRs for alteration status evaluation, comparing query genotypes with reference genotypes to determine five possible status categories: stable (S), loss of heterozygosity (L), occurrence of an additional allele (Aadd), occurrence of a new allele (Anew), or partial loss of heterozygosity (pL) [19].
Authentication Algorithms
The study employed two distinct algorithms for cell line authentication:
Tanabe Algorithm:
- ≥90%: Related (likely same donor)
- 80-90%: Ambiguous/mixed (requires further investigation)
- <80%: Unrelated
Masters Algorithm:
- ≥80%: Related
- 60-80%: Mixed/uncertain
- <60%: Unrelated [19]
The Tanabe algorithm's more stringent relatedness threshold (≥90% versus ≥80%) reflects its stricter emphasis on exact allele matches and heavier penalty for allele imbalances, particularly in polyploid or contaminated lines [19]. For reference matching, researchers utilized the online STR similarity search tool CLASTR (Cell Line Authentication using STR, version 1.4.4) [19].
Comparative Analysis: STR Profiling vs. Isoenzyme Analysis
The following table summarizes the key differences between forensic STR profiling and isoenzyme analysis for cell line authentication:
Table 1: Performance Comparison of Authentication Methods
| Parameter | Forensic STR Profiling | Isoenzyme Analysis |
|---|---|---|
| Discriminatory Power | High (1 in billions to trillions) [65] [45] | Limited to species level [47] |
| Sensitivity | Can detect microsatellite instability and low-frequency contaminants [19] | Poor detection of early cross-contamination [4] |
| Reproducibility | High between laboratories [65] | Difficult to reproduce between labs [65] |
| Technical Demand | Moderate (PCR and capillary electrophoresis) | High (enzyme activity preservation) |
| DNA Requirement | Low (nanogram scale) [19] | High (microgram scale) |
| Time to Result | 1-2 days | 3-5 days |
| Cost Effectiveness | Moderate (decreasing with technological advances) | High (specialized reagents) |
| Standardization | Well-established (ANSI/ATCC ASN-0002) [3] [47] | Limited standardization |
| Data Portability | Digital profiles easily shared and compared | Pattern-based comparison challenging |
Limitations of STR Profiling and Complementary Methods
While STR profiling represents a significant advancement over isoenzyme analysis, it does have limitations. The 2017 analysis of 482 human tumor cell lines revealed that STR profiling alone is insufficient to exclude inter-species cross-contamination [1]. Among 386 cell lines with correct STR profiles, three were inter-species cross-contaminated [1].
This limitation necessitates a multi-faceted approach to comprehensive cell line authentication:
- Species Identification: PCR-based methods can easily identify interspecies contaminants, even at low percentages [1]
- Morphological Examination: Careful microscopic observation can detect obvious morphological changes suggesting contamination [4]
- Mycoplasma Testing: Essential for detecting this common contamination that can alter cell behavior [47]
The integration of these complementary methods with STR profiling creates a robust quality assurance framework for cell line authentication.
Experimental Results and Data Analysis
Authentication Success with Long-Term Stored Samples
The 2025 study demonstrated remarkable success in authenticating the 34-year-old biobanked samples. All uniquely labeled human cell lines were successfully revived and yielded complete STR profiles, confirming both the viability of the cells after long-term cryopreservation and the robustness of forensic STR profiling for such applications [19]. The extensive dataset generated represented one of the most comprehensive single-laboratory investigations into cell line preservation using forensic-grade tools [19].
The authentication process utilized the comparative algorithms discussed in Section 2.3, with match percentages determining relatedness between samples and reference profiles. The study provided new reference alleles and valuable insights into cell line authentication practices, particularly regarding long-term sample storage [19].
Genetic Stability Observations
Throughout the analysis, researchers examined the effects of prolonged passaging and genetic modification on STR stability [19]. While most samples demonstrated remarkable genetic stability over the 34-year storage period, the study documented specific instances of genetic alterations that provided insights into long-term cell line maintenance:
- Stable Profiles: The majority of loci across samples showed no alterations after decades of storage [19]
- Loss of Heterozygosity: Some loci exhibited allele loss in query cell line samples compared to reference alleles [19]
- Allele Addition: Occasional instances of additional alleles appearing in query samples [19]
- Allele Replacement: Rare cases where original alleles were replaced by new alleles [19]
These findings contribute valuable data to our understanding of genetic drift in preserved cell lines and highlight the importance of periodic authentication even for cryopreserved samples.
Research Reagent Solutions Toolkit
The following table outlines essential materials and reagents required for implementing forensic STR profiling for cell line authentication:
Table 2: Essential Research Reagents for STR-Based Authentication
| Reagent/Equipment | Function | Example Products |
|---|---|---|
| DNA Extraction Kit | Isolation of high-quality genomic DNA from cell lines | QIAamp DNA Blood Mini Kit [19] |
| STR Multiplex Kit | Simultaneous amplification of multiple STR loci | SiFaSTR 23-plex system [19], PowerPlex systems [3] |
| DNA Quantification System | Precise measurement of DNA concentration | Qubit fluorometer [19] |
| Thermal Cycler | PCR amplification of STR loci | Applied Biosystems Veriti [69] |
| Genetic Analyzer | Capillary electrophoresis for fragment separation | Classic 116 Genetic Analyzer [19], Applied Biosystems 3500XL [69] |
| Analysis Software | STR profile generation and allele calling | GeneManager [19], GeneMapper ID-X [69] |
| Quality Control Materials | Verification of system performance | Positive control DNA, allelic ladders [70] |
Technological Workflows and Future Directions
STR Authentication Workflow
The following diagram illustrates the comprehensive workflow for authenticating biobanked samples using forensic STR profiling:
Emerging Technologies in STR Analysis
The field of STR analysis continues to evolve, with recent advances promising even greater authentication capabilities:
- Sequence-Based STR Genotyping: Moving beyond length-based analysis to examine specific nucleotide sequences within STR regions, providing greater discriminatory power for complex cases [51]
- Enhanced Multiplex Systems: Development of expanded STR panels covering more loci for improved discrimination [19] [70]
- Automated Analysis Platforms: Integration with database systems for streamlined matching and relationship analysis [70]
- Non-Human STR Systems: Development of similar authentication approaches for animal cell lines used in research [70]
These technological advances will further strengthen the role of STR profiling in biological authentication and quality control frameworks.
The successful authentication of 34-year-old biobanked samples using forensic STRs demonstrates the power and reliability of this methodology for long-term biological resource management [19]. The study provides compelling evidence that STR profiling outperforms traditional methods like isoenzyme analysis in discriminatory power, sensitivity, and reproducibility [19] [65].
Based on the findings from this case study and supporting literature, the following best practices are recommended for research laboratories:
- Implement STR Profiling as Standard Practice: Adopt forensic-grade STR analysis as the primary method for human cell line authentication [19] [3]
- Authenticate at Critical Points: Perform authentication when acquiring new cell lines, before initiating major experiments, before publication, and periodically during long-term use [47]
- Utilize Complementary Methods: Combine STR profiling with species identification and mycoplasma testing for comprehensive quality assurance [1]
- Follow Standardized Guidelines: Adhere to established standards such as ANSI/ATCC ASN-0002 for consistent implementation [3] [47]
- Maintain Proper Documentation: Keep detailed records of authentication results and reference profiles for future comparisons [19]
The application of forensic STR kits beyond traditional forensic samples to genetic research and laboratory management represents an innovative approach that ensures more robust and reliable biological authentication [19]. As research continues to build upon these findings, the scientific community can anticipate further refinements in authentication protocols that will enhance the validity and reproducibility of cell-based research.
In biomedical research, cell lines are indispensable tools for unraveling disease mechanisms and developing new therapies. However, their scientific value is entirely dependent on one critical factor: identity assurance. The use of misidentified or cross-contaminated cell lines has far-reaching consequences, producing unreliable and irreproducible data that misguides scientific inquiry and wastes valuable research resources [17]. For decades, the scientific community relied on isoenzyme analysis as a primary method for cell line authentication. This technique separated enzymes based on their electrophoretic mobility to distinguish between species [4]. While useful for basic species identification, isoenzyme analysis lacked the resolution to detect intra-species cross-contamination, such as the pervasive overgrowth of cultures by HeLa cells, first documented in 1967 [19]. This fundamental limitation created an pressing need for more discriminatory methods, paving the way for the adoption of short tandem repeat (STR) profiling as the new gold standard for human cell line authentication [4] [19].
Historical Context: The Era of Isoenzyme Analysis
Isoenzyme analysis served as an early quality control tool in cell culture laboratories, with its principles and limitations well-documented. The technique focused on detecting species-specific variations in multimeric enzymes through electrophoretic separation. While this allowed researchers to identify gross interspecies contamination, its resolution was insufficient for detecting contamination between cells from the same species [4].
The fundamental shortcomings of isoenzyme analysis became increasingly apparent as research grew more sophisticated:
- Limited Discriminatory Power: Could not differentiate between human cell lines from different individuals
- Inability to Detect HeLa Contamination: Failed to identify the most common form of intra-species contamination
- Subjectivity: Interpretation relied heavily on visual inspection of banding patterns
These limitations had tangible consequences for research integrity. A 2017 analysis of 482 human tumor cell lines found that STR profiling revealed misidentification in 20.5% of lines, with 14.5% representing intra-species cross-contamination that would not have been detected by isoenzyme analysis alone [1].
The Advent of STR Profiling: Technical Superiority
Short tandem repeat profiling emerged as a transformative technology for cell authentication, offering unprecedented discriminatory power at the individual level. STRs are highly polymorphic DNA sequences consisting of repetitive units 2-7 base pairs in length, scattered throughout the human genome. The number of repeats at each locus varies considerably between individuals, creating a unique genetic fingerprint that can be reliably determined using PCR-based amplification and capillary electrophoresis [4] [19].
The technical workflow for STR profiling involves several key steps:
- DNA Extraction: Isolation of high-quality genomic DNA from cell cultures
- PCR Amplification: Multiplexed amplification of 8-23 STR loci using fluorescently labeled primers
- Capillary Electrophoresis: Separation of amplified fragments by size
- Data Analysis: Comparison of obtained STR profile to reference databases
This methodology provides several critical advantages over isoenzyme analysis. The current standard for human cell line authentication employs 21 autosomal STRs plus sex chromosomes, offering exceptional discriminatory power [19]. The results are quantitative, reproducible, and can be digitally archived and compared across laboratories through searchable databases like CLASTR (Cell Line Authentication using STR) [19].
Table 1: Key STR Markers Used in Modern Cell Line Authentication
| STR Marker | Chromosomal Location | Heterozygosity Index | Primary Function |
|---|---|---|---|
| D3S1358 | 3p21.31 | 0.80 | Human identification |
| TH01 | 11p15.5 | 0.79 | Human identification |
| D21S11 | 21q21.1 | 0.85 | Human identification |
| D18S51 | 18q21.33 | 0.87 | Human identification |
| Penta E | 15q26.2 | 0.90 | High discrimination power |
| FGA | 4q28.2 | 0.87 | Human identification |
| Amelogenin | Xp22.3/Yp11.2 | N/A | Sex determination |
Direct Methodological Comparison: STR Profiling vs. Isoenzyme Analysis
When evaluated side-by-side, the technical and practical advantages of STR profiling over isoenzyme analysis become unequivocally clear. The following comparison synthesizes data from multiple studies to illustrate the paradigm shift in authentication capabilities.
Table 2: Direct Comparison of STR Profiling vs. Isoenzyme Analysis
| Parameter | STR Profiling | Isoenzyme Analysis |
|---|---|---|
| Discriminatory Power | Individual level | Species level |
| Sensitivity | Detects 5-10% contamination [1] | Limited to >10-30% contamination |
| Resolution | DNA sequence level | Protein electrophoretic mobility |
| Quantitative Output | Digital allele scores | Visual band interpretation |
| Data Portability | Searchable databases (DSMZ, CLASTR) | Laboratory-specific references |
| Throughput | High (multiplexed PCR) | Low (individual enzyme assays) |
| Standardization | International reference standards [19] | Laboratory-dependent conditions |
| Cross-Species Detection | Requires complementary PCR [1] | Primary strength |
| Cost per Sample | Moderate | Low to moderate |
The superior performance of STR profiling is further demonstrated through experimental data. A comprehensive 2017 study analyzing 482 human tumor cell lines found that STR profiling alone identified 14.5% of lines as intra-species cross-contaminated, while an additional 4.4% showed inter-species contamination that was confirmed with species-specific PCR [1]. This finding highlights that while STR profiling excels at intra-species discrimination, a comprehensive authentication strategy should include complementary techniques for species verification when working with human cell lines.
Experimental Evidence: Validation Studies and Implementation Protocols
Large-Scale Validation Studies
The transition from isoenzyme analysis to STR profiling is supported by substantial experimental evidence from multiple large-scale studies. The 2017 analysis of 482 human tumor cell lines represents one of the most comprehensive validation studies, demonstrating that 96 out of 482 cell lines were misidentified based on STR profiling alone [1]. More significantly, the study revealed that 3 cell lines with correct STR profiles were actually inter-species cross-contaminants, emphasizing the need for combined STR and species verification in quality control protocols [1].
A 2025 study further validated the application of forensic-grade STR markers for authenticating human cell lines preserved over 34 years. Using 23 forensic STR markers, researchers successfully revived and authenticated 91 human cell line samples, confirming the long-term stability of STR profiles and their utility for quality control in biological repositories [19]. The study employed two established algorithms for STR profile matching:
Tanabe Algorithm:
Masters Algorithm:
These algorithms provide standardized approaches for interpreting STR data, with match thresholds established at ≥90% for Tanabe and ≥80% for Masters to indicate relatedness [19].
Standardized Experimental Protocol for STR Profiling
For researchers implementing STR profiling, following a standardized protocol is essential for generating reliable, reproducible results:
Sample Preparation: Culture cells for 3-5 passages to ensure viability and harvest 5×10⁶ cells during logarithmic growth phase [19]
DNA Extraction: Use commercial kits (e.g., QIAamp DNA Blood Mini Kit) to obtain high-quality genomic DNA with minimum concentration of 0.1 ng/μL [19]
STR Amplification: Perform multiplex PCR using validated STR kits (e.g., SiFaSTR 23-plex system) that amplify 21 autosomal STRs plus sex markers under the following cycling conditions:
- Denaturation: 95°C for 2 minutes
- 28-30 cycles of: 94°C for 30 seconds, 59°C for 90 seconds, 65°C for 60 seconds
- Final extension: 60°C for 20 minutes [19]
Capillary Electrophoresis: Separate amplified fragments using genetic analyzers (e.g., Classic 116 Genetic Analyzer) with internal size standards
Data Analysis: Use specialized software (e.g., GeneManager) to convert raw data into allele calls and compare against reference databases using established matching algorithms [19]
Implementing robust cell authentication requires specific research reagents and database resources. The following table details essential components of the modern authentication toolkit:
Table 3: Essential Research Reagents and Resources for STR Profiling
| Resource Type | Specific Examples | Function/Purpose |
|---|---|---|
| STR Profiling Kits | SiFaSTR 23-plex, PowerPlex 16 | Multiplex amplification of STR loci |
| DNA Extraction Kits | QIAamp DNA Blood Mini Kit | High-quality genomic DNA isolation |
| Genetic Analyzers | Classic 116 Genetic Analyzer, ABI 3500 | Capillary electrophoresis separation |
| Analysis Software | GeneManager, GeneMapper ID-X | Automated allele calling and analysis |
| Reference Databases | DSMZ STR Database, CLASTR | Reference STR profiles for comparison |
| Quality Standards | ATCC STR Guidelines, ICLAC Standards | Authentication protocols and match criteria |
STR profiling has unequivocally supplanted isoenzyme analysis as the gold standard for cell line authentication, offering superior discriminatory power, sensitivity, and standardization. The experimental evidence demonstrates that STR profiling identifies misidentification in over 20% of cell lines, a substantial improvement over earlier methods [1]. However, the evolution of authentication technologies continues, with sequence-based STR genotyping emerging as a potential future direction that could offer even greater resolution [51].
Despite these advances, critical challenges remain. No single method addresses all authentication concerns, as evidenced by the need to combine STR profiling with species verification to detect inter-species contamination [1]. Furthermore, the research community must maintain vigilance against complacency, as noted in a 2010 report that some laboratories still operate with an "I'd just as soon not know" attitude toward cell authentication [4]. The implementation of journal requirements [17] and funding agency mandates represents significant progress, but sustained commitment to authentication practices is essential for research integrity.
The trajectory from isoenzyme analysis to STR profiling represents more than just a technical upgrade—it signifies the research community's growing commitment to rigor and reproducibility in biomedical science. As technologies continue to evolve, this commitment must remain the constant foundation upon which reliable scientific discovery is built.
In the evolving landscape of cell line authentication, short tandem repeat (STR) profiling has emerged as the undisputed gold standard for human cell line identification, offering exceptional discrimination at the individual level. However, a comprehensive authentication strategy requires a multi-faceted approach. This guide objectively evaluates the specific technical scenarios where the older, well-established technique of isoenzyme analysis maintains its utility as a complementary tool. We detail its optimal use cases, supported by experimental data and protocols, to help researchers and drug development professionals build robust, cost-effective authentication workflows.
Cell line misidentification and cross-contamination represent a silent but significant threat to biomedical research, potentially invalidating experimental results and jeopardizing drug development pipelines [4]. In response, the scientific community has developed and adopted various authentication technologies. Short tandem repeat (STR) profiling, which analyzes highly polymorphic microsatellite regions in DNA, has rightly become the standard method for authenticating human cell lines, providing a unique genetic fingerprint with random match probabilities often lower than one in a trillion [28] [65]. Its high sensitivity, specificity, and reproducibility have made it a requirement for many scientific journals [47].
Concurrently, isoenzyme analysis, a technique that exploits species-specific differences in the electrophoretic mobility of intracellular enzymes, has seen a decline in routine use, partly due to the commercial discontinuation of key reagents [46]. Despite this trend, a complete dismissal of isoenzyme analysis is unwarranted. It remains a technically sound, rapid, and cost-effective method for addressing specific authentication questions, particularly concerning species origin and interspecies contamination [5]. This guide defines the specific niches where isoenzyme analysis remains a scientifically viable tool.
Methodological Comparison and Key Differentiators
To understand the distinct roles of STR profiling and isoenzyme analysis, a direct comparison of their core characteristics is essential.
Table 1: Core Characteristics of STR Profiling vs. Isoenzyme Analysis
| Characteristic | STR Profiling | Isoenzyme Analysis |
|---|---|---|
| Analytical Target | Genomic DNA (short tandem repeat loci) | Enzymatic proteins (e.g., lactate dehydrogenase, glucose-6-phosphate dehydrogenase) |
| Primary Resolution | Individual level (intraspecies) | Species level (interspecies) |
| Key Advantage | High-power discrimination between individuals of the same species | Rapid, low-cost confirmation of species of origin |
| Typical Sensitivity | High (can detect minor components in a mixture) | Moderate (requires contaminant to be ~10% of population) [46] [5] |
| Throughput & Cost | Higher cost, requires specialized instrumentation | Lower cost, technically simpler, faster turnaround [5] |
| Best Application | Authentication of human cell lines to a specific donor | Speciation and screening for interspecies contamination |
The following workflow diagram illustrates the strategic placement of both techniques within a comprehensive cell line authentication protocol:
Figure 1: Integrated Authentication Workflow. This workflow positions isoenzyme analysis as an effective initial filter for species verification before more resource-intensive STR profiling.
The Operational Niche for Isoenzyme Analysis
Isoenzyme analysis retains its viability in several defined situations, primarily where its strengths in rapid speciation align with the authentication requirement.
Initial Species Verification and Contamination Screening
The most robust application of isoenzyme analysis is the initial verification of a cell line's species of origin. When a new cell line is derived or acquired from a non-repository source, its claimed species can be quickly confirmed using this method [16] [5]. Furthermore, it serves as an efficient screen for gross interspecies contamination, which can occur through laboratory errors like using shared reagents or simultaneous handling of multiple cell lines [4].
Experimental data from a large-scale, seven-year testing program demonstrated that isoenzyme analysis is effective for this purpose. In an evaluation of nearly 900 cell submissions, the technique successfully identified the few instances of interspecies contamination that existed, confirming its reliability as a screening tool [5].
Detection of Stable Mixed-Species Cultures
In instances where two cell lines from different species with similar growth characteristics are co-cultured, a stable mixed population can form. Isoenzyme analysis can detect these interspecies mixtures, provided the contaminating cells constitute a sufficient proportion of the total population (typically ≥10%) [46]. The effectiveness depends on selecting the correct enzymes for the specific species pair in question.
Table 2: Enzyme Selection for Detecting Specific Interspecies Contaminations [5]
| Contaminating Species Mixture | Most Discriminatory Enzymes |
|---|---|
| Chinese Hamster vs. Mouse | Peptidase B (PepB) |
| Human vs. Cercopithecus Monkey | Aspartate Amino Transferase (AST), Malate Dehydrogenase (MD) |
| Human vs. Chinese Hamster | Lactate Dehydrogenase (LD) |
The electropherogram results visually demonstrate this capability. For example, in a deliberate contamination model where fast-growing Chinese hamster ovary (CHO-K1) cells were introduced into a culture of slower-growing human MRC-5 cells, distinct bands for the lactate dehydrogenase (LD) of each species were visible when each cell type represented just 11% of the total population [5]. This confirms the practical sensitivity of the method for detecting emerging cross-contaminations within a few passages.
Resource-Limited and Rapid-Turnaround Scenarios
The technical simplicity and speed of isoenzyme analysis make it a pragmatic choice in specific operational contexts. The method provides results within a single workday, bypassing the need for the DNA extraction, PCR amplification, and capillary electrophoresis required for STR profiling [5]. For laboratories requiring high-throughput speciation of numerous samples or those working under budget constraints that preclude outsourcing STR services, a properly implemented isoenzyme protocol offers a valuable in-house capability.
Experimental Protocol for Isoenzyme Analysis
For laboratories intending to implement this technique, the following protocol, based on the use of a commercial kit like the AuthentiKit system, provides a detailed methodology [5].
Principle: Cell extracts are subjected to agarose gel electrophoresis. The gels are then overlaid with specific substrate solutions for various intracellular enzymes. The enzymatic reaction produces a colored precipitate at the site of the enzyme band, allowing visualization of its migration distance, which is characteristic of the species.
Research Reagent Solutions: Table 3: Essential Reagents for Isoenzyme Analysis
| Reagent / Material | Function |
|---|---|
| Cell Lysate | Source of intracellular enzymes for analysis. |
| Agarose Gels | Matrix for electrophoretic separation of enzyme isoforms. |
| Enzyme Substrate Solutions (e.g., for LD, G6PD, NP) | Specific substrates that form a colored precipitate upon enzymatic reaction, revealing band location. |
| Electrophoresis Buffer | Provides the ionic medium for conducting current during separation. |
| Species Reference Standards (e.g., Mouse L929, Human HeLa extract) | Controls for normalizing migration distances and accurate species identification. |
Step-by-Step Workflow:
- Sample Preparation: Harvest cells and prepare a clarified cell lysate containing the soluble intracellular enzymes.
- Gel Loading: Load the test cell lysates, along with the standard (e.g., mouse L929) and control (e.g., human HeLa) reagents, into the wells of an agarose gel.
- Electrophoresis: Run the gel at a constant voltage until the marker dye has migrated an appropriate distance. This separates the enzyme isoforms based on their charge and size.
- Enzyme-Specific Staining: After electrophoresis, overlay each gel with a specific substrate solution for a target enzyme (e.g., Lactate Dehydrogenase (LD), Glucose-6-Phosphate Dehydrogenase (G6PD)).
- Color Development & Termination: Incubate the gel to allow the enzymatic reaction to produce a visible, insoluble band. Monitor development closely and stop the reaction by washing with a stop solution before background staining or over-development obscures the bands.
- Data Analysis: Measure the migration distance of each band from the origin. Correct the test sample distances using a correction factor derived from the standard reagent. Compare the corrected distances to a standardized chart of migration distances for various species to make the species assignment.
Figure 2: Isoenzyme Analysis Workflow. The process from cell harvest to band pattern analysis is straightforward and can be completed in a few hours.
In the contemporary framework of cell line authentication, STR profiling and isoenzyme analysis are not mutually exclusive but can be strategically complementary. STR profiling is indispensable for confirming the unique identity of human cell lines. However, isoenzyme analysis maintains a defined niche as a rapid, cost-efficient, and reliable technique for answering fundamental questions about species origin and for screening against interspecies contamination. A robust authentication strategy understands the strengths and limitations of each tool, employing isoenzyme analysis for initial speciation and contamination checks, and reserving STR profiling for the definitive, individual-level authentication of human cell lines. This integrated approach ensures the highest level of integrity and reproducibility in biomedical research.
Conclusion
The comprehensive comparison between STR profiling and isoenzyme analysis clearly establishes STR profiling as the contemporary gold standard for cell line authentication, particularly for human cell lines. Its superior discriminatory power, ability to identify cross-contamination at the individual level, and alignment with international standards like ANSI/ATCC ASN-0002 make it indispensable for ensuring research integrity. While isoenzyme analysis played a historic role in species verification, its limitations in sensitivity and reproducibility have narrowed its application. The future of biomedical research hinges on rigorous authentication practices. Widespread adoption of STR profiling, integrated with routine mycoplasma testing and good cell culture practices, will be fundamental to accelerating valid discovery, enhancing the reproducibility of scientific literature, and successfully translating basic research into reliable clinical applications.
References
- 1. A Combination of Species Identification and STR Profiling ... [https://www.nature.com/articles/s41598-017-09660-w]
- 2. Investigation of Cross-Contamination and Misidentification of ... [https://journals.plos.org/plosone/article?id=10.1371/journal.pone.0170384]
- 3. Doing Good Science: Authenticating Cell Line Identity [https://www.promega.com/resources/pubhub/cell-line-authentication-with-strs-2012-update/]
- 4. Short tandem repeat profiling: part of an overall strategy for ... [https://pmc.ncbi.nlm.nih.gov/articles/PMC2995877/]
- 5. Cell Line Authentication Using Isoenzyme Analysis [https://www.biopharminternational.com/view/cell-line-authentication-using-isoenzyme-analysis]
- 6. Advantages of a 21-loci short tandem repeat method for ... [https://www.sciencedirect.com/science/article/abs/pii/S0378111920307174]
- 7. High-throughput sequencing for species authentication ... [https://www.nature.com/articles/s41598-021-00779-5]
- 8. Performance of two 17 locus forensic identification STR kits ... [https://www.sciencedirect.com/science/article/abs/pii/S1872497311002365]
- 9. The impact of parameter variation in the quantification ... [https://www.nature.com/articles/s41598-024-83841-2]
- 10. Authentication of Human and Mouse Cell Lines by Short ... [https://www.ncbi.nlm.nih.gov/books/NBK144066/]
- 11. Register of Misidentified Cell Lines – ICLAC [https://iclac.org/databases/cross-contaminations/]
- 12. HeLa [https://en.wikipedia.org/wiki/HeLa]
- 13. Human Cell STR Profiling Service [https://www.atcc.org/services/cell-authentication/human-cell-str-testing]
- 14. STR analysis in human sample authentication [https://www.thermofisher.com/us/en/home/life-science/sequencing/fragment-analysis/short-tandem-repeat-analysis-human-sample-identification.html]
- 15. Databases and Datasets – ICLAC [https://iclac.org/databases/]
- 16. Cell Line Authentication Test Recommendations [https://www.atcc.org/resources/technical-documents/cell-line-authentication-test-recommendations]
- 17. Cell line authentication and validation is a key requirement ... [https://pmc.ncbi.nlm.nih.gov/articles/PMC12181071/]
- 18. Why the Future of Biological Research Requires Cell Line ... [https://www.psomagen.com/blog/future-of-research-requires-cell-line-authentication]
- 19. Innovative use of forensic STRs for authentication ... [https://www.oaepublish.com/articles/jtgg.2025.08]
- 20. Cell Line Cross-Contamination and Misidentification [https://www.sigmaaldrich.com/US/en/technical-documents/technical-article/cell-culture-and-cell-culture-analysis/mammalian-cell-culture/cell-culture-troubleshooting-cell-line-misidentification?srsltid=AfmBOoqEIKUDcB4agaWVDUeKmqVAEnZZibm99wj6VHL3SRP6ef2QZaWd]
- 21. Authentication of Key Biological and/or Chemical Resources [https://ctsi.ucla.edu/nih-requirements/authentication]
- 22. Initial submission [https://www.nature.com/nature/for-authors/initial-submission]
- 23. Submission guidelines | Scientific Reports [https://www.nature.com/srep/author-instructions/submission-guidelines]
- 24. AACR Annual Meeting 2025 [https://www.aacr.org/meeting/aacr-annual-meeting-2025/]
- 25. Code of Conduct and Health and Safety Procedures [https://www.aacr.org/meeting/aacr-annual-meeting-2025/code-of-conduct-and-health-and-safety-procedures/]
- 26. Past, Present and Future Perspectives of Forensic Genetics [https://www.mdpi.com/2218-273X/15/5/713]
- 27. STR analysis [https://en.wikipedia.org/wiki/STR_analysis]
- 28. Forensic DNA Profiling: Autosomal Short Tandem Repeat ... [https://pmc.ncbi.nlm.nih.gov/articles/PMC7444828/]
- 29. Multidye Fluorescent Detection - PID Volume 12 Fall 2025 [https://promega.foleon.com/profiles-in-dna/pid-volume-12-fall-2025/multidye-fluorescent-detection]
- 30. Cell Line Cross-Contamination and Misidentification [https://www.sigmaaldrich.com/US/en/technical-documents/technical-article/cell-culture-and-cell-culture-analysis/mammalian-cell-culture/cell-culture-troubleshooting-cell-line-misidentification?srsltid=AfmBOopH0VW9VOl4Ev3IuBeBE-ZiphGpI3I3IyFpYcPgwTWIziDz104z]
- 31. STR Profiling Analysis [https://www.atcc.org/search-str-database/str-profiling-analysis]
- 32. Applicability of human-specific STR systems, GlobalFiler ... [https://bmcresnotes.biomedcentral.com/articles/10.1186/s13104-021-05632-6]
- 33. Performance of two 17 locus forensic identification STR kits ... [https://pubmed.ncbi.nlm.nih.gov/22266064/]
- 34. Comparison of six commercially available STR kits for their ... [https://www.sciencedirect.com/science/article/pii/S2665910721000748]
- 35. Performance comparison of a previously validated ... [https://www.sciencedirect.com/science/article/pii/S1872497324001406]
- 36. Lactate Dehydrogenase Isoenzyme Electrophoretic Pattern ... [https://www.intechopen.com/chapters/61001]
- 37. Electrophoresis of LDH Isoenzymes and Activity Staining [https://www.slideshare.net/slideshow/electrophoresis-of-ldh-isoenzymes-and-activity-staining/81403534]
- 38. Improved electrophoretic resolution of LDH isoenzymes in ... [https://pubmed.ncbi.nlm.nih.gov/679485/]
- 39. Real-world testing of serum lactate dehydrogenase among ... [https://pmc.ncbi.nlm.nih.gov/articles/PMC12265455/]
- 40. Pyruvate dehydrogenase complex and lactate ... [https://pmc.ncbi.nlm.nih.gov/articles/PMC6057136/]
- 41. DNA Extraction and Isolation Protocols [https://www.thermofisher.com/us/en/home/references/protocols/nucleic-acid-purification-and-analysis/dna-extraction-protocols.html]
- 42. Interpreting Electrophoresis Gels [https://bento.bio/resources/bento-lab-advice/interpreting-electrophoresis-gels-with-bento-lab/]
- 43. A Comparative Assessment of Promega 8-Dye STR Kits ... [https://www.ishinews.com/events/a-comparative-assessment-of-promega-8-dye-str-kits-and-the-spectrum-ce-system-do-they-present-new-dye-namics-in-str-profiling/]
- 44. STRprofiler: efficient comparisons of short tandem repeat ... [https://pmc.ncbi.nlm.nih.gov/articles/PMC11634538/]
- 45. Research Laboratory Applications of STR Technology [https://www.promega.com/resources/pubhub/research-laboratory-applications-of-str-technology/]
- 46. Isoenzyme Analysis - an overview [https://www.sciencedirect.com/topics/medicine-and-dentistry/isoenzyme-analysis]
- 47. Find out why you need to authenticate your cell line! [https://the-dna-universe.com/2020/03/05/why-you-need-to-authenticate-your-cell-line/]
- 48. Guidelines for the use of cell lines in biomedical research [https://www.nature.com/articles/bjc2014166]
- 49. Use of Autosomal Short Tandem Repeats in Forensic DNA ... [https://pmc.ncbi.nlm.nih.gov/articles/PMC9650913/]
- 50. STRaM: A genetic framework for improved cell product ... [https://www.nature.com/articles/s42003-025-08547-1]
- 51. 2025 Study Explores Sequence-Based STR Genotyping for ... [https://www.geneonline.com/2025-study-explores-sequence-based-str-genotyping-for-enhanced-kinship-analysis-in-forensic-science/]
- 52. Past, Present and Future Perspectives of Forensic Genetics [https://pmc.ncbi.nlm.nih.gov/articles/PMC12109078/]
- 53. Mouse Cell Line Authentication Service Market Outlook ... [https://www.intelmarketresearch.com/mouse-cell-line-authentication-service-2025-2032-665-6024]
- 54. Unraveling the Importance of Mammalian Cell Line ... [https://cellculturecompany.com/unraveling-the-importance-of-mammalian-cell-line-authentication/]
- 55. A Beginner's Guide to Cell Culture: Practical Advice for ... [https://pmc.ncbi.nlm.nih.gov/articles/PMC10000895/]
- 56. Advancing GCCP [https://caat.jhsph.edu/advancing-gccp/]
- 57. Cell Culture Contamination: 5 Common Sources and How ... [https://www.capricorn-scientific.com/knowledge-center/cell-culture-contamination]
- 58. Cell Culture Contamination Troubleshooting [https://www.sigmaaldrich.com/US/en/technical-documents/technical-article/cell-culture-and-cell-culture-analysis/mammalian-cell-culture/cell-culture-troubleshooting-contamination?srsltid=AfmBOorbA2tj6HkBGCTvaWwyiotJaER-8urr3E5AD6sPx0j806MSohkL]
- 59. Cell Culture Contamination | Thermo Fisher Scientific - US [https://www.thermofisher.com/us/en/home/references/gibco-cell-culture-basics/biological-contamination.html]
- 60. Isoenzyme and molecular approach for authenticating and ... [https://pubmed.ncbi.nlm.nih.gov/31618408/]
- 61. Recommendation of short tandem repeat profiling for ... [https://pmc.ncbi.nlm.nih.gov/articles/PMC2965362/]
- 62. CLASTR: The Cellosaurus STR similarity search tool [https://pubmed.ncbi.nlm.nih.gov/31444973/]
- 63. Interrogating the Database [https://www.atcc.org/search-str-database/interrogating-the-database]
- 64. analysis in human sample STR authentication [https://www.thermofisher.com/sg/en/home/life-science/sequencing/fragment-analysis/short-tandem-repeat-analysis-human-sample-identification.html]
- 65. Profiling and authentication of human cell lines using short ... [https://www.sciencedirect.com/science/article/abs/pii/S1045105606001126]
- 66. Cell Line Cross-Contamination and Misidentification [https://www.sigmaaldrich.com/US/en/technical-documents/technical-article/cell-culture-and-cell-culture-analysis/mammalian-cell-culture/cell-culture-troubleshooting-cell-line-misidentification?srsltid=AfmBOorVGlYyRnzZ86aG2zANY9SB3oQTl6kwUTfHZjQ11NtKa5hDVpjB]
- 67. Short tandem repeat profiling via next-generation ... [https://pmc.ncbi.nlm.nih.gov/articles/PMC10618599/]
- 68. Human Cell Line Authentication Through STR Profiling [https://www.cgm.northwestern.edu/cores/nuseq/services/cell-line-authentication.html]
- 69. Long-Term DNA Storage of Challenging Forensic ... [https://www.mdpi.com/2673-8856/5/2/29]
- 70. Developmental Validation of DNA Quantitation System ... [https://pmc.ncbi.nlm.nih.gov/articles/PMC12028859/]