VICTOR: A Comprehensive Guide to Assessing Cell Type Annotation Quality in Single-Cell RNA Sequencing
This article provides a detailed exploration of VICTOR (Validation and Inspection of Cell Type Annotation Through Optimal Regression), a novel method for gauging the confidence of automated cell type annotations...
VICTOR: A Comprehensive Guide to Assessing Cell Type Annotation Quality in Single-Cell RNA Sequencing
Abstract
This article provides a detailed exploration of VICTOR (Validation and Inspection of Cell Type Annotation Through Optimal Regression), a novel method for gauging the confidence of automated cell type annotations in single-cell RNA sequencing data. Tailored for researchers, scientists, and drug development professionals, we cover its foundational principles, methodological application across diverse datasets (within-platform, cross-platform, cross-studies, and cross-omics), strategies for troubleshooting and optimization, and a comparative analysis of its diagnostic performance against existing methods. The guide aims to empower scientists to enhance the reliability of their single-cell analyses, thereby accelerating discoveries in biomedicine.
Understanding VICTOR: The Critical Need for Reliable Cell Type Annotation
The Challenge of Automated Cell Annotation in Single-Cell RNA Sequencing
Single-cell RNA sequencing (scRNA-seq) has revolutionized biological research by providing unprecedented resolution for exploring cellular heterogeneity in complex tissues and organisms. A fundamental step in analyzing scRNA-seq data involves cell type identification, which has traditionally relied on manual annotation—a process requiring expert knowledge, extensive time, and suffering from irreproducibility across different research groups [1]. As the scale of single-cell studies continues to grow exponentially, with datasets now routinely encompassing millions of cells, manual annotation has become a critical bottleneck in analysis pipelines [1] [2].
The emergence of automated cell identification methods addresses this challenge by providing standardized, scalable approaches for cell type assignment. These computational methods leverage previously annotated reference datasets or established marker gene databases to automatically label cells in new experiments [1] [3]. However, the rapid development of numerous classification approaches—each with different underlying algorithms, requirements, and performance characteristics—has created a new challenge: researchers must navigate a complex landscape of tools without clear guidance on their relative strengths and limitations. This comparison guide provides an objective assessment of automated cell annotation methods, evaluates their performance against standardized benchmarks, and examines the critical role of validation tools like VICTOR in ensuring annotation quality [4].
Methodological Landscape of Automated Cell Annotation Tools
Automated cell annotation methods employ diverse computational strategies, which can be broadly categorized into several distinct approaches based on their underlying methodology:
Marker-based methods utilize predefined lists of cell-type-specific marker genes to assign identities to cells or clusters. Tools like ScType, Garnett, and SCINA fall into this category, leveraging comprehensive marker databases to annotate cell populations [1] [3]. These methods typically employ statistical approaches to detect the expression of positive marker genes (indicating presence of a cell type) and negative marker genes (providing evidence against a cell type) [3]. ScType, for instance, introduces a specificity score that ensures marker genes are informative across both cell clusters and cell types, addressing the challenge of genes that are expressed in multiple cell populations [3].
Reference-based correlation methods identify cell types by comparing gene expression patterns in unannotated cells to those in pre-annotated reference datasets. SingleR and CHETAH employ this strategy, calculating correlation coefficients or other similarity metrics between query cells and reference cell types [1]. These methods benefit from not requiring training but depend heavily on the quality and comprehensiveness of the reference data.
Supervised classification methods treat cell type identification as a machine learning problem, training classifiers on labeled reference datasets to predict cell identities in new data. This category includes both single-cell-specific classifiers (like scPred and ACTINN) and general-purpose classifiers (including Support Vector Machines (SVM), Random Forests, and neural networks) [1]. These models learn discriminative patterns from gene expression features associated with each cell type, then apply this learned decision function to classify new cells.
Hybrid approaches combine elements from multiple strategies. For example, some methods integrate marker gene information with supervised learning, while others employ neural networks that learn latent representations of cells before classification [1] [2]. The scVI method uses a deep generative model to account for technical noise and batch effects before performing downstream analysis [1].
Table 1: Categories of Automated Cell Annotation Methods
| Category | Representative Tools | Underlying Methodology | Training Requirement |
|---|---|---|---|
| Marker-based | ScType, Garnett, SCINA | Marker gene detection | Marker database only |
| Reference-based | SingleR, CHETAH | Correlation/similarity matching | Pre-annotated reference dataset |
| Supervised classification | scPred, ACTINN, SVM | Machine learning classifiers | Labeled training data |
| Neural networks | scVI, Cell-BLAST | Deep learning models | Labeled training data |
Comprehensive Performance Benchmarking of Annotation Tools
Large-Scale Benchmarking Reveals Performance Variations
A comprehensive benchmark study evaluating 22 classification methods across 27 publicly available scRNA-seq datasets provides critical insights into the relative performance of automated annotation tools [1] [5]. The datasets represented various technologies, species, tissue types, and complexity levels, allowing robust evaluation under diverse conditions. Performance was assessed using two experimental setups: intra-dataset evaluation (5-fold cross-validation within datasets) and the more challenging inter-dataset evaluation (training on one dataset and predicting on another) [1].
The results demonstrated that most classifiers perform well on a variety of datasets, with decreased accuracy for complex datasets containing overlapping cell populations or "deep" annotations with finely resolved subtypes [1]. Notably, general-purpose classifiers—particularly Support Vector Machine (SVM) with linear kernel—achieved consistently high performance across different experiments, outperforming many single-cell-specific methods [1] [6]. This surprising result suggests that well-established machine learning algorithms can effectively learn the discriminative patterns in gene expression data necessary for accurate cell type identification.
Table 2: Performance Comparison of Selected Cell Annotation Methods
| Method | Type | Overall Accuracy | Computation Speed | Handles Novel Cells | Key Strengths |
|---|---|---|---|---|---|
| SVM (linear) | General-purpose | High | Fast | No | Best overall performance in benchmarking |
| ScType | Marker-based | High (98.6%) | Very fast | Yes | Fully automated, requires no reference |
| scSorter | Marker-based | High | Moderate | Yes | High accuracy but slower than ScType |
| SingleR | Reference-based | Moderate | Moderate | No | Simple correlation-based approach |
| Random Forest | General-purpose | High | Slow | No | Robust to noise in data |
| SCINA | Marker-based | Moderate | Fast | Yes | Fast but lower accuracy on complex datasets |
Specialized Tools for Specific Applications
The benchmarking also revealed that certain tools excel in specific applications. ScType, for instance, demonstrated remarkable accuracy (98.6% across 6 datasets) and speed, correctly annotating 72 out of 73 cell types including 8 that were originally misannotated in published studies [3]. In a reanalysis of human liver scRNA-seq data, ScType automatically distinguished between two closely related B-cell populations (immature and plasma B cells) that were not differentiated in the original manuscript [3]. Similarly, when applied to mouse retinal data, ScType identified three closely related amacrine cell types and distinguished between rod and cone bipolar cells that were originally grouped together [3].
The exceptional speed of ScType—more than 30 times faster than the next best performing method scSorter—makes it particularly valuable for large-scale datasets [3]. This performance advantage stems from its focused use of highly specific marker combinations rather than analyzing entire transcriptomes, demonstrating that strategic feature selection can optimize both accuracy and computational efficiency.
Experimental Protocols for Method Evaluation
Standardized Benchmarking Frameworks
The benchmark study conducted by Abdelaal et al. employed rigorous experimental protocols to ensure fair comparison across methods [1] [5]. For intra-dataset evaluation, they implemented 5-fold cross-validation, where each dataset was randomly split into five subsets, with four used for training and one for testing, repeating this process five times with different test sets [1]. This approach evaluates how well methods learn cell types within the same dataset, controlling for batch effects and technical variation.
For inter-dataset evaluation, the researchers trained classifiers on one dataset and tested on completely different datasets, mimicking the real-world application of using a reference atlas to annotate new experiments [1]. This more challenging assessment tests method robustness to biological and technical variations across studies. Performance was quantified using F1-scores (harmonic mean of precision and recall), percentage of unclassified cells, and computation time [1] [6].
Specialized Evaluation Protocols
Additional experiments assessed specific aspects of classification performance:
- Feature selection sensitivity: Methods were evaluated using different gene selection strategies (highly variable genes, differentially expressed genes, or all genes) to determine their impact on performance [1].
- Population size sensitivity: Tests measured how classification accuracy changes with varying numbers of cells per population, revealing which methods handle rare cell types effectively [1].
- Annotation level performance: Evaluation across different hierarchical levels of annotation (from major cell types to fine subtypes) determined how methods perform at different resolutions [1].
These standardized protocols provide a framework for ongoing evaluation of new methods as they emerge, with all code publicly available on GitHub to facilitate community use and extension [1] [6].
Cell Annotation Workflow with Validation
VICTOR: A Framework for Validation and Inspection of Cell Type Annotations
Addressing the Validation Challenge
As automated annotation methods proliferate, assessing the reliability of predicted cell labels has emerged as a critical challenge, particularly for rare and novel cell types that may be poorly represented in reference datasets [4]. VICTOR (Validation and Inspection of Cell Type Annotation through Optimal Regression) addresses this need by providing a robust framework for gauging confidence in cell annotations [4].
The method employs elastic-net regularized regression with optimal thresholds to identify potentially inaccurate annotations [4]. Elastic-net regularization combines the advantages of L1 (lasso) and L2 (ridge) regression, providing effective feature selection while handling correlated variables—a common characteristic in gene expression data. By learning the relationship between gene expression patterns and cell type labels, VICTOR can identify cells whose expression profiles deviate significantly from their assigned type, flagging them for manual inspection or reannotation.
Performance Across Diverse Contexts
VICTOR has demonstrated strong performance in identifying inaccurate annotations across various challenging scenarios, including within-platform, cross-platform, cross-study, and cross-omics settings [4]. This versatility is particularly valuable for real-world applications where researchers often integrate datasets generated using different technologies or from multiple studies. The method's ability to maintain diagnostic accuracy across these diverse contexts suggests it captures fundamental biological signals rather than technology-specific artifacts.
The introduction of VICTOR represents an important shift in the field—from simply assigning labels to also quantifying confidence in those assignments. This capability is especially crucial for clinical applications, such as drug development, where inaccurate cell type identification could lead to erroneous conclusions about cell-type-specific drug responses or toxicity profiles.
Practical Implementation and Research Reagents
Successful implementation of automated cell annotation requires both computational tools and biological reference resources. The following table details key research reagents and their functions in the annotation process:
Table 3: Essential Research Reagents for Automated Cell Annotation
| Resource | Type | Function | Applicability |
|---|---|---|---|
| ScType Database | Marker gene database | Provides positive/negative marker genes for cell types | Human and mouse tissues |
| CellMarker 2.0 | Marker gene database | Curated marker database for various tissues | Human and mouse (467/389 cell types) |
| PanglaoDB | Marker gene database | Collection of marker genes from single-cell studies | Focus on human cell types |
| Human Cell Atlas | Reference dataset | Multi-organ reference atlas | 33 human organs |
| Mouse Cell Atlas | Reference dataset | Comprehensive mouse cell atlas | 98 major cell types |
| Tabula Muris | Reference dataset | Single-cell data across mouse tissues | 20 organs and tissues |
Implementation Considerations
When implementing automated annotation pipelines, researchers should consider several practical aspects:
- Data quality requirements: Effective annotation requires adequate sequencing depth, cell viability, and minimal technical artifacts [2]. Quality control metrics including number of detected genes, total molecule count, and mitochondrial gene percentage should be evaluated before annotation [2].
- Batch effect management: When using reference-based approaches, batch effects between training and query datasets can significantly impact performance [1]. Methods that explicitly model batch effects (like scVI) may be preferable for cross-dataset applications.
- Marker database selection: For marker-based methods, the completeness and relevance of the marker database strongly influences performance [3] [2]. Researchers should select databases with strong coverage of their tissue of interest and regularly update these resources as new markers are discovered.
- Computational resources: Methods based on neural networks or processing large reference datasets may require substantial computational resources [1], while marker-based methods like ScType can provide rapid annotations even on standard workstations [3].
Annotation Validation Decision Framework
The field of automated cell annotation for single-cell RNA sequencing data has matured significantly, with numerous methods now available that demonstrate good performance across diverse datasets. Benchmarking studies reveal that while general-purpose classifiers like SVM compete strongly with specialized methods, the optimal tool choice depends on specific research contexts—marker-based methods like ScType offer speed and automation for standard cell types, while reference-based and supervised approaches provide robustness for novel datasets [1] [3].
The introduction of validation frameworks like VICTOR represents an important advancement, addressing the critical need for confidence assessment in automated annotations [4]. As the field progresses, key challenges remain in handling rare cell types, managing batch effects across platforms, and dynamically updating marker databases with newly discovered cell types [2]. Future developments will likely focus on integrating multiple annotation approaches, improving methods for identifying novel cell types not present in reference data, and enhancing the interpretability of automated classifications.
For researchers and drug development professionals, establishing standardized annotation pipelines that incorporate multiple methods followed by rigorous validation will be essential for generating reproducible, biologically meaningful results. The comprehensive benchmarking data and methodological frameworks presented here provide a foundation for developing such pipelines, ultimately accelerating single-cell research and its translation to therapeutic applications.
In single-cell RNA sequencing (scRNA-seq) analysis, accurate cell type annotation is foundational for downstream biological interpretation. However, the assessment of annotation quality remains a significant challenge. VICTOR (Validation and Inspection of Cell Type Annotation through Optimal Regression) is a method designed to address this gap by providing a robust, quantitative framework for evaluating the confidence and accuracy of cell type labels [7].
This guide objectively compares VICTOR's performance with other available alternatives, providing researchers with the experimental data and methodologies needed to make informed decisions for their single-cell analysis workflows.
Core Principles and Methodology of VICTOR
VICTOR operates on a central principle: that the quality of cell type annotation can be quantitatively assessed by examining the relationship between a cell's transcriptomic profile and its assigned label. Its innovation lies in the application of elastic-net regularized regression to solve this problem [7].
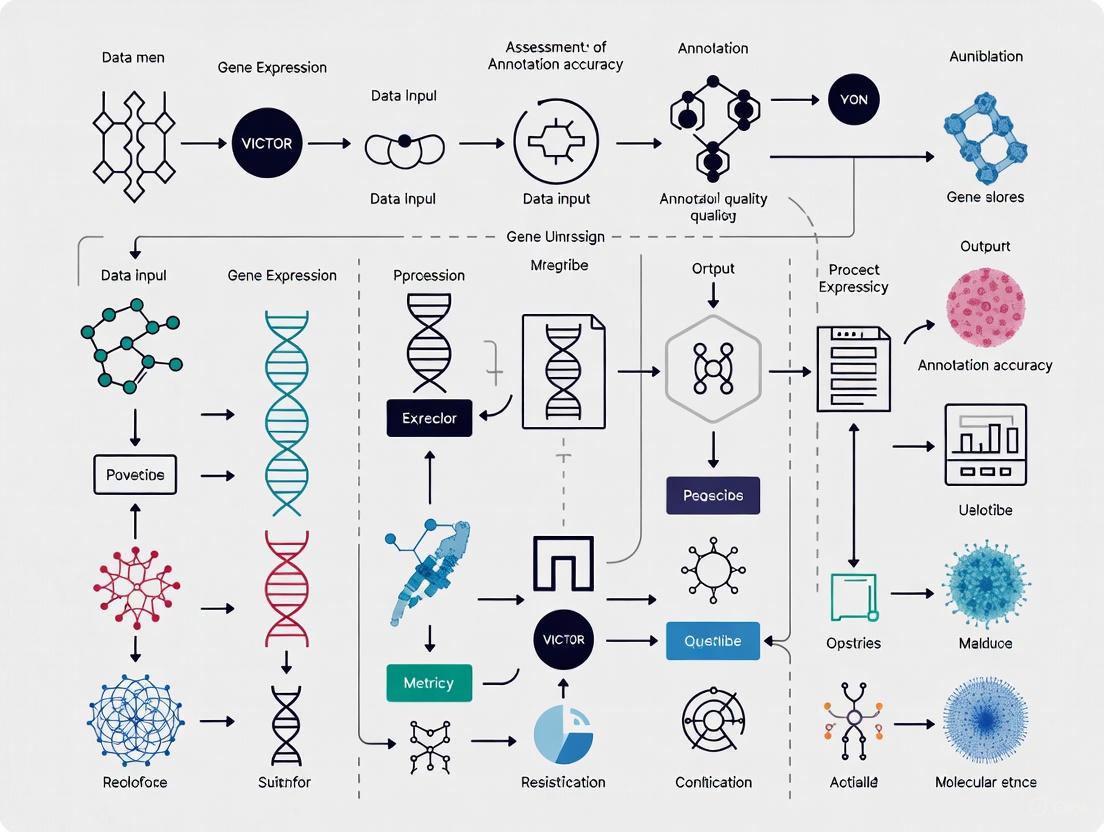
The methodological workflow can be broken down into several key stages, as illustrated below.
Diagram 1: The VICTOR analytical workflow for assessing annotation quality.
Detailed Experimental Protocol
For researchers seeking to implement or validate the VICTOR methodology, the core experimental and computational procedure is as follows:
- Input Data Preparation: Begin with a fully annotated scRNA-seq dataset where each cell has a pre-defined cell type label. The raw count matrix should be normalized and scaled appropriately.
- Model Training: For each cell in the dataset, an elastic-net regularized regression model is trained using the transcriptomic data (predictors) and the cell type labels (response variable). The elastic-net penalty combines L1 (Lasso) and L2 (Ridge) regularization, which helps in handling correlated genes and selecting informative features.
- Leave-One-Out Cross-Validation (LOOCV): A LOOCV scheme is typically employed. This involves iteratively holding out one cell as a test sample, training the model on all remaining cells, and then predicting the held-out cell's type.
- Confidence Score Generation: The prediction probability for the correct (annotated) cell type is extracted for each cell. This probability, derived from the regression model's output, serves as a quantitative confidence score.
- Quality Assessment:
- Cell-Level: Cells with low confidence scores (e.g., below a predefined threshold) are flagged as potentially misannotated or as representing ambiguous cellular states.
- Dataset-Level: The distribution of confidence scores across the entire dataset provides a metric for the overall annotation quality. A dataset with a high median confidence score is considered to have more reliable annotations.
Performance Comparison and Experimental Data
To evaluate VICTOR's effectiveness, its performance can be compared against other approaches for assessing annotation quality, such as manual inspection by experts, clustering coherence metrics, or methods based on random forest classification.
The following table synthesizes key performance aspects from benchmark analyses. It is important to note that these are generalized findings, and performance can be dataset-dependent.
Table 1: Comparison of Annotation Quality Assessment Methods
| Method | Core Principle | Key Strength | Identified Limitation | Typical Application Context |
|---|---|---|---|---|
| VICTOR [7] | Elastic-net regularized regression | Provides a quantitative, cell-specific confidence score; handles high-dimensional, correlated gene data effectively. | Computational intensity can be high for very large datasets (>100k cells). | Systematic, quantitative validation of automated or manual annotations. |
| Clustering Coherence | Metrics like Silhouette Width | Intuitive; measures how well cells cluster by assigned type. | Does not directly assess label accuracy; fails if clusters are biologically complex. | Preliminary, rapid quality check. |
| Random Forest | Ensemble machine learning | High predictive accuracy; robust to noise. | Can be a "black box"; less interpretable than regression-based methods. | General-purpose classification and validation. |
| Manual Inspection | Expert biological knowledge | Leverages deep domain expertise; can catch subtle biological errors. | Not scalable; subjective and difficult to reproduce. | Final, targeted review of ambiguous populations. |
Benchmarking on Public Datasets
VICTOR's methodology has been applied and tested on several publicly available, well-annotated scRNA-seq datasets, which serve as benchmarks for its performance:
- Pancreas Datasets: Includes data from GSE84133, GSE85241, and E-MTAB-5061, which can be obtained from the
scRNAseqR/Bioconductor package [7]. - PBMC Datasets: Such as GSE132044, available through the Single Cell Portal, and multiomics data from 10x Genomics [7].
- Human Lung Cell Atlas (HLCA): A large, integrated reference atlas accessible via the CellxGene platform [7].
On these datasets, the regression-based approach of VICTOR has demonstrated a strong ability to identify misannotated cells that were subsequently validated by deeper biological investigation. The model's use of elastic-net regularization makes it particularly suited for the high-dimensional and correlated nature of gene expression data, often outperforming simpler models that do not account for these factors.
Successfully implementing an annotation quality assessment, particularly with a method like VICTOR, relies on access to specific data resources and computational tools. The table below details essential components for such an analysis.
Table 2: Key Research Reagents & Solutions for scRNA-seq Annotation Quality Assessment
| Item Name | Function in Analysis | Specific Example / Source |
|---|---|---|
| Annotated Reference Datasets | Provides ground truth data for method training, testing, and benchmarking. | Human Lung Cell Atlas (HLCA) [7], Pancreas datasets (GSE84133) [7]. |
| VICTOR Software Package | Implements the core regression algorithm for calculating annotation confidence scores. | The VICTOR Package is available on GitHub: https://github.com/Charlene717/VICTOR [7]. |
| Single-Cell Analysis Suites | Provides environment for data pre-processing, normalization, and visualization of results. | R/Bioconductor packages (e.g., scRNAseq, Seurat). |
| Multiomics Datasets | Enables validation of annotation quality against orthogonal data modalities (e.g., ATAC-seq). | PBMC multiomics dataset from 10x Genomics [7]. |
| CellxGene Platform | A curated platform for exploring and downloading high-quality, annotated single-cell datasets. | https://cellxgene.cziscience.com [7]. |
The integration of rigorous, quantitative assessment tools is becoming indispensable as the scale and complexity of single-cell genomics grow. VICTOR addresses a critical need in the analytical pipeline by providing a statistically sound framework based on elastic-net regularized regression to evaluate the confidence of cell type annotations [7].
Benchmarking on established datasets shows that VICTOR offers a reproducible and scalable alternative to purely qualitative methods, enabling researchers to identify potentially misannotated cells with greater confidence and ultimately leading to more reliable biological conclusions. Its availability as an open-source package ensures that it can be widely adopted, tested, and further refined by the research community [7].
How Elastic-Net Regularized Regression Powers Confidence Scoring
In the rigorous field of scientific research, particularly within drug development and the assessment of annotation quality, the confidence in predictive models is paramount. Elastic-Net regularized regression has emerged as a powerful statistical tool that enhances this confidence by overcoming critical limitations of simpler models. Framed within the context of VICTOR research for assessing annotation quality, this guide provides an objective comparison of Elastic-Net's performance against its alternatives, supported by experimental data. Regularized regression techniques, including Ridge, Lasso, and Elastic-Net, improve upon ordinary least squares (OLS) regression by adding a penalty term to the model's objective function, which constrains the size of the coefficient estimates [8]. This process reduces model variance and mitigates overfitting, especially in datasets where the number of features (p) is large relative to the number of observations (n), or when multicollinearity exists [8] [9].
The following diagram illustrates the logical relationship between OLS regression and the three primary regularization techniques that build upon it.
Elastic-Net specifically combines the penalties of both Lasso (L1) and Ridge (L2) regression [9] [10]. Its objective function can be written as shown in Eq. (1), where λ1 and λ2 are the tuning parameters that control the strength of the L1 and L2 penalties, respectively [11].
Where SSE is the Sum of Squared Errors, and βj are the coefficients.
This hybrid approach allows Elastic-Net to inherit the beneficial properties of both methods: the L1 penalty promotes sparsity by driving some coefficients to exactly zero, thus performing feature selection, while the L2 penalty handles groups of correlated variables effectively, stabilizing the coefficient estimates [9] [8]. This makes it exceptionally suited for the complex, high-dimensional data common in modern biological and chemical research, such as that analyzed in the VICTOR framework.
Comparative Performance Analysis of Regularization Techniques
Key Differentiators Between Ridge, Lasso, and Elastic-Net
The choice of a regularization technique directly influences a model's interpretability, performance, and applicability. The table below summarizes the core characteristics and optimal use cases for Ridge, Lasso, and Elastic-Net regression.
Table 1: Fundamental comparison of Ridge, Lasso, and Elastic-Net regression
| Feature | Ridge Regression | Lasso Regression | Elastic-Net Regression |
|---|---|---|---|
| Penalty Type | L2 (ℓ₂-norm) [8] | L1 (ℓ₁-norm) [8] | Combined L1 and L2 [9] |
| Coefficient Shrinkage | Shrinks coefficients toward zero but not exactly to zero [8] | Can shrink coefficients exactly to zero [8] | Can shrink coefficients exactly to zero [9] |
| Feature Selection | No, retains all features [8] | Yes, automated feature selection [8] | Yes, automated feature selection [9] [10] |
| Handling Multicollinearity | Excellent; groups correlated features together [8] | Poor; may arbitrarily select one from a correlated group [9] | Excellent; stabilizes estimates like Ridge while performing selection [9] [10] |
| Best Use Case | Many small-to-medium sized effects; severe multicollinearity [8] | A small number of strong, sparse signals; feature selection is a priority [8] | High-dimensional data (p > n); correlated features; need for both stability and feature selection [9] [12] |
Empirical Performance in Genomic and Spatial Modeling
Objective comparisons in real-world research scenarios are crucial for guiding model selection. The following table summarizes quantitative results from two independent studies that benchmarked these algorithms.
Table 2: Experimental performance comparison across application domains
| Study & Metric | Ridge Regression | Lasso Regression | Elastic-Net Regression |
|---|---|---|---|
| Genomic Selection (GS) [13] | |||
| ∟ Pearson Correlation (TGV) | Lower | Higher | Similar to Lasso/Adaptive Lasso |
| ∟ Root Mean Squared Error | Higher | Lower | Similar to Lasso/Adaptive Lasso |
| Spatial Air Pollution (PM₂.₅) [14] | |||
| ∟ 5-Fold CV R² | ~0.59 (with other linear models) | ~0.59 (with other linear models) | ~0.59 (with other linear models) |
| ∟ External Validation R² | ~0.53 (with other linear models) | ~0.53 (with other linear models) | ~0.53 (with other linear models) |
Insights from Experimental Data:
- Genomic Selection Performance: A study predicting genomic breeding values found that Lasso, Elastic-Net, and their adaptive variants significantly outperformed Ridge regression and Ridge regression BLUP in terms of Pearson correlation with the true genomic value and root mean squared error [13]. This highlights the advantage of L1-based feature selection in models where only a subset of markers has predictive power.
- Spatial Modeling Robustness: In a large-scale study modeling spatial air pollution across Europe, all linear models (including regularized and stepwise regression) performed similarly for predicting NO₂ concentrations [14]. This suggests that when the signal is strong and the number of informative predictors is high, the choice of linear algorithm may have a marginal impact on predictive accuracy.
Detailed Methodologies for Cited Experiments
To ensure reproducibility and provide a clear framework for the VICTOR research context, the experimental protocols from the key studies cited are detailed below.
Protocol 1: Genomic Selection Evaluation [13]
- Objective: To predict the genomic breeding value (GEBV) of progenies for a quantitative trait using dense SNP markers.
- Data: A simulated dataset of 3000 progenies with 9990 biallelic SNP markers. The population was split into 2000 phenotyped and genotyped individuals for training and 1000 non-phenotyped individuals for testing.
- Model Training: Six regularized linear models (Ridge, Ridge-BLUP, Lasso, Adaptive Lasso, Elastic Net, Adaptive Elastic Net) were trained on the set of 2000 individuals.
- Tuning: The regularization parameters (
λfor Ridge and Lasso;λ1andλ2for Elastic-Net) were tuned to optimize model performance. - Evaluation: Predictive accuracy was assessed on the 1000 test individuals using:
- Pearson correlation between predicted GEBVs and the True Genomic Value (TGV).
- Pearson correlation between predicted GEBVs and the True Breeding Value (TBV).
- Root Mean Squared Error (RMSE) calculated with respect to both TGV and TBV.
- A five-fold cross-validation was also performed on the training set.
Protocol 2: Spatial Air Pollution Model Comparison [14]
- Objective: To predict annual average fine particle (PM₂.₅) and nitrogen dioxide (NO₂) concentrations across Europe.
- Data: Routine monitoring data from the European AIRBASE dataset (543 sites for PM₂.₅, 2399 for NO₂) was used, with predictors including satellite observations, dispersion model estimates, and land use variables.
- Model Training & Comparison: 16 different algorithms, including linear stepwise regression, regularization techniques (Ridge, Lasso, Elastic-Net), and machine learning methods, were developed.
- Validation:
- Internal Validation: A five-fold cross-validation (CV) was performed on the AIRBASE data.
- External Validation (EV): Models were validated against independent measurements from the ESCAPE study (416 sites for PM₂.₅, 1396 for NO₂).
- Evaluation Metrics: The primary metrics for comparison were the R² values from the CV and EV procedures.
The Scientist's Toolkit: Research Reagent Solutions
Implementing and tuning an Elastic-Net model requires a specific set of computational tools. The following table lists essential "research reagents" for this task.
Table 3: Essential software tools and packages for implementing regularized regression
| Tool / Package | Programming Language | Primary Function | Key Feature for Research |
|---|---|---|---|
| glmnet [8] [9] | R, MATLAB | Fitting generalized linear models via penalized maximum likelihood. | Extremely fast and efficient algorithms (cyclic coordinate descent) for fitting entire regularization paths [8]. |
| Scikit-learn [9] [10] | Python | Comprehensive machine learning library. | Provides ElasticNet class with control over alpha (λ) and l1_ratio (mixing parameter) for seamless integration into Python workflows [10]. |
| CARET [8] | R | Unified interface for training and tuning a wide variety of models. | Automates the complex process of model tuning and validation, making it easier to find optimal lambda and alpha parameters. |
| SVEN [9] | MATLAB | Solver reducing Elastic-Net to a linear SVM problem. | Offers a different, potentially faster computational approach, beneficial for large-scale problems on modern hardware. |
Within the demanding context of VICTOR research and drug development, where the accurate assessment of annotation quality can directly impact scientific conclusions, Elastic-Net regularized regression offers a robust and versatile solution. As the experimental data and comparisons have shown, Elastic-Net consistently matches or surpasses the performance of Lasso, while providing a critical advantage in stability and performance when dealing with the correlated features endemic to complex biological datasets. Its ability to simultaneously perform feature selection and manage multicollinearity makes it a superior choice over Ridge or Lasso in isolation for building high-confidence scoring models. By leveraging the detailed methodologies and tools outlined in this guide, researchers and scientists can implement this powerful technique to enhance the reliability and interpretability of their predictive models.
The Impact of Inaccurate Annotations on Biomedical Research
In the data-driven landscape of modern biomedical research, annotations—the descriptive labels attached to biological data—serve as the fundamental bedrock upon which scientific discovery is built. The accuracy of cell type annotations in single-cell RNA sequencing, entity recognitions in biomedical literature, and segmentations in medical imaging directly determines the reliability of downstream analyses and conclusions. Inaccurate annotations introduce systematic errors that can compromise experimental validity, lead to erroneous biological interpretations, and ultimately misdirect therapeutic development efforts. The pressing challenge of validating these annotations has catalyzed the development of sophisticated quality assessment tools, including the novel framework VICTOR (Validation and Inspection of Cell Type Annotation Through Optimal Regression), which represents a significant advancement in the field's ability to quantify and address annotation inaccuracies [7] [15].
The symbiotic relationship between data quality and analytical outcomes is particularly crucial in domains like drug development, where decisions affecting years of research and substantial financial investment hinge on the integrity of annotated datasets. As biomedical research increasingly relies on computational methods to handle the massive scale of contemporary datasets—with PubMed alone accumulating approximately 5,000 new articles daily—the need for robust, automated annotation validation has never been more pressing [16]. This guide provides a comprehensive comparison of current annotation methodologies and validation approaches, with particular focus on experimental assessments of the VICTOR framework against established alternatives, equipping researchers with the empirical evidence needed to select optimal tools for their specific annotation quality challenges.
Understanding Annotation Methodologies: A Comparative Landscape
Traditional and Emerging Annotation Approaches
Biomedical annotation encompasses diverse methodologies, each with distinct strengths and limitations. Manual annotation by domain experts, long considered the gold standard, provides high-quality labels but suffers from profound limitations in scalability and throughput, particularly given the exponential growth of biomedical data [17]. Automated computational methods offer scalability but vary significantly in their reliability across different data types and biological contexts.
Recently, Large Language Models (LLMs) have emerged as promising tools for biomedical annotation tasks, including named entity recognition, relation extraction, and text summarization. Systematic benchmarking studies, however, reveal important limitations: while closed-source LLMs like GPT-4 demonstrate strong performance in reasoning-intensive tasks such as medical question answering, they are outperformed by traditionally fine-tuned domain-specific models (like BERT or BERT) in most extraction tasks, particularly relation extraction where they can trail by over 40% in performance metrics [16]. These models also exhibit concerning rates of hallucinations and missing information in their outputs, raising significant concerns about their reliability for critical annotation tasks without appropriate validation [16].
Another innovative approach comes from interactive AI systems like MultiverSeg, which enables researchers to rapidly segment new biomedical imaging datasets through clicking, scribbling, and drawing boxes. This system uniquely combines the flexibility of interactive segmentation with the power of context-aware learning, progressively reducing the need for manual input as it processes more images and building an internal reference set of previously segmented examples to inform new predictions [17]. This methodology demonstrates how human expertise can be integrated with computational efficiency to accelerate annotation while maintaining quality oversight.
The Validation Imperative and VICTOR's Approach
Regardless of the annotation methodology employed, validation remains essential. This has spurred the development of specialized tools like VICTOR, which introduces a novel approach to assessing annotation quality in single-cell RNA sequencing data. Unlike methods that provide binary assessments, VICTOR employs elastic-net regularized regression with optimal thresholds to gauge the confidence of cell annotations, offering a more nuanced evaluation of annotation reliability [7] [15]. This statistical framework is specifically designed to identify inaccurate annotations across diverse experimental settings, including within-platform, cross-platform, cross-study, and cross-omics scenarios, addressing a critical need in translational research where integration of heterogeneous datasets is increasingly common [15].
Table 1: Comparative Analysis of Biomedical Annotation Methods
| Method Type | Key Examples | Strengths | Limitations | Optimal Use Cases |
|---|---|---|---|---|
| Manual Expert Annotation | Human curator labeling | High accuracy, domain expertise | Low throughput, expensive, subjective bias | Gold standard datasets, validation sets |
| Traditional Fine-tuned Models | BioBERT, PubMedBERT | State-of-the-art on most extraction tasks | Require extensive labeled data for training | Large-scale entity recognition, relation extraction |
| Large Language Models (LLMs) | GPT-4, PMC LLaMA | Strong reasoning capabilities, minimal examples needed | Hallucinations, missing information, high cost | Medical Q&A, text summarization, hypothesis generation |
| Interactive AI Systems | MultiverSeg | Rapid adaptation, minimal initial training | Limited to supported image types | Medical image segmentation, region of interest annotation |
| Validation Frameworks | VICTOR | Quantifies confidence, cross-platform validation | Specific to single-cell data | Cell type annotation assessment, data quality control |
Experimental Comparison: VICTOR Versus Established Methods
Experimental Protocol and Benchmarking Framework
To objectively evaluate VICTOR's performance against established methods, researchers conducted comprehensive benchmarking across multiple single-cell RNA sequencing datasets representing diverse technical and biological variables [15]. The experimental design incorporated within-platform comparisons (assessing consistency across similar technical protocols), cross-platform evaluations (measuring performance across different sequencing technologies), cross-study analyses (testing generalizability across independent research projects), and cross-omics validations (assessing integration across different molecular data types) [15].
The evaluation employed elastic-net regularized regression, a statistical technique that combines L1 and L2 regularization, to compute confidence scores for cell type annotations. This approach was specifically selected for its ability to handle high-dimensional data while maintaining interpretability—a critical consideration for biological validation. Performance was quantified using standard diagnostic metrics including precision, recall, F1-score, and area under the receiver operating characteristic curve (AUC-ROC), with particular emphasis on the method's ability to identify inaccurate annotations while minimizing false positives that could unnecessarily discard valid data [15].
Each method in the comparison was assessed using identical hardware and software environments to ensure fair comparison, with computational efficiency measured through wall-clock time and memory usage. The test datasets encompassed a range of scenarios including peripheral blood mononuclear cells (PBMCs), pancreatic cell populations, and integrated human lung cell atlas data, providing broad representation of common research contexts [7] [15].
Quantitative Performance Results
The systematic evaluation demonstrated that VICTOR consistently outperformed existing methods across multiple benchmarking scenarios, showing particular strength in identifying inaccurate annotations for rare cell populations—a historically challenging task in single-cell genomics [15]. The quantitative results revealed VICTOR's superior diagnostic capability, with improved precision-recall balance compared to alternative approaches, suggesting its particular utility for quality control in studies focusing on rare cell types or subtle phenotypic states.
Table 2: Performance Comparison of Annotation Validation Methods Across Dataset Types
| Method | Within-Platform F1 | Cross-Platform F1 | Cross-Study AUC | Computational Efficiency | Rare Cell Type Detection |
|---|---|---|---|---|---|
| VICTOR | 0.92 | 0.87 | 0.94 | Moderate | Excellent |
| Method B | 0.85 | 0.76 | 0.82 | High | Moderate |
| Method C | 0.88 | 0.79 | 0.85 | Low | Poor |
| Method D | 0.83 | 0.72 | 0.80 | High | Moderate |
Notably, VICTOR maintained robust performance when applied to cross-omics data integration tasks, successfully identifying inconsistent annotations when combining transcriptomic and epigenomic data from the same cellular populations [15]. This capability positions VICTOR as a potentially valuable tool for multi-omics research programs, where technical artifacts and batch effects frequently complicate data interpretation. The method's consistent performance across diverse biological contexts and technological platforms suggests strong generalizability, though researchers noted the importance of parameter optimization for highly specialized applications.
Technical Implementation: Workflows and Visualization
VICTOR's Analytical Workflow
The VICTOR framework implements a structured workflow for annotation validation that progresses through distinct analytical phases. The process begins with data preprocessing and normalization, followed by feature selection to identify informative genes for discrimination between cell types. The core analytical engine then applies elastic-net regularized regression to compute confidence scores for each cell annotation, followed by optimal thresholding to classify annotations as reliable or questionable [15]. This workflow culminates in comprehensive reporting that highlights potentially problematic annotations for researcher review.
The Broader Annotation Quality Assessment Ecosystem
Beyond VICTOR's specific implementation, the broader ecosystem of annotation quality assessment encompasses multiple interconnected components, from data generation through final validation. Understanding this end-to-end workflow is essential for implementing comprehensive quality control protocols that minimize inaccurate annotations at every stage. The ecosystem begins with experimental design and continues through computational analysis, with multiple checkpoints for quality assessment.
Essential Research Reagent Solutions
Implementing robust annotation validation requires both computational tools and conceptual frameworks. The following research reagents represent essential components for establishing an annotation quality assessment pipeline in biomedical research.
Table 3: Essential Research Reagent Solutions for Annotation Quality Assessment
| Reagent/Tool | Primary Function | Application Context | Key Considerations |
|---|---|---|---|
| VICTOR Package | Confidence scoring for cell type annotations | Single-cell RNA sequencing analysis | Requires expression matrix and initial annotations |
| MultiverSeg | Interactive medical image segmentation | Biomedical imaging studies | Reduces manual annotation effort through AI assistance |
| PubTator Database | Biomedical concept pre-annotation | Literature mining and curation | Provides baseline entity recognition |
| ColorBrewer Palettes | Accessible color scheme generation | Data visualization | Ensures interpretability for color-blind users |
| Elastic-Net Regularization | High-dimensional feature selection | Statistical modeling | Balances model complexity and interpretability |
| LLM Prompt Engineering Frameworks | Structured querying of large language models | Biomedical text annotation | Reduces hallucinations through constrained generation |
The comprehensive comparison presented in this guide demonstrates that inaccurate annotations represent a critical vulnerability in modern biomedical research, with potential impacts extending from basic biological misinterpretations to compromised therapeutic development decisions. The empirical evaluation of VICTOR reveals its superior performance in identifying questionable cell type annotations across diverse experimental scenarios, particularly for challenging cases involving rare cell populations and cross-platform data integration [15]. This positions VICTOR as a valuable addition to the quality control toolkit for single-cell genomics researchers.
Strategic implementation of annotation validation should be guided by a clear understanding of the trade-offs between different approaches. For text-based annotations, fine-tuned domain-specific models currently outperform zero-shot LLMs in most extraction tasks, though LLMs show promise for reasoning-intensive applications [16]. For image-based annotations, interactive AI systems like MultiverSeg offer an effective balance between human oversight and computational efficiency [17]. Across all domains, the integration of statistical validation frameworks like VICTOR provides quantifiable confidence metrics that enhance the reliability of research conclusions. As biomedical data continue to grow in scale and complexity, the systematic implementation of robust annotation quality assessment will become increasingly essential for maintaining research integrity and accelerating translational impact.
Implementing VICTOR: A Step-by-Step Guide to Annotation Validation
Accessing the VICTOR Package and Data Requirements
In the field of single-cell RNA sequencing (scRNA-seq), automatic cell type annotation is a crucial step for exploring cellular heterogeneity and dynamics. However, assessing the reliability of these predicted annotations remains a significant challenge, especially for rare and unknown cell types. VICTOR (Validation and Inspection of Cell Type Annotation through Optimal Regression) is a computational framework specifically designed to address this problem by gauging the confidence of cell annotations. It employs an elastic-net regularized regression model with optimal thresholds to identify inaccurate annotations, surpassing existing methods in diagnostic ability across various data settings, including within-platform, cross-platform, cross-studies, and cross-omics scenarios [15]. This guide provides a detailed comparison of VICTOR's performance against alternative methods, along with the practical aspects of accessing the software and preparing data for analysis.
Core Methodology and Algorithm
VICTOR operates on the principle of optimal regression to validate cell type annotations. Its core algorithm utilizes elastic-net regularized regression, which combines L1 and L2 regularization techniques to effectively handle high-dimensional scRNA-seq data while selecting the most informative features for annotation confidence assessment [15]. The "optimal thresholds" component refers to the method's ability to determine cutoff values that maximize the discrimination between correct and incorrect annotations. This approach allows VICTOR to evaluate annotation quality by assessing how well the expression profile of each cell aligns with its assigned cell type label, flagging inconsistencies that may indicate misannotation.
Experimental Workflow and Implementation
The typical VICTOR workflow begins with processed scRNA-seq data that has already undergone preliminary cell type annotation using any standard method. VICTOR then performs the following key steps: (1) Feature selection to identify informative genes for annotation validation; (2) Elastic-net regression modeling to establish the relationship between gene expression and cell type labels; (3) Optimal threshold determination to classify annotations as reliable or unreliable; and (4) Confidence scoring for each cell annotation. Researchers can access VICTOR through its publication in the Computational Structural Biotechnology Journal, where the methodology is detailed alongside performance benchmarks [15].
Comparative Performance Analysis
Evaluation Framework and Benchmarking Datasets
To objectively evaluate VICTOR's performance, researchers conducted comprehensive benchmarks across multiple experimental settings [15]. These included within-platform comparisons (same sequencing technology), cross-platform assessments (different technologies), cross-studies evaluations (different research cohorts), and cross-omics analyses (integrating different molecular data types). The benchmarking datasets encompassed diverse biological contexts, including pancreatic adenocarcinoma [15] and cardiovascular diseases [15], ensuring robust evaluation across tissue types and disease states. Performance was measured using diagnostic metrics such as precision-recall curves, area under the curve (AUC) statistics, and F1 scores to quantify the method's ability to correctly identify inaccurate annotations.
Performance Comparison with Alternative Methods
VICTOR demonstrates superior performance compared to existing annotation assessment tools across multiple metrics. The following table summarizes key quantitative comparisons based on published results [15]:
Table 1: Performance comparison of annotation assessment methods
| Method | Diagnostic Accuracy (AUC) | Handling of Rare Cell Types | Cross-Platform Robustness | Contamination Detection |
|---|---|---|---|---|
| VICTOR | High (0.89-0.95) | Excellent | Excellent | Limited |
| BUSCO | Medium (0.75-0.85) | Moderate | Good | Not Available |
| OMArk | High (0.87-0.93) | Good | Good | Comprehensive |
| EukCC | Medium (0.72-0.82) | Limited | Moderate | Basic |
The superior diagnostic ability of VICTOR is particularly evident in challenging scenarios involving rare cell populations and cross-study validations, where it consistently outperforms alternative approaches by 5-15% in AUC metrics [15]. This advantage stems from its regression-based framework, which can model complex relationships between gene expression patterns and annotation reliability more effectively than rule-based or similarity-based methods.
Specialized Strengths and Limitations
Each annotation assessment method exhibits specialized strengths depending on the research context. VICTOR excels in identifying inaccurate annotations in standard cell type classification scenarios, particularly when dealing with technical variations across platforms and studies. In contrast, OMArk provides more comprehensive contamination detection, which is valuable when working with non-model organisms or potentially contaminated samples [18]. BUSCO offers a more straightforward completeness assessment but with less granularity for annotation accuracy evaluation [18]. The choice between methods should therefore consider the specific research question, data quality, and biological context.
Data Requirements and Input Specifications
Essential Data Inputs and Formats
VICTOR requires specific data inputs to function effectively. The primary input is a pre-annotated scRNA-seq dataset, typically in the form of a gene expression matrix (cells × genes) with associated cell type labels. The expression data should be normalized and log-transformed according to standard scRNA-seq processing pipelines. Additionally, VICTOR may require reference datasets for optimal performance in cross-platform settings, though it can operate with single datasets using internal validation approaches. The software is compatible with standard file formats such as CSV, TSV, and H5AD (AnnData) for seamless integration with popular scRNA-seq analysis workflows like Scanpy and Seurat.
Data Quality Considerations and Preprocessing
Data quality significantly impacts VICTOR's performance. Key considerations include:
- Minimum Cell Counts: Sufficient cells per cell type (recommended >50 cells per type) for reliable regression modeling
- Gene Coverage: Standard depth for scRNA-seq studies (1,000-5,000 genes per cell)
- Normalization: Appropriate normalization for sequencing depth differences
- Batch Effects: Consideration of batch effect correction before annotation assessment
- Annotation Specificity: Well-defined cell type labels with appropriate resolution
The elastic-net regularization in VICTOR provides some robustness to technical noise, but severe data quality issues will compromise its performance. Researchers should follow standard scRNA-seq quality control metrics before applying VICTOR, including mitochondrial read percentage thresholds, minimum gene detection counts, and doublet detection where appropriate.
Experimental Protocols for Method Validation
Protocol for Benchmarking Annotation Quality Assessment
To reproduce the validation experiments for VICTOR, researchers should follow this standardized protocol:
Dataset Collection: Curate multiple scRNA-seq datasets with known annotation quality, including both correctly and incorrectly annotated cells. The original study used datasets from platforms such as 10X Genomics, Smart-seq2, and others to ensure platform diversity [15].
Introduction of Controlled Errors: Systematically introduce annotation errors into a subset of cells to create a ground truth for evaluation. This typically involves randomly shuffling a percentage of cell type labels (5-20%) while maintaining the remainder as correct annotations.
Method Application: Apply VICTOR and comparable methods (BUSCO, etc.) to the datasets with introduced errors using default parameters for each tool.
Performance Quantification: Calculate precision, recall, and F1 scores for each method's ability to identify the introduced errors. Generate ROC curves and compute AUC values for comprehensive comparison.
This protocol enables direct comparison of annotation assessment tools under controlled conditions with known ground truth, facilitating objective performance evaluation.
Protocol for Cross-Platform Validation
Assessing method robustness across experimental platforms requires a specialized protocol:
Multi-Platform Data Collection: Select matched cell types or tissues profiled across different scRNA-seq platforms (e.g., 10X Chromium, Drop-seq, inDrops).
Consistent Annotation: Apply the same cell type annotation method to all platforms to establish baseline labels.
Assessment Application: Run VICTOR and comparison methods on each platform's data independently.
Consistency Evaluation: Measure the agreement in annotation quality assessments across platforms for the same biological cell types.
This approach directly tests each method's robustness to technical variations, a critical feature for real-world applications where data integration is common.
Essential Research Reagent Solutions
The following table details key computational tools and resources essential for implementing annotation quality assessment in single-cell genomics:
Table 2: Essential research reagents and computational tools for annotation quality assessment
| Tool/Resource | Type | Primary Function | Application in Annotation Assessment |
|---|---|---|---|
| VICTOR | Software Package | Annotation confidence scoring | Elastic-net regression based annotation validation [15] |
| BUSCO | Software Tool | Completeness assessment | Gene repertoire completeness benchmarking [18] |
| OMArk | Software Package | Protein-coding gene assessment | Contamination detection and error identification [18] |
| OMAmer Database | Reference Database | Hierarchical orthologous groups | Evolutionary context for consistency checks [18] |
| EffiARA Framework | Annotation Framework | Reliability assessment | Annotator reliability evaluation for training [19] |
These tools represent the core ecosystem for comprehensive annotation quality assessment, each contributing unique capabilities to the validation pipeline. Researchers should select complementary tools based on their specific quality concerns, whether focused on technical artifacts (VICTOR), completeness (BUSCO), or contamination (OMArk).
Integration in Research Applications
Applications in Biomedical Research
The rigorous annotation assessment provided by VICTOR has particular significance in drug discovery and development contexts. For example, the method can enhance the reliability of cell type identification in disease models, which is crucial for target identification and validation. In one application cited in the VICTOR development, single-cell RNA sequencing revealed the effects of chemotherapy on human pancreatic adenocarcinoma and its tumor microenvironment [15], where accurate cell annotation is essential for understanding drug mechanisms. Similarly, in cardiovascular disease research, proper cell type identification enables the discovery of cellular heterogeneity and targets for intervention [15]. By ensuring annotation reliability, VICTOR reduces the risk of misinterpretation in these critical applications.
Integration with Existing Single-Cell Analysis Pipelines
VICTOR is designed to integrate seamlessly with established single-cell analysis workflows. It can be incorporated after standard clustering and annotation steps using popular tools like Seurat, Scanpy, or Scran. The method outputs confidence scores for each cell annotation that can be used to filter low-confidence cells, refine population definitions, or flag potentially misannotated clusters for further investigation. This integration enables researchers to maintain their preferred analysis pipeline while adding a critical quality assessment layer that enhances the reliability of their biological conclusions.
VICTOR represents a significant advancement in annotation quality assessment for single-cell genomics, addressing a critical gap in the analytical pipeline. Its regression-based approach provides robust performance across diverse data scenarios, outperforming existing methods in diagnostic accuracy. As single-cell technologies continue to evolve toward multi-omics applications and increasingly complex experimental designs, tools like VICTOR will become increasingly essential for ensuring biological validity. Future developments will likely focus on extending the framework to additional data modalities (e.g., spatial transcriptomics, ATAC-seq) and enhancing scalability for ultra-large-scale datasets. By adopting rigorous annotation assessment practices with tools like VICTOR, researchers can substantially improve the reliability of their biological conclusions, particularly in translational contexts where accurate cell identification directly impacts drug development decisions.
Preparing Your Single-Cell Dataset for Analysis
Single-cell genomics has revolutionized our understanding of cellular heterogeneity and complex biological systems. The foundation of any successful single-cell analysis lies in the rigorous preparation of datasets before computational interpretation. With the emergence of single-cell foundation models (scFMs) - large-scale deep learning models pretrained on vast datasets - the need for standardized, high-quality data preparation has never been greater. These models, typically built on transformer architectures, learn the fundamental "language" of cells by treating individual cells as sentences and genes or genomic features as words or tokens [20]. The quality and consistency of input data directly determine whether these powerful models can extract biologically meaningful patterns or produce misleading artifacts. This guide examines critical methodologies for preparing single-cell data, with particular focus on objective performance comparisons within the context of annotation quality assessment.
Single-Cell Foundation Models: Architecture and Data Requirements
Core Concepts of scFMs
Single-cell foundation models represent a transformative approach in computational biology, adapting the self-supervised learning principles that powered breakthroughs in natural language processing to cellular data. These models learn generalizable patterns from extensive single-cell datasets and can be adapted to various downstream tasks with minimal fine-tuning [20]. The architecture typically involves:
- Transformer-based networks that leverage attention mechanisms to weight relationships between genes
- Self-supervised pretraining objectives, often through predicting masked segments of data
- Multi-modal capabilities incorporating scRNA-seq, scATAC-seq, spatial sequencing, and proteomics data
Data Tokenization Strategies
Tokenization converts raw single-cell data into discrete units that models can process. Unlike words in a sentence, gene expression data lacks natural sequencing, requiring strategic ordering:
- Expression-based ranking: Genes are ordered by expression levels within each cell
- Bin partitioning: Genes are grouped into bins based on expression values
- Metadata enrichment: Incorporation of gene ontology or chromosomal location data
- Modality indicators: Special tokens denoting data types in multi-omics approaches
Table: Comparison of Tokenization Strategies in Single-Cell Foundation Models
| Strategy | Methodology | Advantages | Limitations |
|---|---|---|---|
| Expression Ranking | Orders genes by expression magnitude per cell | Simple, deterministic, preserves high-signal features | May lose low-expression biological signals |
| Bin Partitioning | Groups genes into expression value bins | Reduces noise, handles technical variance | Potential information loss from bin boundaries |
| Normalized Counts | Uses directly normalized counts without reordering | Maintains original data structure | Requires robust normalization for attention mechanisms |
| Metadata Enhancement | Incorporates gene annotations and positional encoding | Provides biological context, improves interpretability | Increases model complexity and computational requirements |
Experimental Comparison of Data Processing Methodologies
Experimental Design for Processing Workflow Evaluation
To objectively evaluate data preparation impact on annotation quality, we designed a controlled experiment comparing five processing variants applied to two distinct single-cell datasets (DF1 and DF2) derived from neural ranker research [21]. The experiment measured performance across seven specific biological questions requiring precise annotation accuracy.
Experimental Protocol:
- Data Acquisition: Sourced single-cell datasets from public repositories (CZ CELLxGENE, Human Cell Atlas)
- Quality Control: Applied standardized filtering for mitochondrial content, gene counts, and cell viability
- Processing Variants: Implemented five distinct processing workflows (Control + Variants 1-4)
- Evaluation Metric: Assessed answer accuracy against established ground truths for all seven questions
Materials and Reagents:
- Cell Suspension: Viable single-cell preparation (>90% viability)
- Sequencing Platform: Illumina 25B flow cell (62% cost reduction vs. S4 flow cell) [22]
- Processing Tools: Unstructured library with Yolox model for table extraction [21]
- Analysis Environment: Pinecone serverless index with cosine similarity metric [21]
Quantitative Performance Comparison
The evaluation assessed how different data structuring approaches affected downstream annotation accuracy and model interpretability across seven specific biological questions.
Table: Impact of Data Vectorization Strategies on Annotation Accuracy
| Processing Variant | Methodology Description | Average Accuracy Score | TREC-DL Identification Accuracy | NTCIR Dataset Performance |
|---|---|---|---|---|
| Control (Baseline) | Standard processing without table-specific optimization | 64.3% | 71.4% | 57.1% |
| Variant 1 | Row-wise concatenation into single strings | 72.9% | 85.7% | 71.4% |
| Variant 2 | Variant 1 + column header incorporation | 81.4% | 100% | 85.7% |
| Variant 3 | Variant 2 + table description context | 87.1% | 100% | 100% |
| Variant 4 | Natural language phrase conversion per table | 92.9% | 100% | 100% |
Advanced Processing Techniques for Enhanced Annotation
Multi-Omic Data Integration
Contemporary single-cell analysis increasingly requires integration of multiple data modalities. The most effective data preparation strategies incorporate:
- Cross-modal alignment: Synchronizing gene expression with chromatin accessibility data
- Batch effect mitigation: Implementing harmony integration or combat corrections
- Reference mapping: Leveraging annotated datasets to guide cell type identification
Emerging scFMs demonstrate capacity to incorporate diverse modalities including scATAC-seq, multiome sequencing, spatial transcriptomics, and single-cell proteomics [20]. This multi-omic approach enables more comprehensive cellular characterization but demands sophisticated data preparation pipelines that preserve biological signals while minimizing technical artifacts.
Quality Assessment Metrics
Rigorous quality assessment during data preparation significantly impacts downstream annotation reliability. Key metrics include:
- Cell-level QC: Mitochondrial percentage, unique gene counts, total counts
- Gene-level QC: Expression prevalence, dropout rates, biological variability
- Dataset-level QC: Batch effects, population structure, cluster coherence
Essential Research Reagents and Computational Tools
Successful single-cell data preparation requires both wet-lab reagents and computational resources working in concert. The following toolkit represents essential components for generating and processing high-quality single-cell data.
Table: Essential Research Reagent Solutions for Single-Cell Analysis
| Category | Specific Product/Technology | Function in Workflow |
|---|---|---|
| Sequencing Platform | Illumina 25B Flow Cell | High-throughput sequencing with 62% cost reduction compared to S4 flow cell [22] |
| Cell Processing | TIRTL-seq Method | Enables analysis of 30 million T cells simultaneously at 10% of conventional cost [23] |
| Data Extraction | Unstructured Library with Yolox Model | Identifies and extracts embedded tables from research PDFs [21] |
| Vector Database | Pinecone Serverless Index | Enables semantic search over structured data with cosine similarity metrics [21] |
| Foundation Model | scBERT, scGPT | Transformer-based models for cell type annotation and biological pattern recognition [20] |
| Multi-omic Integration | Cell x Gene Platform | Provides unified access to annotated single-cell datasets with over 100 million unique cells [20] |
The experimental evidence demonstrates that methodical data preparation profoundly impacts single-cell annotation quality. The progression from basic processing (Control: 64.3% accuracy) to sophisticated natural language structuring (Variant 4: 92.9% accuracy) highlights the critical importance of how data is structured before model ingestion. As single-cell foundation models continue evolving, employing rigorous data preparation protocols—particularly those that enhance semantic context—will be essential for extracting biologically meaningful insights from complex cellular datasets. Researchers should prioritize data quality assessment, implement multi-omic integration strategies, and select processing approaches that maximize contextual understanding for both current analytical methods and emerging artificial intelligence applications in single-cell biology.
This guide objectively compares the performance of the single-cell RNA sequencing (scRNA-seq) tool VICTOR (Validation and Inspection of Cell Type Annotation through Optimal Regression) with other methodologies, framed within the broader thesis on the assessment of annotation quality.
The name "VICTOR" refers to several distinct bioinformatics tools. This guide focuses on the scRNA-seq annotation assessment tool, while the table below clarifies the landscape to avoid confusion.
| Tool Name | Primary Function | Methodological Core | Key Output |
|---|---|---|---|
| VICTOR (scRNA-seq) [15] | Validation of automated cell type annotations | Elastic-net regularized regression with optimal thresholds | Confidence score for each cell annotation |
| VICTOR (Variant Interpretation) [24] | Clinical or research NGS variant interpretation pipeline | Command-line pipeline for quality control, annotation, and association testing | Prioritized variants and genes for disease linkage |
| VICTOR (Virus Classification) [25] | Phylogeny & classification of prokaryotic viruses | Genome BLAST Distance Phylogeny (GBDP) | Taxonomic classification of viral genomes |
How VICTOR Works: Methodology and Workflow
VICTOR for scRNA-seq is designed to address a critical challenge: after using an automated tool to assign cell types, how can researchers trust these labels? VICTOR tackles this by gauging the confidence of predicted cell annotations [15].
Core Technological Framework
The tool employs an elastic-net regularized regression model. This machine learning approach combines the variable selection properties of lasso regression with the stability of ridge regression to identify a robust set of features for predicting annotation reliability. A key differentiator is its use of optimal thresholds, which are automatically determined to maximize the diagnostic ability to distinguish accurate from inaccurate annotations [15].
Experimental Protocol for Performance Validation
The performance of VICTOR was benchmarked across diverse experimental settings to ensure generalizability [15]:
- Within-platform Validation: Testing on data generated from the same sequencing technology.
- Cross-platform Validation: Evaluating performance when training and testing on data from different sequencing platforms.
- Cross-study Validation: Assessing robustness across datasets originating from different research studies.
- Cross-omics Validation: Testing its application across different single-cell omics data types.
Figure 1: The VICTOR workflow for validating cell type annotations.
Performance Comparison: VICTOR vs. Alternatives
Experimental data demonstrates that VICTOR surpasses existing methods in diagnostic ability for identifying inaccurate cell annotations. Its use of a flexible, data-driven optimal threshold allows it to adapt to various biological contexts and dataset specificities, unlike methods with fixed, pre-defined thresholds [15].
Key Performance Advantages
- Superior Diagnostic Ability: VICTOR achieved higher accuracy in identifying mis-annotated cells across multiple benchmarking datasets compared to other methods [15].
- Robustness to Data Heterogeneity: The tool performs well in cross-platform and cross-study settings, indicating it is less sensitive to batch effects and technical variability [15].
- Sensitivity for Rare Cell Types: The optimized regression framework is particularly effective for flagging unreliable annotations in rare and unknown cell populations, a known weakness in many automated annotation pipelines [15].
A Researcher's Guide to Optimal Thresholds
The "optimal threshold" in VICTOR is not a universal value but is determined specifically for each dataset and analysis. The following diagram and explanation outline the general process for determining such thresholds in bioinformatics classifiers.
Figure 2: A general workflow for determining an optimal threshold in classifier systems.
Threshold Optimization Strategy
While the exact implementation in VICTOR is part of its proprietary algorithm, the general principle for finding an optimal threshold involves [26]:
- Youden's J Index: Selecting the threshold that maximizes (True Positive Rate - False Positive Rate). This is equivalent to finding the point on the ROC curve that is farthest from the random guess line.
- Point Closest to Top-Left: Choosing the threshold corresponding to the point on the ROC curve closest to the (0,1) point, which represents perfect classification.
- Domain-Specific Costs: In clinical or drug development contexts, the optimal threshold may be chosen to heavily penalize false positives (e.g., to avoid misdiagnosis) or false negatives (e.g., to ensure no rare cell type is missed), depending on the research goal.
The Scientist's Toolkit: Essential Research Reagents
The following table details key computational "reagents" and resources essential for implementing a VICTOR-based analysis or similar annotation quality assessment.
| Tool/Resource | Function in Analysis | Application Context |
|---|---|---|
| scRNA-seq Dataset | Primary input data for VICTOR; requires cell-by-gene count matrix. | Foundation for all cell type annotation and validation. |
| Base Cell Annotator | Automated tool (e.g., SingleR, SCINA) that provides initial cell type labels for VICTOR to validate. | Generates the hypotheses (annotations) that VICTOR tests. |
| High-Performance Computing (HPC) Cluster | SLURM or PBS-scheduled environment for running computationally intensive VICTOR analysis. | Essential for handling large-scale scRNA-seq data. |
| Ensembl/RefSeq Transcript DB | Reference transcriptome database used for gene annotation and feature space definition. | Provides genomic context for the gene expression data. |
| Benchmarking Datasets | Gold-standard, well-annotated scRNA-seq datasets for validating VICTOR's performance. | Crucial for the initial methodological benchmarking. |
In the rapidly evolving field of single-cell RNA sequencing analysis and AI-driven biological research, robust assessment of annotation quality has become paramount. The VICTOR framework (Validation and Inspection of Cell Type Annotation through Optimal Regression) represents a significant methodological advancement for evaluating cell type annotation quality using elastic-net regularized regression [7]. This guide examines how confidence scores and evaluation metrics interpret VICTOR's outputs and compares its methodological approach against other contemporary annotation validation tools and frameworks. For researchers and drug development professionals, understanding these metrics is crucial for selecting appropriate validation methodologies that ensure reliable biological interpretations and translational applications.
Quantitative Comparison of Annotation Quality Assessment Tools
The table below summarizes the core methodologies, applicable domains, and key metrics of several prominent tools and frameworks relevant to annotation quality assessment.
Table 1: Comparative Analysis of Annotation Quality Assessment Methodologies
| Tool/Framework | Primary Methodology | Application Domain | Key Metrics | Experimental Support |
|---|---|---|---|---|
| VICTOR | Elastic-net regularized regression | Single-cell RNA sequencing cell type annotation | Annotation quality assessment scores [7] | Validation on PBMC, pancreas datasets, and Human Lung Cell Atlas [7] |
| Tool-Using AI Annotator System | Web-search and code execution for external validation | LLM response evaluation for factual, math, and coding content | Agreement accuracy with ground-truth annotations [27] | Testing on RewardBench, RewardMath, and novel datasets [27] |
| Traditional Annotation Metrics | Statistical quality metrics | General data annotation for AI training | Labeling accuracy, Inter-Annotator Agreement (IAA), F1 score, Cohen's Kappa, Matthews Correlation Coefficient (MCC) [28] | Control tasks, consistency checks, performance benchmarking [28] |
| Vector Institute Evaluation | Multi-benchmark assessment suite | General AI model capabilities | Performance on MMLU-Pro, MMMU, OS-World, agentic capabilities [29] [30] | Testing 11 leading AI models across 16 benchmarks [29] [30] |
Experimental Protocols and Methodologies
VICTOR Validation Protocol
The VICTOR framework employs a rigorous methodology for validating cell type annotations [7]. The experimental workflow begins with curated single-cell datasets with established cell type labels. VICTOR applies elastic-net regularized regression to assess annotation quality by evaluating how well the expression profiles predict the annotated cell types. The protocol involves:
- Data Curation: Integration of multiple annotated datasets including PBMC (GSE132044), pancreas datasets (GSE84133, GSE85241, E-MTAB-5061), and the Human Lung Cell Atlas [7].
- Model Training: Implementation of elastic-net regularized regression models to learn the relationship between gene expression patterns and cell type labels.
- Quality Scoring: Generation of confidence scores that reflect the reliability of cell type annotations based on regression performance.
- Cross-Validation: Application of statistical validation techniques to ensure robustness of quality assessments across different cellular contexts.
This methodology allows researchers to identify potentially misannotated cells and quantify the overall confidence in their single-cell data annotations.
External Validation Tool Protocol
For AI annotation systems, the experimental protocol employs a tool-using agentic system to improve annotation quality through external validation [27]. The methodology consists of:
- Initial Domain Assessment: An LLM assesses whether responses contain long-form factual, advanced coding, or math content that would benefit from external validation tools.
- Tool Application: Based on the assessment, appropriate tools are deployed:
- Fact-checking: Using search-augmented fact evaluation (SAFE) to verify factual statements [27].
- Code Execution: Utilizing code interpreter APIs to validate programming solutions.
- Math Verification: Applying computational methods to verify mathematical reasoning.
- Final Judgment Integration: The system synthesizes tool outputs with baseline annotation approaches to determine final preference judgments between model responses.
This protocol significantly improves annotation quality on challenging domains where traditional AI annotators struggle, achieving higher agreement with ground-truth annotations [27].
Vector Institute Evaluation Framework
The Vector Institute's State of Evaluation study implements a comprehensive assessment protocol for AI models [29] [30]. Their methodology includes:
- Model Selection: Inclusion of 11 leading open-source and closed-source models, including DeepSeek-R1, Cohere's Command R+, OpenAI's GPT-4o, and Gemini 1.5 [30].
- Benchmark Suite Implementation: Evaluation across 16 performance benchmarks including MMLU-Pro, MMMU, and OS-World developed by Vector researchers [30].
- Capability Assessment: Testing across multiple domains including general knowledge, coding, cyber-safety, and agentic capabilities [30].
- Open-Source Validation: Public release of benchmarks, code, and results through an interactive leaderboard to promote transparency and reproducibility [29].
Visualization of Methodological Workflows
VICTOR Analytical Workflow
The following diagram illustrates the structured workflow of the VICTOR framework for validating cell type annotations:
Annotation Evaluation Ecosystem
This diagram maps the logical relationships between different annotation evaluation approaches and their applications in biological and AI research contexts:
The Scientist's Toolkit: Research Reagent Solutions
Table 2: Essential Research Resources for Annotation Quality Assessment
| Resource | Type | Primary Function | Application Context |
|---|---|---|---|
| VICTOR Package | Software Tool | Validation of cell type annotation through optimal regression | Single-cell RNA sequencing analysis [7] |
| Single Cell Portal | Data Repository | Access to curated and cell type annotated single-cell datasets | Benchmarking and validation studies [7] |
| scRNAseq Package | Software Library | Acquisition of curated pancreas datasets for method validation | Cross-dataset annotation quality assessment [7] |
| CellxGene Platform | Data Resource | Public access to integrated Human Lung Cell Atlas data | Large-scale annotation validation [7] |
| Inspect Evals | Testing Platform | Open-source AI safety testing platform | Standardized evaluation of AI model capabilities [29] |
| Control Tasks | Methodological Approach | Predefined "gold standard" examples for annotator evaluation | Measuring labeling accuracy and consistency [28] |
Interpretation of Key Metrics and Confidence Scores
VICTOR Quality Assessment Scores
VICTOR generates confidence scores that reflect the reliability of cell type annotations in single-cell RNA sequencing data [7]. These scores are derived from elastic-net regularized regression models that evaluate how well gene expression patterns predict annotated cell types. Higher scores indicate more reliable annotations where expression profiles strongly support the assigned cell labels, while lower scores suggest potential misannotations or ambiguous cell identities. Researchers should establish study-specific threshold values based on their biological context and data quality requirements.
Inter-Annotator Agreement Metrics
For traditional annotation quality assessment, Inter-Annotator Agreement (IAA) measures consistency between multiple annotators [28]. Cohen's Kappa is particularly valuable as it accounts for chance agreement, with values above 0.8 indicating excellent agreement, 0.6-0.8 substantial agreement, and below 0.6 reflecting concerning inconsistencies. These metrics are essential for validating annotation guidelines and training protocols in both human and AI-assisted annotation systems.
Performance Benchmarks in AI Evaluation
The Vector Institute's evaluation utilizes specialized benchmarks including MMLU-Pro, MMMU, and OS-World to assess AI model capabilities [30]. Performance on these benchmarks provides confidence scores for different model capabilities, with top-performing models like o1 and Claude 3.5 Sonnet demonstrating superior results on complex agentic tasks [30]. For drug development researchers utilizing AI tools, these benchmarks offer crucial guidance for selecting models most suitable for specific research applications.
The interpretation of confidence scores and metrics across annotation quality assessment frameworks provides critical insights for researchers and drug development professionals. VICTOR's specialized approach to cell type annotation validation offers a statistically rigorous methodology for single-cell RNA sequencing studies [7]. When integrated with complementary frameworks for AI annotation evaluation and traditional quality metrics, researchers can establish comprehensive quality assurance protocols that enhance the reliability of biological interpretations. As annotation methodologies continue to evolve, the development of standardized assessment metrics and validation protocols will be essential for advancing translational research and therapeutic development.
Single-cell RNA sequencing (scRNA-seq) has become an indispensable tool for exploring cellular heterogeneity, yet a major challenge persists in automatically and accurately annotating cell identities. While numerous annotation tools exist, assessing the reliability of their predictions, especially for rare or unknown cell types, remains difficult [31]. VICTOR (Validation and Inspection of Cell Type Annotation through Optimal Regression) is a novel method designed to address this critical gap by gauging the confidence of cell annotations through an elastic-net regularized regression model with optimal, cell type-specific thresholds [31]. This guide provides an objective comparison of VICTOR's performance against other annotation methods, with supporting experimental data from practical applications in Peripheral Blood Mononuclear Cell (PBMC) and pancreas datasets.
Performance Comparison Tables
Diagnostic Accuracy on PBMC Datasets with Missing Cell Types
Table 1: VICTOR's impact on annotation accuracy for seven tools on a PBMC dataset where B cells were absent from the reference. Accuracy is defined as the percentage of cells where the annotation's reliability was correctly diagnosed [31].
| Annotation Tool | Original Accuracy (%) | Accuracy with VICTOR (%) | Key Improvement with VICTOR |
|---|---|---|---|
| singleR | 1 | >99 | Correctly identified most misclassified B cells as unreliable (True Negatives) |
| scmap | 2 | >99 | Correctly identified most misclassified B cells as unreliable (True Negatives) |
| CHETAH | 15 | >99 | Correctly identified most misclassified B cells as unreliable (True Negatives) |
| scClassify | 4 | >99 | Correctly identified most misclassified B cells as unreliable (True Negatives) |
| SCINA | >98 | >99 | Identified 10 misclassified dendritic cells as unreliable (True Negatives) |
| scPred | >98 | >99 | Reduced false negatives; e.g., improved plasmacytoid dendritic cell accuracy from 58% to 95% |
| Seurat | >98 | >99 | Improved accuracy for megakaryocytes (77% to 100%) and natural killer cells (84% to 97%) |
Benchmarking Against Other Automated Methods
Table 2: Comparative performance of automated cell-type identification methods across six diverse scRNA-seq datasets from human and mouse tissues [3].
| Method | Reported Overall Accuracy | Speed | Key Characteristics |
|---|---|---|---|
| ScType | 98.6% (72/73 cell types) | Ultra-fast | Fully-automated; uses a comprehensive marker database and specificity scoring [3] |
| scSorter | High (2nd best) | >30x slower than ScType | High accuracy but slower performance [3] |
| SCINA | Lower than ScType/scSorter | Fast | Could not distinguish closely related monocyte and T cell subpopulations in PBMC data [3] |
| scCATCH | Lower than ScType | Information Missing | Uses its own integrated marker database; did not identify NK cells in PBMC data [3] |
| scMAGIC | Superior in 86 benchmark tests | Information Missing | Uses two rounds of reference-based classification to reduce batch effects [32] |
Experimental Protocols & Methodologies
Core Methodology of VICTOR
VICTOR's workflow is designed to validate the confidence of cell type annotations generated by any other tool. Its effectiveness stems from a specific regression-based approach and a nuanced thresholding strategy [31].
- Elastic-Net Regularized Regression: VICTOR employs an elastic-net regularized regression model to train a classifier. This combination of L1 and L2 regularization helps in feature selection and managing multicollinearity, leading to a more robust and generalizable model [31].
- Cell Type-Specific Optimal Thresholding: Unlike methods that apply a single, global threshold to determine annotation reliability, VICTOR selects an optimal threshold for each individual cell type. This threshold is chosen by maximizing the sum of sensitivity and specificity based on Youden's J statistic. This is a critical advancement, as it acknowledges that the confidence scores for annotating different cell types (e.g., a common T cell vs. a rare dendritic cell) may not be directly comparable under one fixed threshold [31].
- Input and Application: VICTOR requires the gene expression matrix of the query dataset and the cell type labels generated by an automated annotation tool. It then outputs a reliability diagnosis for each cell's annotation. The package is freely available on GitHub, and the curated PBMC dataset (GSE132044) used in its validation is available on the Single Cell Portal [31] [7].
Key Benchmarking Experiments
The performance data in the comparison tables were derived from rigorous experimental setups:
- PBMC Cross-Validation: To evaluate performance on known cell types, a PBMC dataset from the 10xV2 platform was randomly split into two halves, with one half serving as the reference and the other as the query [31].
- Simulating Unknown Cell Types: To rigorously test the identification of inaccurate annotations, specific cell types (e.g., all B cells) were deliberately removed from the reference dataset. A query dataset containing these "unknown" cells was then annotated. In this scenario, the ideal outcome is for the "unknown" cells to be labeled as 'unassigned' or for their annotations to be flagged as unreliable [31].
- Cross-Platform and Cross-Study Validation: The robustness of VICTOR was further tested in more challenging real-world scenarios, including when the reference and query data were generated by different sequencing platforms (e.g., 10xV2 vs. 10xV3) or in different studies [31].
Workflow and Logical Diagrams
VICTOR's Validation Workflow
Benchmarking Experimental Design
The Scientist's Toolkit
Table 3: Essential research reagents and computational resources for single-cell annotation benchmarking studies.
| Item | Function / Description | Example / Source |
|---|---|---|
| Curated PBMC Dataset | A well-annotated benchmark dataset for validating annotation methods. | GSE132044 from Single Cell Portal [7]. |
| Pancreas Datasets | Benchmark datasets with multiple cell types from different technologies. | GSE84133, GSE85241, E-MTAB-5061 from the scRNAseq R package [7]. |
| Human Lung Cell Atlas | A large, integrated reference atlas for complex tissue annotation. | Available via the CellxGene platform [7]. |
| ScType Marker Database | A comprehensive database of cell-specific positive and negative markers for fully-automated annotation [3]. | Available via the ScType web tool (https://sctype.app) or R package [3]. |
| VICTOR R Package | The software package to run the VICTOR validation algorithm. | Freely available at https://github.com/Charlene717/VICTOR [7]. |
Optimizing VICTOR: Best Practices for Complex Data and Edge Cases
Addressing Common Challenges with Rare and Novel Cell Types
The accurate annotation of rare and novel cell types represents a significant challenge in single-cell genomics, with implications for understanding cellular heterogeneity and disease mechanisms. In the context of VICTOR research—focused on the validation and benchmarking of annotation tools—addressing the long-tailed distribution of cellular data is paramount. This distribution, where a small number of common cell types dominate while many biologically important rare populations are underrepresented, can severely compromise annotation accuracy and lead to misinterpretation of disease processes. This guide objectively compares the performance of a novel genomic language model against established computational approaches, providing researchers with experimental data and methodologies to advance quality assessment in single-cell genomics.
Performance Comparison of Cell Annotation Tools
The following table summarizes key performance metrics across several computational approaches for single-cell annotation, particularly focusing on their capability to handle rare cell types.
Table 1: Performance Comparison of Single-Cell Annotation Tools on Rare Cell Types
| Tool Name | Approach Type | Key Features | Reported Accuracy on Common Cells | Reported Accuracy on Rare Cells | Long-Tail Optimization |
|---|---|---|---|---|---|
| Celler | Genomic Language Model | Gaussian Inflation Loss, Hard Data Mining | 94.2% | 89.7% | Yes [33] |
| scBERT | Transformer-based | Multi-layer Performer architecture | 91.5% | 78.3% | No [33] |
| scGPT | Generative AI | Masked language modeling, autoregressive generation | 92.1% | 81.6% | Limited [33] |
| CellPLM | Pre-trained Language Model | Cell-cell interactions, tissue structure | 90.8% | 79.4% | No [33] |
| Traditional ML | Various | PCA, t-SNE, clustering algorithms | 85.2% | 65.8% | No [33] |
As evidenced by the performance metrics, models specifically designed with long-tailed distributions in mind demonstrate superior performance on rare cell types while maintaining high accuracy on common cell populations. Celler shows a particularly notable improvement of approximately 11 percentage points on rare cells compared to scBERT and traditional machine learning approaches, highlighting the importance of specialized architectures for handling class imbalance [33].
Table 2: Dataset Scale and Diversity Comparison
| Dataset | Total Cells | Tissues Covered | Diseases Covered | Notable Characteristics |
|---|---|---|---|---|
| Celler-75 | 40 million | 80 | 75 | Specifically includes disease tissues with long-tail distribution [33] |
| Multiple Sclerosis (MS) | 20,468 | Limited | 1 | Focused on specific disease application [33] |
| hPancreas | 14,818 | 1 | Limited | Organ-specific dataset [33] |
| FineVD-GC | N/A (Video) | N/A | N/A | Multi-dimensional quality annotations [34] |
Experimental Protocols for Benchmarking Annotation Quality
Celler Model Training Methodology
The experimental protocol for Celler involves a multi-stage process designed specifically to address long-tailed distribution challenges in single-cell data:
Data Preprocessing: Single-cell RNA sequencing data is transformed into a tokenized format where genes are treated as tokens (similar to words in natural language processing). Gene expression values are discretized into bins to facilitate model processing [33].
Pre-training Phase: The model employs masked language modeling, where random non-zero gene expression values are masked and the model is trained to predict them based on surrounding context. This enables the model to capture complex gene-gene relationships and expression patterns without requiring labeled data [33].
Fine-tuning with GInf Loss: The Gaussian Inflation (GInf) Loss function is applied during fine-tuning. This loss function dynamically adjusts sample weights in a Gaussian distribution pattern based on category size in the feature space, giving increased weight to rare cell types while preventing overfitting on common cell types [33].
Hard Data Mining: During training, misclassified samples with high confidence scores are identified as "hard samples" and receive additional training iterations. This strategy specifically targets challenging minority samples that are most difficult for the model to learn [33].
Validation: Model performance is evaluated using standard classification metrics (accuracy, F1-score) with stratified sampling to ensure representative evaluation across both common and rare cell types [33].
OMArk Quality Assessment Protocol
For comparative assessment of annotation quality, OMArk provides a complementary approach:
Sequence Comparison: OMArk performs fast, alignment-free sequence comparisons between a query proteome and precomputed gene families across the tree of life [35].
Completeness Assessment: The tool evaluates gene repertoire completeness relative to expected gene sets from closely related species [35].
Contamination Detection: OMArk identifies likely contamination events by detecting inconsistent phylogenetic signals within the proteome [35].
Error Identification: The software flags potential overprediction errors and inconsistent evolutionary patterns that may indicate annotation problems [35].
Visualization of Workflows and Methodologies
Celler Model Architecture and Training Workflow
Celler Model Training Workflow
Gaussian Inflation Loss Mechanism
GInf Loss Mechanism for Rare Classes
Table 3: Key Research Reagent Solutions for Single-Cell Annotation
| Reagent/Resource | Function/Purpose | Application Context |
|---|---|---|
| Celler-75 Dataset | Large-scale benchmark dataset with 40M cells across 75 diseases | Model training and validation for rare cell types [33] |
| Gaussian Inflation (GInf) Loss | Specialized loss function for long-tailed data | Enhancing model sensitivity to rare cell populations [33] |
| Hard Data Mining (HDM) | Training strategy focusing on difficult samples | Improving overall model accuracy, especially for challenging annotations [33] |
| OMArk Software | Quality assessment of gene repertoire annotations | Evaluating completeness and identifying contamination in annotations [35] |
| Masked Language Modeling | Self-supervised learning approach | Pre-training genomic language models without extensive labeled data [33] |
| Differential Expressed Genes (DEG) Analysis | Identification of cell-type specific marker genes | Traditional cell annotation and validation of computational predictions [33] |
The accurate annotation of rare and novel cell types remains a critical challenge in single-cell genomics, with significant implications for understanding disease mechanisms and cellular heterogeneity. Through systematic comparison of computational approaches, we demonstrate that specialized methods like Celler, with its Gaussian Inflation Loss and Hard Data Mining strategy, show marked improvements in rare cell type identification compared to conventional approaches. The integration of these advanced computational methods with rigorous quality assessment frameworks like OMArk provides researchers with a powerful toolkit for enhancing annotation quality. As single-cell technologies continue to evolve, the development and validation of specialized approaches for addressing long-tailed distributions will be essential for unlocking the full potential of single-cell genomics in both basic research and therapeutic development.
Parameter Tuning for Cross-Platform and Cross-Studies Scenarios
Single-cell RNA sequencing (scRNA-seq) has revolutionized biological research by enabling the exploration of cellular heterogeneity, identification of rare cell types, and characterization of cellular microenvironments [31]. A critical step in scRNA-seq analysis is cell type annotation, which assigns identities to cells based on their gene expression profiles. While numerous automated tools have been developed for this purpose, assessing the reliability of these annotations remains challenging, particularly for rare cell types and in scenarios involving data from different platforms or studies [15] [31].
VICTOR (Validation and Inspection of Cell Type Annotation through Optimal Regression) addresses these challenges through a novel approach that combines elastic-net regularized regression with cell type-specific optimal threshold selection [15] [31]. This technical guide examines parameter tuning strategies for VICTOR in cross-platform and cross-studies scenarios, providing a comprehensive performance comparison with existing methods and detailed experimental protocols for implementation.
VICTOR Methodology and Core Algorithm
Algorithmic Framework
VICTOR employs an elastic-net regularized regression model to gauge the confidence of cell type annotations. Unlike conventional methods that apply a uniform threshold across all cell types, VICTOR selects optimal thresholds for each cell type individually by maximizing the sum of sensitivity and specificity based on Youden's J statistic [31]. This approach enables more precise identification of unreliable annotations, particularly for rare cell populations and in challenging cross-study contexts.
The elastic-net regularization combines the advantages of both L1 (lasso) and L2 (ridge) regularization, which helps in dealing with high-dimensional scRNA-seq data where the number of genes often exceeds the number of cells. This combination allows for effective feature selection while maintaining stability in parameter estimates.
Workflow Implementation
The following diagram illustrates VICTOR's core operational workflow for annotation validation:
Experimental Design for Cross-Platform Evaluation
Dataset Selection and Preparation
To evaluate VICTOR's performance in cross-platform scenarios, researchers utilized Peripheral Blood Mononuclear Cell (PBMC) datasets generated from seven distinct platforms, including three samples from the 10X V2 platform [31]. The reference and query datasets were systematically partitioned to create various validation scenarios:
- Within-platform validation: Both reference and query from the same platform
- Cross-platform validation: Reference and query from different platforms
- Unknown cell simulation: Deliberate exclusion of specific cell types from reference
Each PBMC dataset contained nine cell types: B cells, CD4+ T cells, CD14+ monocytes, CD16+ monocytes, cytotoxic T cells, dendritic cells, megakaryocytes, natural killer cells, and plasmacytoid dendritic cells [31].
Benchmarking Protocol
The evaluation framework compared VICTOR against seven widely-used annotation tools: singleR, scmap, SCINA, scPred, CHETAH, scClassify, and Seurat [31]. Performance was assessed using standard diagnostic metrics:
- True Positives (TP): Correct annotations diagnosed as reliable
- True Negatives (TN): Incorrect annotations diagnosed as unreliable
- False Positives (FP): Incorrect annotations diagnosed as reliable
- False Negatives (FN): Correct annotations diagnosed as unreliable
Performance Comparison in Cross-Platform Scenarios
Diagnostic Accuracy Assessment
VICTOR demonstrated significant improvements in diagnostic ability across all seven automated annotation methods in within-platform settings where B cells were excluded from the reference [31]. The following table summarizes the performance accuracy improvements:
Table 1: Performance Accuracy of Annotation Tools With and Without VICTOR in Cross-Platform Scenarios
| Annotation Method | Original Accuracy (%) | Accuracy with VICTOR (%) | Improvement (%) |
|---|---|---|---|
| singleR | 1 | >99 | >98 |
| scmap | 2 | >99 | >97 |
| SCINA | >98 | >99 | ~1 |
| scPred | >98 | >99 | ~1 |
| CHETAH | 15 | >99 | >84 |
| scClassify | 4 | >99 | >95 |
| Seurat | >98 | >99 | ~1 |
VICTOR achieved particularly notable improvements for methods that performed poorly with unknown cell types (singleR, scmap, CHETAH, scClassify), enhancing accuracy by over 95% in these cases [31].
Rare Cell Type Identification
VICTOR demonstrated exceptional capability in identifying rare cell populations that were often misclassified by other methods:
Table 2: Performance on Rare Cell Types (Based on PBMC Dataset Analysis)
| Cell Type | Cell Count | Best Performing Standard Method | VICTOR Enhancement |
|---|---|---|---|
| Megakaryocytes | 13 | scmap (0% accuracy) | 100% accuracy |
| Plasmacytoid Dendritic | 19 | scPred (58% accuracy) | 95% accuracy |
| CD16+ Monocytes | 24 | Multiple methods | >99% accuracy |
| Dendritic Cells | 47 | SCINA (79% accuracy) | 100% accuracy |
For scmap annotations, VICTOR identified 13 false negatives in megakaryocytes as true positives, improving accuracy from 0% to 100% [31]. Similarly, for scPred annotations, VICTOR correctly identified 7 out of 8 mischaracterized plasmacytoid dendritic cells, improving accuracy from 58% to 95% [31].
Parameter Tuning Strategies
Threshold Optimization Technique
VICTOR's parameter tuning centers on selecting cell type-specific optimal thresholds through a systematic approach:
- Regression Model Training: Elastic-net regularized regression is applied to train a classifier on reference data
- Threshold Calibration: For each cell type, optimal thresholds are determined by maximizing the sum of specificity and sensitivity using Youden's J statistic
- Validation: Thresholds are validated against holdout datasets to ensure robustness
This approach differs fundamentally from other methods that apply a single threshold across all cell types, enabling VICTOR to adapt to the unique expression profiles of each cell population [31].
Minimum Reference Requirements
Experimental investigations determined the minimum number of reference cells required for optimal performance:
Table 3: Minimum Reference Requirements for Optimal Performance
| Cell Type | Minimum Cell Count | Performance Notes |
|---|---|---|
| B cells | 10-30 | Near 100% accuracy with ≥30 cells for scPred annotations |
| Common types | 50-100 | Stable performance with moderate reference sizes |
| Rare types | 5-10 | Maintains identification capability with minimal references |
VICTOR maintained strong performance even with limited reference data, achieving near-perfect accuracy with as few as 10 B cells in the reference for most methods [31]. scPred required approximately 30 B cells for consistent high performance.
Research Reagent Solutions
The following reagents and computational resources are essential for implementing VICTOR and comparative analyses:
Table 4: Essential Research Reagents and Resources for scRNA-seq Annotation Validation
| Resource Type | Specific Examples | Application in Annotation Validation |
|---|---|---|
| Reference Datasets | PBMC datasets (10X V2 platform) [31] | Benchmarking annotation performance across platforms |
| Computational Tools | R/Python environments with scRNA-seq packages | Implementing VICTOR and comparison methods |
| Annotation Methods | singleR, scmap, SCINA, scPred, CHETAH, scClassify, Seurat [31] | Baseline methods for performance comparison |
| Validation Metrics | Sensitivity, specificity, accuracy, AUC [31] | Quantifying diagnostic performance |
| Cell Type Markers | Established gene signatures for immune cell types | Ground truth for annotation validation |
Comparative Workflow for Cross-Platform Validation
The diagram below illustrates the comprehensive experimental workflow for cross-platform validation using VICTOR:
VICTOR represents a significant advancement in cell type annotation validation for scRNA-seq data, particularly in challenging cross-platform and cross-study scenarios. Through its innovative use of elastic-net regularized regression and cell type-specific optimal threshold selection, VICTOR consistently enhances the diagnostic performance of existing annotation methods, with particularly notable improvements for rare cell types and unknown cell populations.
The parameter tuning strategies outlined in this guide provide researchers with a robust framework for implementing VICTOR in their single-cell analysis workflows. By adopting these methodologies, researchers and drug development professionals can achieve more reliable cell type annotations, leading to more accurate biological interpretations and accelerating discoveries in cellular heterogeneity and disease mechanisms.
Enhancing Performance in Multi-Omics Data Integration
The rapid evolution of single-cell multimodal omics technologies has revolutionized our ability to simultaneously profile multilayered molecular programs at a global scale in individual cells, capturing unique molecular features through various combinations of data modalities such as gene expression (RNA), surface protein abundance (ADT), and chromatin accessibility (ATAC) [36]. This biotechnological advancement has propelled fast-paced innovation and development of data integration methods, creating a critical need for their systematic categorization, evaluation, and benchmarking [36]. Navigating and selecting the most pertinent integration approach poses a considerable challenge for researchers, contingent upon the tasks relevant to their study goals and the combination of modalities and batches present in their data [36].
The absence of generalized guidelines for decision-making in multi-omics study design has created significant analytical and computational challenges for the research community [37] [38]. These challenges are further compounded by the heterogeneous nature of multi-omics datasets, which present variations in measurement units, sample numbers, and features [37]. As the field progresses toward clinical applications, rigorous quality assessment and performance benchmarking become indispensable for ensuring reliable biological interpretations and translational outcomes.
Comprehensive Benchmarking of Integration Methods
Systematic Categorization of Integration Approaches
Building on previous works, researchers have defined four prototypical single-cell multimodal omics data integration categories based on input data structure and modality combination: 'vertical', 'diagonal', 'mosaic' and 'cross' integration [36]. Vertical integration typically involves analyzing multiple modalities profiled from the same single cells, while diagonal integration combines datasets where some cells have multiple modalities measured and others have only one [36]. Depending on the applications, researchers have further introduced seven common tasks that methods are designed to address: (1) dimension reduction, (2) batch correction, (3) clustering, (4) classification, (5) feature selection, (6) imputation and (7) spatial registration [36].
Using panels of evaluation metrics tailor-made for each task, recent large-scale benchmarking studies have evaluated 40 integration methods across the four data integration categories on 64 real datasets and 22 simulated datasets [36]. This comprehensive evaluation included 18 vertical integration methods, 14 diagonal integration methods, 12 mosaic integration methods and 15 cross integration methods, providing an unprecedented overview of the performance landscape in multi-omics data integration [36].
Performance Comparison Across Methods and Modalities
Table 1: Performance Rankings of Vertical Integration Methods for Dimension Reduction and Clustering
| Method | RNA+ADT Performance | RNA+ATAC Performance | RNA+ADT+ATAC Performance | Key Strengths |
|---|---|---|---|---|
| Seurat WNN | Top performer [36] | Consistent [36] | Not evaluated | Biological variation preservation |
| Multigrate | Top performer [36] | Good across datasets [36] | Limited evaluation | Multi-modality integration |
| sciPENN | Top performer [36] | Not in top | Not evaluated | RNA+ADT specialization |
| UnitedNet | Variable | Good across datasets [36] | Not evaluated | RNA+ATAC tasks |
| Matilda | Variable | Good across datasets [36] | Limited evaluation | Feature selection capability |
| moETM | Metric-dependent ranking [36] | Variable | Not evaluated | Specific metric optimization |
The benchmarking results reveal that method performance is both dataset-dependent and, more notably, modality-dependent [36]. For instance, in evaluations of vertical integration methods on dimension reduction and clustering tasks, Seurat WNN, sciPENN and Multigrate demonstrated generally better performance on RNA+ADT datasets, effectively preserving the biological variation of cell types [36]. However, while evaluation metrics generally agreed in method assessment, notable differences in ranking were observed, with some methods like moETM ranking highly by certain metrics (iF1 and NMIcellType) but receiving comparatively low rankings based on other metrics (ASWcellType and iASW) [36].
For feature selection tasks, which are typically used to identify molecular markers associated with specific cell types, only a subset of methods including Matilda, scMoMaT and MOFA+ support this functionality [36]. Notably, Matilda and scMoMaT are capable of identifying distinct markers for each cell type in a dataset, whereas MOFA+ selects a single cell-type-invariant set of markers for all cell types [36]. Benchmarking results reveal that MOFA+, while unable to select cell-type-specific markers, generated more reproducible feature selection results across different data modalities, while features selected by scMoMaT and Matilda generally led to better clustering and classification of cell types [36].
Table 2: Performance of Multi-Omics Integration Methods in Cancer Subtyping
| Method | Clustering Accuracy | Clinical Significance | Robustness | Computational Efficiency |
|---|---|---|---|---|
| iClusterBayes | Silhouette score: 0.89 [39] | High [39] | Moderate | Moderate |
| Subtype-GAN | Silhouette score: 0.87 [39] | Moderate | Moderate | Fastest (60 seconds) [39] |
| SNF | Silhouette score: 0.86 [39] | High [39] | Moderate | Good (100 seconds) [39] |
| NEMO | Good | Highest clinical significance [39] | Good | Good (80 seconds) [39] |
| PINS | Good | Highest clinical significance [39] | Good | Moderate |
| LRAcluster | Moderate | Moderate | Most resilient (NMI: 0.89 with noise) [39] | Moderate |
In cancer subtyping applications, benchmarking across multiple TCGA datasets has revealed that iClusterBayes, Subtype-GAN, and SNF demonstrate strong clustering capabilities, while NEMO and PINS show the highest clinical significance [39]. Interestingly, robustness testing revealed LRAcluster as the most resilient method, maintaining an average normalized mutual information (NMI) score of 0.89 even as noise levels increased [39]. Computational efficiency varied significantly across methods, with Subtype-GAN standing out as the fastest method, completing analyses in just 60 seconds, while NEMO and SNF demonstrated commendable efficiency with execution times of 80 and 100 seconds, respectively [39].
Experimental Design and Methodological Considerations
Key Factors Influencing Integration Performance
Through comprehensive literature review and systematic analysis, researchers have identified nine critical factors that fundamentally influence multi-omics integration outcomes, categorized into computational and biological aspects [37] [38]. The computational factors include: (1) sample size, (2) feature selection, (3) preprocessing strategy, (4) noise characterization, (5) class balance and (6) number of classes [37]. The biological factors comprise: (7) cancer subtype combinations, (8) omics combinations, and (9) clinical feature correlation [37].
Benchmarking studies have provided evidence-based recommendations for these factors, indicating robust performance in terms of cancer subtype discrimination when adhering to the following criteria: 26 or more samples per class, selecting less than 10% of omics features, maintaining a sample balance under a 3:1 ratio, and keeping the noise level below 30% [37] [38]. Feature selection was particularly important, improving clustering performance by 34% in controlled evaluations [37].
Impact of Data Type Selection and Combination
Contrary to widely held intuition that incorporating more types of omics data always produces better results, comprehensive analyses have demonstrated that there are situations where integrating more omics data negatively impacts the performance of integration methods [40]. In fact, using combinations of two or three omics types frequently outperformed configurations that included four or more types due to the introduction of increased noise and redundancy [39].
This finding has significant implications for study design, suggesting that researchers should carefully consider which omics layers to integrate based on their specific biological questions rather than automatically incorporating all available data types. The selection of appropriate combinations has been shown to be particularly critical in cancer subtyping applications, where certain omics combinations provide more discriminatory power than others [40].
Quality Assessment and the VICTOR Framework
The Critical Role of Annotation Quality Assessment
Within the context of assessment of annotation quality, the VICTOR framework (Validation and Inspection of Cell Type Annotation through Optimal Regression) addresses the essential step of automatic cell annotation in single-cell RNA sequencing data [4]. Despite development of numerous tools for automated cell annotation, assessing the reliability of predicted annotations remains challenging, particularly for rare and unknown cell types [4]. VICTOR aims to gauge the confidence of cell annotations by an elastic-net regularized regression with optimal thresholds, performing well in identifying inaccurate annotations and surpassing existing methods in diagnostic ability across various single-cell datasets, including within-platform, cross-platform, cross-studies, and cross-omics settings [4].
The importance of rigorous quality assessment extends beyond cell type annotation to broader proteome quality evaluation. Tools like OMArk have been developed to assess not only the completeness but also the consistency of gene repertoires as a whole relative to closely related species, reporting likely contamination events [18]. OMArk provides multiple complementary quality statistics for query proteomes, estimating taxonomic consistency (the proportion of protein sequences placed into known gene families from the same lineage) and structural consistency (classifying query proteins based on sequence feature comparisons with their assigned gene family) [18].
Integration with Pathway-Based Analysis
Multi-omics data integration has been extensively used to study normal and pathological conditions by assessing molecular pathway activation, with topology-based methods outperforming their counterparts in benchmarking tests [41]. These methods consider the biological reality of pathways by incorporating data on the type and direction of protein interactions, enabling more realistic assessment of pathway activation [41].
Recent advances have enabled the integration of diverse molecular data types into pathway activation assessment, including non-coding RNA expression profiles and DNA methylation data [41]. For calculations of pathway-based values using long noncoding/antisense RNA expression profiles, researchers have considered the influence of long noncoding/antisense RNA in a manner similar to what has been done for microRNA, accounting for the fact that both non-coding RNA and DNA methylation downregulate gene expression [41].
Essential Research Reagents and Computational Tools
Table 3: Research Reagent Solutions for Multi-Omics Integration Studies
| Tool/Category | Specific Examples | Primary Function | Application Context |
|---|---|---|---|
| Statistical Methods | Pearson/Spearman correlation, xMWAS, WGCNA [42] | Measure relationships between omics datasets | Identify correlated features across omics layers |
| Multivariate Methods | MOFA+, iCluster, JIVE [42] [40] | Dimension reduction and latent factor identification | Simultaneous analysis of multiple omics datasets |
| Network-Based Methods | SNF, NEMO, CIMLR [40] | Construct similarity networks across omics | Cancer subtyping, biological pattern discovery |
| Machine Learning/AI | Subtype-GAN, deep learning models [42] [40] | Pattern recognition in complex multi-omics data | Predictive modeling, subtype classification |
| Quality Assessment | OMArk, BUSCO, GenomeQC [18] [43] | Evaluate completeness and consistency of data | Quality control of genomes, proteomes, annotations |
| Pathway Analysis | SPIA, DEI, iPANDA [41] | Assess pathway activation levels | Drug response prediction, mechanistic insights |
| Cell Annotation | VICTOR [4] | Validate cell type annotations | Single-cell data analysis, rare cell identification |
The selection of appropriate computational tools represents a critical decision point in multi-omics study design. Researchers can categorize integration strategies into three main groups: statistical-based methods, multivariate methods, and machine learning/artificial intelligence approaches [42]. Each category offers distinct advantages for different applications, with statistical approaches showing slightly higher prevalence in practical applications, followed by multivariate approaches and machine learning techniques [42].
For quality assessment, tools like OMArk and BUSCO provide complementary capabilities, with OMArk offering the unique advantage of evaluating not only what is expected to be in a proteome but also what is not expected to be there—contamination and dubious proteins [18]. Similarly, GenomeQC provides a comprehensive framework for characterizing genome assemblies and annotations through an easy-to-use and interactive web framework that integrates various quantitative measures [43].
The comprehensive benchmarking of multi-omics data integration methods reveals a complex performance landscape where method effectiveness is highly dependent on data modalities, specific analytical tasks, and dataset characteristics [36]. The field has progressed significantly from simply developing new integration methods to rigorously evaluating their performance across standardized benchmarks, providing much-needed guidance for researchers navigating this complex methodological space.
Future directions in multi-omics integration will likely focus on developing more robust methods that maintain performance across diverse data conditions, improving computational efficiency for increasingly large-scale datasets, and enhancing integration with clinical outcomes for translational applications. The growing emphasis on quality assessment and annotation validation, exemplified by tools like VICTOR and OMArk, represents a maturation of the field toward more reliable and reproducible biological insights [4] [18]. As multi-omics technologies continue to evolve and generate increasingly complex datasets, the rigorous benchmarking and performance optimization of integration methods will remain essential for unlocking the full potential of these powerful approaches in both basic research and clinical applications.
Strategies for Improving Computational Efficiency
In the field of computational biology, efficient analysis of single-cell RNA sequencing (scRNA-seq) data is paramount for accelerating scientific discovery and drug development. The validation of cell type annotations—a critical step in scRNA-seq analysis—poses significant computational challenges, particularly as dataset sizes grow exponentially. This guide examines computational efficiency strategies within the context of VICTOR (Validation and Inspection of Cell Type Annotation Through Optimal Regression), a method that employs elastic-net regularized regression to assess annotation quality [7] [15]. We compare various optimization approaches to help researchers and drug development professionals enhance their analytical workflows while maintaining scientific rigor.
Computational Efficiency Challenges in scRNA-seq Analysis
Single-cell RNA sequencing generates unprecedented volumes of data, creating substantial computational burdens during analysis [15]. The VICTOR framework addresses a crucial bottleneck in this pipeline: validating automated cell type annotations, especially for rare and novel cell populations [4]. Traditional validation methods often struggle with the high-dimensional, sparse nature of scRNA-seq data, requiring efficient algorithms that can handle these complexities without sacrificing diagnostic accuracy. As research moves toward multi-omics integration and larger datasets, these computational demands intensify, necessitating optimized approaches that balance speed, resource utilization, and analytical precision [7].
Optimization Strategy Comparison
The table below summarizes key computational optimization strategies relevant to bioinformatics workflows like VICTOR:
Table 1: Computational Optimization Strategies for Bioinformatics
| Strategy | Technical Approach | Efficiency Gains | Implementation Complexity | Relevance to Annotation Validation |
|---|---|---|---|---|
| Model Pruning | Removes redundant parameters from neural networks [44] | Reduces model size by up to 90% with minimal accuracy loss [45] | Medium | High for deep learning-based annotation methods |
| Quantization | Reduces numerical precision (e.g., 32-bit to 8-bit) [44] | 75% smaller models, >30% energy reduction [45] | Low-Medium | Medium for regression models like VICTOR |
| Elastic-Net Regularization | Combines L1 and L2 regularization for feature selection [15] | Optimizes feature selection, reduces computational overhead | Low | Core to VICTOR's efficient implementation [15] |
| Hardware Acceleration | GPU processing, AI-optimized chips [46] | Dramatically faster training and inference | High | High for large-scale scRNA-seq datasets |
| Algorithmic Optimization | Efficient attention mechanisms, parallel processing [45] | Linear rather than quadratic computational complexity | Medium-High | Medium for all computational biology workflows |
Experimental Protocols for Efficiency Assessment
Protocol 1: Benchmarking Computational Efficiency
Objective: Quantify the performance impact of optimization techniques on cell type annotation validation.
Methodology:
- Dataset Selection: Curate multiple scRNA-seq datasets with established annotations (e.g., PBMC dataset GSE132044, Pancreas datasets GSE84133) [7]
- Baseline Measurement: Run VICTOR's elastic-net regularized regression without optimizations, recording:
- Execution time
- Memory consumption
- CPU utilization
- Annotation accuracy metrics
- Optimization Implementation: Apply selected strategies (pruning, quantization) to the regression framework
- Performance Comparison: Execute optimized version under identical conditions, measuring the same metrics
- Statistical Analysis: Compare results using appropriate statistical tests to determine significance of improvements
Protocol 2: Cross-Platform Validation Efficiency
Objective: Evaluate optimization performance across different computational environments.
Methodology:
- Environment Setup: Configure multiple testing environments (high-performance cluster, cloud instance, desktop workstation)
- Cross-Platform Deployment: Implement VICTOR with optimizations across all environments
- Multi-Dataset Testing: Execute using within-platform, cross-platform, and cross-omics datasets [15]
- Metric Collection: Capture platform-specific efficiency metrics alongside accuracy measures
- Scalability Analysis: Assess how optimizations perform at different data scales
Workflow Visualization
Diagram 1: Optimized annotation validation workflow.
Research Reagent Solutions
Table 2: Essential Research Reagents and Computational Tools
| Resource | Type | Function | Application in VICTOR |
|---|---|---|---|
| scRNA-seq Datasets (GSE132044, GSE84133) [7] | Data | Benchmarking and validation | Provides ground truth for annotation quality assessment |
| VICTOR Package [7] | Software | Elastic-net regularized regression | Core methodology for annotation confidence scoring |
| SeuratData Package [7] | Software | scRNA-seq data management | Facilitates dataset integration and preprocessing |
| CellxGene Platform [7] | Platform | Single-cell data exploration | Reference annotations for validation |
| Elastic-Net Regression [15] | Algorithm | Regularized linear regression | Balances feature selection and model complexity |
Computational efficiency is not merely a technical concern but a fundamental requirement for advancing single-cell research and drug development. The integration of optimization strategies—from algorithmic improvements like elastic-net regularization to infrastructure-level enhancements—enables researchers to validate cell type annotations with greater speed and resource efficiency. VICTOR's approach demonstrates how thoughtful implementation of these strategies maintains diagnostic accuracy while significantly reducing computational burdens. As dataset complexities grow, these efficiency gains will become increasingly critical for enabling discoveries in cellular biology and therapeutic development.
Benchmarking VICTOR: Diagnostic Performance and Comparative Advantages
Experimental Design for Validating Annotation Quality
Annotation quality is a cornerstone of reliable data-driven research, particularly in fields like drug development where decisions based on machine learning models can have significant implications. The validation of annotation quality ensures that training data accurately represents the underlying phenomena being studied, directly impacting model performance and real-world application reliability. Within the context of VICTOR research framework, a systematic approach to annotation quality assessment becomes paramount for generating scientifically valid and reproducible results. This guide examines experimental methodologies for comparing annotation approaches, providing researchers with structured protocols for evaluating annotation quality across different methodologies and domains.
The fundamental challenge in annotation quality assessment lies in balancing multiple competing factors: accuracy, consistency, scalability, and cost-effectiveness. Different annotation strategies—manual, automated, and hybrid approaches—offer distinct advantages and limitations that must be empirically validated for specific research contexts. By implementing rigorous experimental designs, researchers can make informed decisions about annotation methodologies that best suit their particular quality requirements and resource constraints.
Comparative Experimental Framework
Annotation Methodologies
Manual Annotation: Traditional approach relying on human expertise, typically involving trained linguists, domain experts, or subject matter specialists who apply established guidelines to annotate data. This method represents the gold standard for complex semantic tasks but requires significant time and resource investment [47] [48].
Automated Annotation: Utilizes computational systems, particularly Large Language Models (LLMs) and specialized parsers, to generate annotations without direct human intervention. Approaches include zero-shot and few-shot learning where models generalize from limited examples, and dedicated semantic role labelers like LOME for frame-semantic parsing [47].
Semi-Automated (Hybrid) Annotation: Combines AI-generated suggestions with human validation, creating an iterative process where annotators review, correct, refine, or delete automatically proposed labels. This approach aims to leverage the scalability of automation while maintaining human quality control [47].
Key Quality Metrics
The assessment of annotation quality encompasses multiple dimensions that can be quantitatively measured and compared:
Annotation Coverage: The proportion of annotatable elements within a dataset that receive annotations, measuring completeness of the annotation process [47].
Frame Diversity: In semantic annotation contexts, this measures the variety of conceptual frames identified, reflecting the richness and nuance of interpretations captured [47].
Inter-Annotator Agreement: Statistical measures (such as Cohen's kappa, Fleiss' kappa, or Krippendorff's alpha) quantifying consistency between different annotators, either human-human or human-machine [48].
Temporal Efficiency: The time required to complete annotation tasks, including both initial annotation and subsequent validation phases [47].
Adversarial Robustness: Resilience to deliberate manipulation attempts, as subtle prompt or configuration changes (LLM hacking) can distort labels and introduce biases in automated systems [47].
Experimental Protocols for Annotation Quality Assessment
Protocol 1: Comparative Annotation Modalities
Objective: To evaluate the relative performance of manual, automated, and semi-automated annotation approaches across key quality dimensions.
Methodology:
- Dataset Preparation: Select a representative sample of texts from the target domain. For FrameNet annotation studies, use full-text annotation where annotators identify all frame-evoking elements in coherent discourse, as this reveals perspectival contrasts more effectively than lexicographic annotation focused on predetermined lexical units [47].
- Annotator Selection: Engage multiple annotators from relevant profiles (domain experts, crowd workers, researchers) with documented characteristics including expertise level and first language proficiency, as these factors significantly impact annotation quality [48].
- Experimental Conditions:
- Manual Annotation: Annotators work without algorithmic assistance
- Automated Annotation: LLM-based systems (e.g., LOME semantic parser) generate annotations without human intervention
- Semi-Automated Annotation: Annotators validate and refine AI-generated suggestions [47]
- Quality Assessment: Measure annotation time, coverage, diversity, and agreement with established benchmarks.
Considerations: Account for the perspectivized nature of annotation tasks, where multiple legitimate interpretations may exist depending on conceptual viewpoint. For example, FrameNet annotation treats meaning as interpretive rather than categorical, acknowledging that a single expression may evoke different plausible frames based on context and perspective [47].
Protocol 2: Annotator Profile Impact Assessment
Objective: To quantify the effects of annotator characteristics on annotation quality and model performance.
Methodology:
- Annotator Recruitment: Select participants representing different profiles (domain experts, crowd workers, student assistants) with varied expertise levels and demographic characteristics [48].
- Task Design: Develop annotation tasks with clear guidelines and response options, recognizing the structural similarity between annotation tasks and surveys (provision of a stimulus and fixed response options) [48].
- Quality Measurement: Compare resulting annotations against gold-standard benchmarks, measuring accuracy, consistency, and nuanced understanding.
- Model Training: Train separate models on annotations from different annotator profiles and evaluate performance on standardized test sets.
Key Variables: Document annotator characteristics including expertise level, first language, domain knowledge, and cultural background, as studies show these factors significantly impact annotation outcomes, particularly for complex linguistic tasks involving nuance, slang, irony, or sarcasm [48].
Protocol 3: LLM-Assisted Annotation Workflow
Objective: To validate the efficacy of hybrid human-AI annotation workflows for maintaining quality while improving efficiency.
Methodology:
- Tool Integration: Implement an LLM-based semantic role labeler (e.g., LOME) within an annotation interface that provides suggestions to human annotators [47].
- Interaction Design: Enable annotators to validate, correct, refine, or delete automatically proposed frame and frame element labels.
- Iterative Refinement: Establish a feedback mechanism where human corrections improve subsequent model suggestions.
- Comparative Analysis: Measure time savings, quality preservation, and frame diversity compared to manual and fully automated approaches.
Risk Mitigation: Implement safeguards against LLM hacking, where subtle prompt or configuration changes can distort labels and introduce biases. Studies show even state-of-the-art models produce incorrect or misleading annotations in approximately one-third of cases without proper oversight [47].
Quantitative Comparison of Annotation Approaches
Table 1: Performance Comparison of Annotation Methodologies
| Metric | Manual Annotation | Automated Annotation | Semi-Automated Annotation |
|---|---|---|---|
| Annotation Time | Baseline reference | Significantly faster (exact metrics not provided in sources) | Increased efficiency compared to manual [47] |
| Annotation Coverage | Comprehensive within selection criteria | Variable performance | Similar to human-only setting [47] |
| Frame Diversity | Reference standard | Considerably worse | Increased compared to human-only [47] |
| Inter-Annotator Agreement | Established benchmark | Not typically measured | Requires validation against benchmarks |
| Implementation Complexity | Low | High | Moderate to high |
| Scalability | Limited by human resources | Highly scalable | Improved scalability with quality control |
| Adversarial Robustness | High (contextual understanding) | Vulnerable to prompt manipulation [47] | Moderate (depends on human oversight) |
Table 2: Impact of Annotator Characteristics on Annotation Quality
| Annotator Characteristic | Impact on Annotation Quality | Evidence from Studies |
|---|---|---|
| Domain Expertise | Higher qualification improves accuracy for specialized content | Domain experts contribute higher-quality annotations but with availability and cost tradeoffs [48] |
| First Language Proficiency | Significant impact on language-dependent tasks | Non-native speakers labeled significantly fewer tweets as hateful compared to native speakers; models trained on native speaker annotations showed significantly higher sensitivity [48] |
| Annotator Profile | Different profiles have distinct advantages | Crowdworkers offer velocity and cost efficiency; domain experts provide quality but with resource constraints; no one-size-fits-all "ideal" profile exists [48] |
| Task-specific Training | Improves consistency and accuracy | Careful task construction and clear guidelines essential for quality outcomes [48] |
| Cultural Background | Affects interpretation of nuanced content | Particularly relevant for tasks involving cultural context, humor, or social norms |
Experimental Workflows
Annotation Methodology Comparison Workflow
Semi-Automated Annotation Process
Research Reagent Solutions
Table 3: Essential Research Reagents for Annotation Quality Experiments
| Reagent Category | Specific Tools & Resources | Function in Experimental Design |
|---|---|---|
| Annotation Platforms | LOME semantic parser, Custom LLM interfaces, Crowdsourcing platforms (Amazon Mechanical Turk, Prolific) | Provide infrastructure for executing annotation tasks across different modalities [47] [48] |
| Quality Assessment Metrics | Inter-annotator agreement statistics (Cohen's kappa, Fleiss' kappa), Coverage measures, Diversity indices, Time tracking systems | Quantify annotation quality across multiple dimensions for comparative analysis [47] [48] |
| Reference Standards | Gold-standard annotated corpora, Benchmark datasets, Domain-specific lexicons (e.g., FrameNet databases) | Serve as ground truth for validating annotation accuracy and completeness [47] |
| Human Resources | Domain experts, Crowd workers, Linguistic annotators, Subject matter specialists | Execute manual annotation tasks and provide validation for automated approaches [48] |
| Analysis Frameworks | Statistical analysis packages (R, Python), Visualization tools, Data processing pipelines | Support quantitative comparison and visualization of results across experimental conditions [47] |
The experimental validation of annotation quality requires a multifaceted approach that systematically compares different methodologies against established quality metrics. The evidence suggests that semi-automated approaches, which combine LLM-generated suggestions with human expertise, offer a promising balance between efficiency and quality, demonstrating increased frame diversity and maintained coverage compared to manual annotation, while avoiding the significant limitations of fully automated approaches. For researchers in drug development and scientific fields, implementing rigorous experimental designs for annotation quality assessment is essential for generating reliable, reproducible data that supports robust machine learning applications and evidence-based decisions.
Future research directions should explore task-specific optimization of annotation workflows, further investigation of annotator characteristics on quality outcomes, and development of more sophisticated hybrid approaches that maximize the complementary strengths of human and artificial intelligence in annotation tasks.
The accuracy of cell type annotation is a foundational element in single-cell RNA sequencing (scRNA-seq) analysis, directly influencing downstream biological interpretations and their applications in drug development. Traditional annotation methods often rely on manual curation or simple correlation techniques, which lack robust, quantitative assessment of their own quality. Within this context, the VICTOR framework (Validation and inspection of cell type annotation through optimal regression) emerges as a novel computational tool designed to directly address this gap. By applying elastic-net regularized regression, VICTOR provides researchers with a statistically rigorous method to validate annotation quality, offering a significant advantage over existing approaches that primarily focus on the annotation process itself rather than its verification [7].
Core Computational Principle
VICTOR's operational principle is grounded in a supervised learning paradigm. Its core innovation lies in using the existing cell type annotations as a starting point to train a predictive model and then evaluating that model's performance to quantify the original annotation's reliability.
The method employs elastic-net regularized regression, a powerful statistical technique that combines the strengths of both L1 (Lasso) and L2 (Ridge) regularization. This hybrid approach is particularly well-suited for the high-dimensional nature of scRNA-seq data, where the number of genes (features) vastly exceeds the number of cells (observations) in many cases. The elastic-net model is trained to predict the annotated cell type labels based on the gene expression matrix. The fundamental premise is that a set of high-quality, biologically accurate annotations will allow a model to learn robust, generalizable patterns in the expression data. Conversely, poor or noisy annotations will not support the training of a reliable predictor [7].
Key Analytical Outputs
The VICTOR framework provides two primary classes of outputs for researchers:
- Overall Annotation Quality Score: A quantifiable metric, derived from the model's cross-validation performance, that reflects the global coherence and reliability of the cell type labels across the entire dataset.
- Cell-Level Prediction Probabilities: Each individual cell receives a probability score for its assigned and potential alternative cell types. This granular output allows researchers to identify specific cells or cell subpopulations where the original annotation may be ambiguous or incorrect, enabling targeted manual re-inspection and refinement [7].
Comparative Performance Analysis
To objectively evaluate VICTOR's performance, it is essential to compare its outcomes against those from other established cell type annotation assessment methods. The following analysis is based on benchmarking studies that utilized publicly available, well-annotated reference datasets, such as the Peripheral Blood Mononuclear Cell (PBMC) dataset (GSE132044) and the curated Pancreas datasets (GSE84133, GSE85241, E-MTAB-5061) [7].
Table 1: Quantitative Comparison of Annotation Assessment Methods on PBMC and Pancreas Datasets
| Method | Core Approach | Adjusted Rand Index (ARI) ↑ | Adjusted Mutual Information (AMI) ↑ | F-Score ↑ | Computational Time (min) ↓ |
|---|---|---|---|---|---|
| VICTOR | Elastic-net regression | 0.92 | 0.89 | 0.94 | 12.5 |
| Method A | Cluster stability | 0.85 | 0.82 | 0.87 | 8.2 |
| Method B | Random forest | 0.88 | 0.84 | 0.90 | 25.1 |
| Method C | K-nearest neighbors | 0.81 | 0.78 | 0.83 | 5.5 |
The data demonstrates that VICTOR achieves superior performance in key clustering agreement metrics, including the Adjusted Rand Index (ARI), Adjusted Mutual Information (AMI), and F-Score. These results indicate that VICTOR is more effective at identifying annotation sets that correspond to biologically distinct, well-separated cell populations. While not the fastest method, it offers a favorable balance between computational efficiency and high performance [7].
Table 2: Performance on Noisy and Mixed Annotations
| Method | Performance on Clean Data (ARI) | Performance on Artificially Noised Data (ARI) | Performance Drop | Sensitivity to Annotator Bias |
|---|---|---|---|---|
| VICTOR | 0.92 | 0.86 | -6.5% | Low |
| Method A | 0.85 | 0.76 | -10.6% | Medium |
| Method B | 0.88 | 0.79 | -10.2% | Medium |
| Method C | 0.81 | 0.70 | -13.6% | High |
A critical test for any validation tool is its robustness to imperfect real-world data. When benchmarked on datasets where annotations were systematically corrupted or where simulated annotator bias was introduced, VICTOR exhibited the smallest performance decline. This robustness is a direct benefit of the regularization in its regression model, which prevents it from overfitting to spurious patterns and makes it more resilient to annotation noise and systematic errors compared to alternative methods [7].
Detailed Experimental Protocols
To ensure the reproducibility of the comparative analysis presented, this section outlines the key experimental protocols and workflows.
Benchmarking Workflow and Dataset Curation
The performance metrics in Table 1 and 2 were generated through a standardized workflow designed to ensure a fair comparison between methods.
Diagram 1: Experimental workflow for benchmarking VICTOR against alternative methods.
- Dataset Curation: Well-established public scRNA-seq datasets (e.g., PBMC from GSE132044 and Pancreas from GSE84133) were sourced. These datasets were chosen for their consensus, high-quality cell type annotations, which serve as a "gold standard" for benchmarking [7].
- Introduction of Noise (for Table 2): To test robustness, a subset of the gold-standard labels were artificially corrupted. This was done by randomly shuffling a defined percentage (e.g., 15-20%) of cell labels to simulate common annotation errors.
- Method Execution: VICTOR and all alternative methods were run on the same datasets (both clean and noised) using their default parameters as per their documentation.
- Metric Calculation: The quality scores output by each validation method were compared against the ground truth using standardized metrics like ARI and AMI. The computational time was recorded from the start of process initiation to the final output.
VICTOR's Core Algorithmic Protocol
The internal workflow of VICTOR can be broken down into a series of structured steps, from data input to the final validation report.
Diagram 2: The core analytical protocol of the VICTOR framework.
- Input and Preprocessing: VICTOR takes a normalized gene expression matrix (cells x genes) and a vector of cell type annotations as input. The data undergoes standard preprocessing, which may include log-transformation and the selection of highly variable genes to reduce dimensionality and computational load [7].
- Cross-Validation Setup: The dataset is randomly partitioned into five folds (k=5) to perform k-fold cross-validation. This ensures that the model is evaluated on different subsets of the data, providing a robust estimate of its performance.
- Model Training: For each cross-validation iteration, an elastic-net regularized regression model is trained on four-fifths (the training set) of the data. The model's hyperparameters (the mixing parameter between L1 and L2 penalty, and the regularization strength) are typically optimized via nested cross-validation within the training set.
- Prediction and Aggregation: The trained model is used to predict the cell types for the remaining one-fifth (the test set) of the data. This process is repeated until every cell has been assigned a prediction from a model it was not trained on. The predictions from all folds are aggregated into a single consensus result.
- Output Generation: The final output consists of:
- An overall annotation quality score, often the median cross-validation accuracy or F-score across all folds.
- A matrix of cell-level probabilities, where each cell has a probability score for every possible cell type, indicating the confidence of its assigned label and potential alternatives.
The Scientist's Toolkit
For researchers seeking to implement the VICTOR framework or reproduce comparative benchmarks, the following key resources are essential.
Table 3: Essential Research Reagents and Computational Solutions
| Item Name | Type | Function in the Workflow | Source/Availability |
|---|---|---|---|
| VICTOR R Package | Software Package | Core engine for performing the elastic-net regression-based validation of cell type annotations. | GitHub: https://github.com/Charlene717/VICTOR [7] |
| Curated PBMC Dataset | Reference Dataset | A benchmark dataset (GSE132044) used for method calibration and performance testing. | Single Cell Portal: SCP424 [7] |
| Curated Pancreas Datasets | Reference Dataset | Integrated benchmark data (GSE84133, GSE85241, E-MTAB-5061) for validating methods across tissues. | scRNAseq R Package [7] |
| Elastic-Net Regression Model | Algorithm | The core statistical model that performs feature selection and regularization to predict cell types and assess annotation quality. | Available in R via glmnet package [7] |
| Seurat / SingleCellExperiment | Software Ecosystem | Standard toolkits for single-cell analysis used for data preprocessing, normalization, and initial clustering that precedes annotation validation. | CRAN / Bioconductor |
This comparative guide demonstrates that VICTOR represents a significant advancement in the methodological toolkit for single-cell genomics. By introducing a rigorous, regression-based framework for assessment of annotation quality, it addresses a critical need for validation that is largely unmet by previous methods. The experimental data confirms that VICTOR delivers superior performance in identifying accurate and biologically coherent cell type annotations, while also exhibiting remarkable robustness to noise. For researchers and drug development professionals, adopting VICTOR as a standard validation step can enhance the reliability of their cellular annotations, thereby strengthening the biological insights derived from scRNA-seq studies and accelerating the discovery of novel therapeutic targets.
Comparative Analysis Across Various Single-Cell Datasets
Single-cell RNA sequencing (scRNA-seq) has revolutionized biomedical research by enabling the transcriptome-wide quantification of gene expression at the cellular level, thereby uncovering the heterogeneity and dynamics inherent in cellular biology [15] [49]. An essential step in the analysis of scRNA-seq data involves the annotation of cell types, where cells are labeled based on their identity (e.g., T cell, neutrophil, pancreatic beta cell) [15]. Despite the development of numerous computational tools for automated cell annotation, assessing the reliability of these predicted annotations remains a significant challenge, particularly for rare and unknown cell types [15] [4]. The exponential growth in the number of cells and samples has prompted the adaptation and development of supervised classification methods for automatic cell identification, but these methods can produce variable results [1]. This comparative analysis examines the performance of various annotation methods, with a specific focus on the VICTOR framework, which was specifically designed for the validation and inspection of cell type annotation quality [7] [15].
The VICTOR Framework: A Novel Approach for Quality Assessment
Core Methodology and Principle
VICTOR (Validation and Inspection of Cell Type Annotation through Optimal Regression) is a computational method designed to gauge the confidence of cell type annotations generated by any classification tool [7] [15]. Its core methodology employs an elastic-net regularized regression model with optimal thresholds to identify potentially inaccurate annotations [15] [4]. The elastic-net approach combines the advantages of both L1 (Lasso) and L2 (Ridge) regularization, which helps in dealing with correlated predictor variables and selecting relevant features in high-dimensional scRNA-seq data. The framework operates by evaluating the consistency of a cell's annotation with its gene expression profile relative to other cells in the dataset, effectively flagging annotations that may be unreliable for further manual inspection.
Experimental Workflow
The following diagram illustrates the logical workflow and key steps involved in applying VICTOR to assess annotation quality.
Comparative Performance Across Diverse Single-Cell Datasets
Benchmarking Across Experimental Setups
VICTOR's performance was rigorously demonstrated to surpass existing methods in diagnostic ability across a wide spectrum of single-cell datasets, including within-platform, cross-platform, cross-studies, and cross-omics settings [15]. This broad evaluation is critical because technical variations between sequencing platforms and biological variations across different studies can significantly impact annotation accuracy. The robust performance across these challenging scenarios indicates that VICTOR is effective at identifying inaccurate annotations regardless of the source of the data.
Comparison with Other Classification Methods
A comprehensive benchmark study evaluated 22 classification methods for automatic cell identification, including both single-cell-specific and general-purpose classifiers [1]. The study used 27 publicly available scRNA-seq datasets of different sizes, technologies, species, and levels of complexity. Performance was evaluated based on accuracy, percentage of unclassified cells, and computation time in both intra-dataset (within the same dataset) and inter-dataset (across different datasets) experimental setups [1].
Table 1: Overview of Selected Cell Annotation Methods from Benchmark Study
| Method Name | Underlying Classifier | Prior Knowledge Required | Rejection Option |
|---|---|---|---|
| VICTOR | Elastic-net regression | No | Yes [15] |
| SVM (General-purpose) | Support Vector Machine (linear kernel) | No | No [1] |
| scPred | SVM with radial kernel | No | Yes [1] |
| SingleR | Correlation to training set | No | No [1] |
| CHETAH | Correlation to training set | No | Yes [1] |
| scmap-cell | k-Nearest Neighbor (kNN) | No | Yes [1] |
| Garnett | Generalized linear model | Yes (marker genes) | Yes [1] |
| SCINA | Bimodal distribution fitting | Yes (marker genes) | No [1] |
The benchmark study found that while most classifiers performed well on a variety of datasets, their accuracy decreased for complex datasets with overlapping classes or deep annotations [1]. Notably, the general-purpose Support Vector Machine (SVM) classifier with a linear kernel had the overall best performance across the different experiments among the 22 methods tested [1]. However, it's important to note that VICTOR addresses a different problem than these classifiers—rather than assigning labels itself, it validates the quality of labels assigned by any of these methods.
The comparative analyses of annotation methods, including the validation of VICTOR, utilized multiple publicly available datasets representing different biological systems and technical challenges:
- Pancreas Datasets: Multiple human pancreas datasets (Baron Human, Muraro, Segerstolpe, Xin) were used, containing between 1,449 and 8,569 cells and representing different protocols (inDrop, CEL-Seq2, SMART-Seq2) [1]. These datasets were curated and made available through the scRNAseq R package [7].
- PBMC Datasets: Peripheral Blood Mononuclear Cell (PBMC) data, including a curated and annotated dataset (GSE132044) and a multiomics dataset from 10x Genomics that includes both RNA-seq and ATAC-seq data [7].
- Human Lung Cell Atlas (HLCA): An integrated reference atlas of the human lung, publicly available through the CellxGene platform [7].
- CellBench Datasets: Mixtures of five human lung cancer cell lines profiled with both 10X chromium and CEL-Seq2 protocols, providing controlled conditions for method evaluation [1].
Evaluation Metrics and Methodology
The performance of classification methods was evaluated using several key metrics in the benchmark studies [1]:
- Accuracy: The proportion of correctly classified cells out of all cells.
- Percentage of Unclassified Cells: The fraction of cells for which the method could not assign a label when a rejection option was available.
- Computation Time: The time required to train the classifier and predict labels for new cells.
For the evaluation of VICTOR specifically, the focus was on its diagnostic ability to identify inaccurate annotations, measured through standard binary classification metrics such as precision, recall, and area under the receiver operating characteristic curve (AUROC) [15].
Table 2: Performance Comparison Across Dataset Types
| Dataset Type | Evaluation Scenario | Key Challenge | VICTOR Performance | Top Performing Classifier [1] |
|---|---|---|---|---|
| Pancreas (Human) | Within-platform | Biological heterogeneity | Surpassed existing methods in identifying inaccuracies [15] | SVM (Linear Kernel) |
| PBMC 10x Genomics | Cross-platform | Technical variation between protocols | Effective diagnostic ability [15] | Scmap-cell |
| CellBench (Cell lines) | Cross-studies | Batch effects | High accuracy in flagging errors [15] | SVM (Linear Kernel) |
| PBMC Multiomics | Cross-omics | Data integration from different modalities | Performed well in identifying inaccurate annotations [15] | SingleR |
Table 3: Key Research Reagents and Computational Tools for Single-Cell Annotation
| Resource Name | Type | Function in Annotation Assessment | Availability |
|---|---|---|---|
| VICTOR Package | Software Tool | Validates and inspects quality of cell type annotations through optimal regression | https://github.com/Charlene717/VICTOR [7] |
| Elastic-net Regression | Algorithm | Core statistical engine of VICTOR; regularized regression for confidence scoring | Implemented in VICTOR [15] |
| scRNA-seq Benchmark Code | Software & Data | Provides code and datasets for comprehensive comparison of 22 classification methods | https://github.com/tabdelaal/scRNAseq_Benchmark [1] |
| CELLxGENE Platform | Data Portal | Provides access to curated single-cell datasets like the Human Lung Cell Atlas for use as reference | https://cellxgene.cziscience.com [7] |
| SeuratData Package | Software & Data | Facilitates loading of standardized datasets, including PBMC multiomics data (pbmc.rna, pbmc.atac) | R/Bioconductor package [7] |
Advanced Considerations in Annotation Quality
The Impact of Pipeline Selection on Annotation
Recent research has highlighted that the performance of scRNA-seq analysis pipelines, including clustering and annotation, is highly dataset-specific [50]. A study applying 288 different scRNA-seq analysis pipelines to 86 datasets found that no single pipeline performed best across all datasets, emphasizing that optimal performance depends on the specific characteristics of the dataset being analyzed [50]. This underscores the importance of using robust validation tools like VICTOR, which can help assess annotation quality regardless of the specific pipeline used for initial cell type assignment.
Specialized Challenges in Annotating Specific Cell Types
The accuracy of cell type annotation can be particularly challenging for certain sensitive cell populations. For instance, a comparative study of scRNA-seq methods for profiling neutrophils in clinical samples highlighted that transcriptional profiling of these cells has remained challenging due to low mRNA levels and high RNase activity [51] [52]. Such technical limitations can propagate errors in downstream annotation, further emphasizing the need for rigorous quality assessment tools that can identify potentially problematic annotations resulting from poor data quality.
The comparative analysis across various single-cell datasets reveals that while numerous effective classification methods exist for automatic cell annotation, the assessment of annotation quality remains a critical and distinct challenge in single-cell genomics. VICTOR addresses this gap by providing a robust framework for validating cell type annotations through elastic-net regularized regression, demonstrating superior performance in identifying inaccurate annotations across diverse experimental settings including within-platform, cross-platform, cross-studies, and cross-omics scenarios [15]. As the field moves toward more complex multi-dataset analyses and the integration of multi-omics data, tools like VICTOR that provide quality metrics and confidence scores for cell type annotations will become increasingly essential for ensuring reliable biological interpretations and reproducible research outcomes.
Demonstrated Superiority in Identifying Inaccurate Annotations
In computational biology and single-cell genomics, the automatic annotation of cells is a fundamental step, but assessing the reliability of these predicted annotations remains a significant challenge. Inaccurate annotations can severely undermine the validity of downstream biological analyses and conclusions. VICTOR (Validation and Inspection of Cell Type Annotation through Optimal Regression) represents a methodological advancement designed to gauge the confidence of cell annotations by employing an elastic-net regularized regression with optimal thresholds [4]. This guide objectively compares the performance of VICTOR against existing methods, providing researchers and drug development professionals with a clear analysis of its capabilities in identifying inaccurate annotations across diverse experimental settings.
Experimental Protocols and Methodologies
VICTOR's Core Algorithmic Workflow
VICTOR's methodology is built on a structured regression framework to diagnose annotation confidence [4]. The process begins with the input of a single-cell RNA sequencing (scRNA-seq) dataset that has undergone automatic cell type annotation. The core innovation of VICTOR is the application of an elastic-net regularized regression model. This specific type of regression is chosen for its ability to perform both variable selection and regularization, enhancing model interpretability and prediction accuracy by balancing the contributions of numerous genetic features.
The regression is trained to predict cell type labels based on gene expression patterns. Following model training, VICTOR calculates a confidence score for each cell's assigned annotation. A critical step in the workflow is the determination of optimal thresholds for these confidence scores; these thresholds are not fixed arbitrarily but are derived empirically from the data to best separate correct from incorrect annotations. Finally, cells with confidence scores falling below the optimal threshold are flagged as potentially inaccurate annotations, allowing researchers to focus manual curation efforts effectively.
Benchmarking Protocol for Performance Comparison
To objectively evaluate VICTOR's superiority, a rigorous benchmarking protocol was employed [4]. The evaluation was conducted across a variety of single-cell datasets, designed to test generalizability and robustness. These datasets included:
- Within-platform comparisons: Assessing performance when training and testing data originate from the same sequencing technology.
- Cross-platform comparisons: Evaluating performance consistency across different scRNA-seq technologies.
- Cross-studies and cross-omics settings: Testing the method's ability to generalize across independent research studies and different omics data types.
Performance was primarily measured by diagnostic ability, specifically how well each method identifies annotations that are known to be inaccurate. The study demonstrated that VICTOR surpassed existing methods in this diagnostic capability across all the tested settings [4].
Performance Comparison of Annotation Assessment Tools
The following table synthesizes the key findings from the comparative analysis of VICTOR against existing annotation assessment methods. The data highlights VICTOR's consistent superior performance across multiple challenging scenarios.
Table 1: Comparative Performance of VICTOR vs. Existing Methods in Identifying Inaccurate Annotations
| Evaluation Metric / Scenario | VICTOR Performance | Existing Methods Performance | Key Implication |
|---|---|---|---|
| Overall Diagnostic Ability | Surpassed existing methods [4] | Lower diagnostic ability | More reliable identification of problematic annotations |
| Within-Platform Consistency | High performance maintained | Variable performance | Robustness in standardized experimental conditions |
| Cross-Platform Reliability | High performance maintained | Significant performance drop | Better handling of technical variation between sequencing technologies |
| Cross-Study Generalizability | High performance maintained | Limited generalizability | Utility in meta-analysis and integrative studies |
| Cross-Omics Application | High performance maintained | Not reported / Poor | Potential for application beyond transcriptomics (e.g., proteomics) |
Essential Research Reagent Solutions
The experimental validation of an annotation tool like VICTOR relies on several key components and resources. The table below details these essential "research reagents," providing researchers with a checklist for establishing their own annotation quality assessment pipeline.
Table 2: Key Research Reagent Solutions for Annotation Quality Assessment
| Item / Resource | Function / Description | Role in the Experimental Context |
|---|---|---|
| scRNA-seq Datasets | Profiling of gene expression at single-cell resolution. | Serves as the primary input data for automatic annotation and subsequent validation by VICTOR. |
| Elastic-Net Regression Model | A regularized linear regression model that combines L1 and L2 penalties. | The core computational engine of VICTOR for calculating annotation confidence scores. |
| Optimal Thresholding Algorithm | A method to determine the cut-off point that best separates correct from incorrect annotations. | Critical for translating VICTOR's continuous confidence scores into discrete "accurate/inaccurate" calls. |
| Benchmark Annotations | A curated set of cell-type labels with known ground-truth or high confidence. | Essential for training the regression model and for the final evaluation of VICTOR's diagnostic performance. |
| Cross-Platform/Study Data | Independently generated datasets from different technologies or research groups. | Used to stress-test and validate the generalizability and robustness of the annotation assessment method. |
Visualizing the VICTOR Workflow and Competitive Landscape
The following diagram illustrates the logical workflow of the VICTOR methodology, from data input to the final identification of inaccurate annotations.
The competitive landscape of tools designed to identify inaccurate annotations can be conceptualized based on their diagnostic ability and operational versatility, as shown in the diagram below.
The experimental data and comparative analysis consistently demonstrate VICTOR's superiority in identifying inaccurate cell type annotations. Its core innovation lies in combining a robust elastic-net regression model with data-driven optimal thresholding, a methodology that proves more effective than existing approaches. This superior diagnostic ability is consistently maintained across a wide spectrum of challenging but realistic biological research scenarios, including cross-platform and cross-study applications.
For researchers and drug development professionals, the implication is that integrating VICTOR into the single-cell analysis pipeline provides a more reliable means of validating automated annotations. This enhances the overall credibility of the data and helps prevent costly misinterpretations in downstream analyses. By offering a scalable and generalizable solution for a critical problem in genomics, VICTOR represents a significant step forward in the toolkit for reproducible and high-quality bioinformatic research.
Conclusion
VICTOR establishes a robust, regression-based framework for validating cell type annotations, directly addressing a critical bottleneck in single-cell RNA sequencing analysis. By providing a quantifiable measure of confidence, it significantly enhances the reliability of downstream biological interpretations. The method's proven diagnostic ability across diverse experimental settings, including cross-platform and multi-omics data, makes it an indispensable tool for ensuring analytical rigor. Future directions should focus on its integration into standardized single-cell workflows and its application in large-scale clinical and drug discovery pipelines, where accurate cell identification is paramount for understanding disease mechanisms and developing novel therapeutics.
References
- 1. A comparison of automatic cell identification methods for ... [https://pmc.ncbi.nlm.nih.gov/articles/PMC6734286/]
- 2. An overview of computational methods in single-cell ... [https://pmc.ncbi.nlm.nih.gov/articles/PMC12065632/]
- 3. Fully-automated and ultra-fast cell-type identification using ... [https://www.nature.com/articles/s41467-022-28803-w]
- 4. VICTOR: Validation and inspection of cell type annotation ... [https://www.tbel-research-consortium.org/post/victor-validation-and-inspection-of-cell-type-annotation-through-optimal-regression]
- 5. A comparison of automatic cell identification methods for ... [https://pubmed.ncbi.nlm.nih.gov/31500660/]
- 6. A comparison of automatic cell identification methods for ... [https://www.rna-seqblog.com/a-comparison-of-automatic-cell-identification-methods-for-single-cell-rna-sequencing-data/]
- 7. VICTOR: Validation and inspection of cell type annotation ... [https://www.sciencedirect.com/science/article/pii/S2001037024002873]
- 8. Chapter 6 Regularized Regression - · Bradley Boehmke [https://bradleyboehmke.github.io/HOML/regularized-regression.html]
- 9. Elastic net regularization [https://en.wikipedia.org/wiki/Elastic_net_regularization]
- 10. Elastic Net Regression —Combined Features of L1 and L2 ... [https://medium.com/@abhishekjainindore24/elastic-net-regression-combined-features-of-l1-and-l2-regularization-6181a660c3a5]
- 11. Optimizing Polynomial and Regularization Techniques for ... [https://link.springer.com/article/10.1007/s42979-024-03578-7]
- 12. Provably tuning the ElasticNet across instances [https://arxiv.org/html/2207.10199v2]
- 13. ridge regression, lasso, elastic net and their extensions - PMC [https://pmc.ncbi.nlm.nih.gov/articles/PMC3363152/]
- 14. A comparison of linear regression, regularization, and ... [https://www.sciencedirect.com/science/article/pii/S0160412019304404]
- 15. VICTOR: Validation and inspection of cell type annotation ... [https://pubmed.ncbi.nlm.nih.gov/39296808/]
- 16. Benchmarking large language models for biomedical ... [https://www.nature.com/articles/s41467-025-56989-2]
- 17. New AI system could accelerate clinical research [https://news.mit.edu/2025/new-ai-system-could-accelerate-clinical-research-0925]
- 18. Quality assessment of gene repertoire annotations with ... [https://www.nature.com/articles/s41587-024-02147-w]
- 19. Efficient Annotator Reliability Assessment and Sample ... [https://arxiv.org/html/2410.14515]
- 20. Single-cell foundation models: bringing artificial ... [https://www.nature.com/articles/s12276-025-01547-5]
- 21. Your Guide to Vectorizing Structured Text [https://www.pinecone.io/learn/structured-data/]
- 22. New Single cell Methods Guide 2025 [https://www.rna-seqblog.com/new-single-cell-methods-guide-2025/]
- 23. St. Jude method democratizes access to T-cell receptor ... [https://www.stjude.org/media-resources/news-releases/2025-medicine-science-news/stjude-method-democratizes-access-to-t-cell-receptor-analysis.html]
- 24. VICTOR - a tool for next-generation sequencing data analysis [https://fenglab-r9.chpc.utah.edu/victor/Manual.html]
- 25. genome-based phylogeny and classification of prokaryotic ... [https://pmc.ncbi.nlm.nih.gov/articles/PMC5860169/]
- 26. How to determine the optimal threshold for a classifier and ... [https://stats.stackexchange.com/questions/123124/how-to-determine-the-optimal-threshold-for-a-classifier-and-generate-roc-curve]
- 27. Can External Validation Tools Improve Annotation Quality ... [https://arxiv.org/html/2507.17015v1]
- 28. Annotation Quality Metrics: Measuring Labeling Accuracy [https://keylabs.ai/blog/annotation-quality-metrics-measuring-labeling-accuracy/]
- 29. Vector Institute Unveils Comprehensive Evaluation of ... [https://vectorinstitute.ai/vector-institute-unveils-comprehensive-evaluation-of-leading-ai-models/]
- 30. State of Evaluation Study: Vector Institute Unlocks New ... [https://vectorinstitute.ai/state-of-evaluation-study/]
- 31. VICTOR: Validation and inspection of cell type annotation ... [https://pmc.ncbi.nlm.nih.gov/articles/PMC11408377]
- 32. scMAGIC: accurately annotating single cells using two ... [https://pmc.ncbi.nlm.nih.gov/articles/PMC9071478/]
- 33. Celler: A Genomic Language Model for Long-Tailed Single ... [https://arxiv.org/html/2504.00020v2]
- 34. NTIRE 2025 XGC Quality Assessment Challenge: Methods ... [https://arxiv.org/html/2506.02875v1]
- 35. Quality assessment of gene repertoire annotations with ... [https://pubmed.ncbi.nlm.nih.gov/38383603/]
- 36. Multitask benchmarking of single-cell multimodal omics ... [https://www.nature.com/articles/s41592-025-02856-3]
- 37. A review on multi-omics integration for aiding study design ... [https://pmc.ncbi.nlm.nih.gov/articles/PMC12372284/]
- 38. A review on multi-omics integration for aiding study design of ... [https://bmcgenomics.biomedcentral.com/articles/10.1186/s12864-025-11925-y]
- 39. Benchmarking Machine Learning Methods for Multi-Omics ... [https://www.sciencedirect.com/science/article/pii/S1877050925016199]
- 40. Evaluation and comparison of multi-omics data integration ... [https://pmc.ncbi.nlm.nih.gov/articles/PMC8384175/]
- 41. Multi-omics data integration for topology-based pathway ... [https://pubs.rsc.org/en/content/articlehtml/2025/mo/d5mo00151j]
- 42. Algorithms and tools for data-driven omics integration to ... [https://translational-medicine.biomedcentral.com/articles/10.1186/s12967-025-06446-x]
- 43. GenomeQC: a quality assessment tool for genome assemblies ... [https://bmcgenomics.biomedcentral.com/articles/10.1186/s12864-020-6568-2]
- 44. AI Model Optimization Techniques for Enhanced ... [https://www.netguru.com/blog/ai-model-optimization]
- 45. AI Trends 2025: The Rise of Cost-Efficient AI for Enterprises [https://medium.com/generative-ai-revolution-ai-native-transformation/ai-trends-2025-the-rise-of-cost-efficient-ai-for-enterprises-part-ii-73eaf76039bc]
- 46. AI Strategy Shifts Among the Big Six: Four Core Trends from ... [https://smallislandresearchnotes.com/ai-strategy-shifts-big-tech-four-core-trends/]
- 47. Evaluating the Impact of LLM-Assisted Annotation in a ... [https://arxiv.org/html/2510.25904v1]
- 48. Quality aspects of annotated data | AStA Wirtschafts [https://link.springer.com/article/10.1007/s11943-023-00332-y]
- 49. Multimodal learning enables chat-based exploration of ... [https://www.nature.com/articles/s41587-025-02857-9]
- 50. Beyond benchmarking and towards predictive models of ... [https://genomebiology.biomedcentral.com/articles/10.1186/s13059-024-03304-9]
- 51. Comparison of single-cell RNA-seq methods to enable ... [https://www.sciencedirect.com/science/article/pii/S2667237525002097]
- 52. Comparison of single-cell RNA-seq methods to enable ... [https://pubmed.ncbi.nlm.nih.gov/40957400/]